here. - Canadian Women's Health Network
here. - Canadian Women's Health Network
here. - Canadian Women's Health Network
- No tags were found...
You also want an ePaper? Increase the reach of your titles
YUMPU automatically turns print PDFs into web optimized ePapers that Google loves.
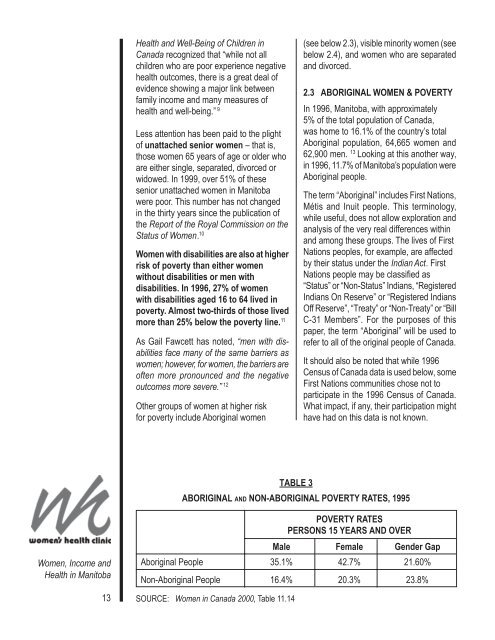
<strong>Health</strong> and Well-Being of Children inCanada recognized that “while not allchildren who are poor experience negativehealth outcomes, t<strong>here</strong> is a great deal ofevidence showing a major link betweenfamily income and many measures ofhealth and well-being.” 9Less attention has been paid to the plightof unattached senior women – that is,those women 65 years of age or older whoare either single, separated, divorced orwidowed. In 1999, over 51% of thesesenior unattached women in Manitobawere poor. This number has not changedin the thirty years since the publication ofthe Report of the Royal Commission on theStatus of Women. 10Women with disabilities are also at higherrisk of poverty than either womenwithout disabilities or men withdisabilities. In 1996, 27% of womenwith disabilities aged 16 to 64 lived inpoverty. Almost two-thirds of those livedmore than 25% below the poverty line. 11As Gail Fawcett has noted, “men with disabilitiesface many of the same barriers aswomen; however, for women, the barriers areoften more pronounced and the negativeoutcomes more severe.” 12Other groups of women at higher riskfor poverty include Aboriginal women(see below 2.3), visible minority women (seebelow 2.4), and women who are separatedand divorced.2.3 ABORIGINAL WOMEN & POVERTYIn 1996, Manitoba, with approximately5% of the total population of Canada,was home to 16.1% of the country’s totalAboriginal population, 64,665 women and62,900 men. 13 Looking at this another way,in 1996, 11.7% of Manitoba’s population wereAboriginal people.The term “Aboriginal” includes First Nations,Métis and Inuit people. This terminology,while useful, does not allow exploration andanalysis of the very real differences withinand among these groups. The lives of FirstNations peoples, for example, are affectedby their status under the Indian Act. FirstNations people may be classified as“Status” or “Non-Status” Indians, “RegisteredIndians On Reserve” or “Registered IndiansOff Reserve”, “Treaty” or “Non-Treaty” or “BillC-31 Members”. For the purposes of thispaper, the term “Aboriginal” will be used torefer to all of the original people of Canada.It should also be noted that while 1996Census of Canada data is used below, someFirst Nations communities chose not toparticipate in the 1996 Census of Canada.What impact, if any, their participation mighthave had on this data is not known.TABLE 3ABORIGINAL AND NON-ABORIGINAL POVERTY RATES, 1995Women, Income and<strong>Health</strong> in Manitoba13POVERTY RATESPERSONS 15 YEARS AND OVERMale Female Gender GapAboriginal People 35.1% 42.7% 21.60%Non-Aboriginal People 16.4% 20.3% 23.8%SOURCE: Women in Canada 2000, Table 11.14


