A Closer Look at Air Pollution in Houston: - Green Houston
A Closer Look at Air Pollution in Houston: - Green Houston
A Closer Look at Air Pollution in Houston: - Green Houston

Create successful ePaper yourself
Turn your PDF publications into a flip-book with our unique Google optimized e-Paper software.
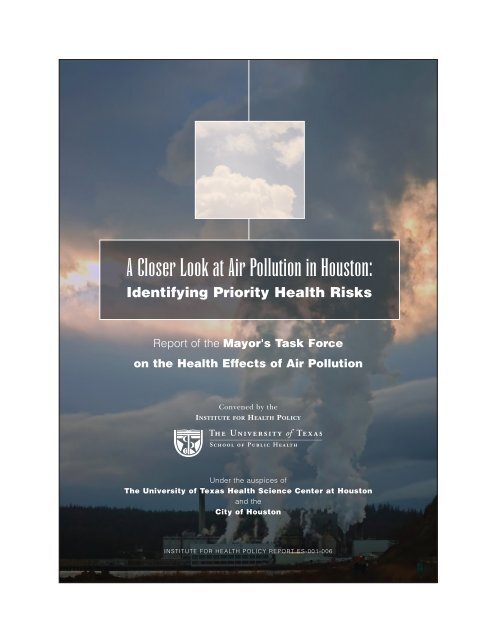
A <strong>Closer</strong> <strong>Look</strong> <strong>at</strong> <strong>Air</strong> <strong>Pollution</strong> <strong>in</strong> <strong>Houston</strong>:Identify<strong>in</strong>g Priority Health RisksReport of the Mayor's Task Forceon the Health Effects of <strong>Air</strong> <strong>Pollution</strong>Convened by theINSTITUTE FOR HEALTH POLICYUnder the auspices ofThe University of Texas Health Science Center <strong>at</strong> <strong>Houston</strong>and theCity of <strong>Houston</strong>INSTITUTE FOR HEALTH POLICY REPORT ES-001-006
All text, analysis and displays conta<strong>in</strong>ed with<strong>in</strong> the Report of the Mayor's TaskForce on the Health Effects of <strong>Air</strong> <strong>Pollution</strong> rema<strong>in</strong> the property of either their <strong>in</strong>dividualauthors or the Institute for Health Policy of The University of Texas Schoolof Public Health and should not be used or reproduced for any purpose withoutproper <strong>at</strong>tribution and cit<strong>at</strong>ion. Reproduction, redistribution, or modific<strong>at</strong>ion of thisReport for commercial purposes is prohibited without prior written permissionfrom the Institute for Health Policy, The University of Texas School of Public Health.Any questions regard<strong>in</strong>g the use or content of this report should be referred to theInstitute for Health Policy, <strong>at</strong> (713) 500-9318, Monday through Friday, from 8:30amto 5:00pm Central Standard Time. Requests regard<strong>in</strong>g authoriz<strong>at</strong>ions or permissionsshould be made <strong>in</strong> writ<strong>in</strong>g to: Institute for Health Policy, The University ofTexas School of Public Health, P.O. Box 20186, <strong>Houston</strong>, TX 77225.www.sph.uth.tmc.edu/ihpCover photo by Marc RasmussenAgency/Dreamstime.comInset cover photo by Stephen H. L<strong>in</strong>der
A <strong>Closer</strong> <strong>Look</strong> <strong>at</strong> <strong>Air</strong> <strong>Pollution</strong> <strong>in</strong> <strong>Houston</strong>:Identify<strong>in</strong>g Priority Health RisksReport of theMayor's Task Force on theHealth Effects of <strong>Air</strong> <strong>Pollution</strong>Convened by theINSTITUTE FOR HEALTH POLICYUnder the auspices ofThe University of Texas Health Science Center <strong>at</strong> <strong>Houston</strong>and theCity of <strong>Houston</strong>INSTITUTE FOR HEALTH POLICY REPORT ES-001-006Photo by Heidi Bethel
While there is some evidence th<strong>at</strong>levels of certa<strong>in</strong> air pollutants maybe decreas<strong>in</strong>g, there is still widespreadconcern th<strong>at</strong> progress istoo slow and th<strong>at</strong> the health ofmany <strong>Houston</strong>ians rema<strong>in</strong>s <strong>at</strong> risk.Photo by Heidi Bethel
Task Force MembersResearch StaffKen Sexton, Sc.D.Task Force DirectorThe University of Texas School of Public HealthBrownsville, TexasStephen L<strong>in</strong>der, Ph.D.Task Force Coord<strong>in</strong><strong>at</strong>orInstitute for Health PolicyThe University of Texas School of Public Health<strong>Houston</strong>, TexasStuart Abramson, M.D., Ph.D.Pedi<strong>at</strong>rics-Allergy and ImmunologyBaylor College of Medic<strong>in</strong>e<strong>Houston</strong>, TexasMelissa Bondy, Ph.D.Department of EpidemiologyThe University of Texas M. D. Anderson Cancer Center<strong>Houston</strong>, TexasGeorge Delclos, M.D., M.P.H.Division of Environmental and Occup<strong>at</strong>ional Health SciencesThe University of Texas School of Public Health<strong>Houston</strong>, TexasM<strong>at</strong>t Fraser, Ph.D.Department of Civil and Environmental Eng<strong>in</strong>eer<strong>in</strong>gRice University<strong>Houston</strong>, TexasTom Stock, Ph.D.Division of Environmental and Occup<strong>at</strong>ional Health SciencesThe University of Texas School of Public Health<strong>Houston</strong>, TexasJon<strong>at</strong>han Ward, Ph.D.Department of Preventive Medic<strong>in</strong>e and Community HealthThe University of Texas Medical BranchGalveston, TexasHeidi Bethel, Ph.D.U.S. Environmental Protection AgencyWash<strong>in</strong>gton, D.C.Dritana Marko, M.D., M.Sc.Institute for Health PolicyThe University of Texas School of Public Health<strong>Houston</strong>, TexasPhilip Lupo, M.P.H.Institute for Health PolicyThe University of Texas School of Public Health<strong>Houston</strong>, TexasConsultantsSupport StaffP<strong>at</strong>ty PooleInstitute for Health PolicyThe University of Texas School of Public Health<strong>Houston</strong>, TexasLarry YorkDepartment of Health and Human ServicesCity of <strong>Houston</strong>Michael Scheurer, Ph.D., M.P.H.Department of EpidemiologyThe University of Texas M. D. Anderson Cancer Center<strong>Houston</strong>, TexasDejian Lai, Ph.D.Division of Biost<strong>at</strong>isticsThe University of Texas School of Public Health<strong>Houston</strong>, Texas3
AcknowledgementsThe Task Force would like to thank the follow<strong>in</strong>g <strong>in</strong>dividuals from the City of <strong>Houston</strong> for their time and<strong>in</strong>put dur<strong>in</strong>g the prepar<strong>at</strong>ion of this report.Elena Marks, J.D., M.P.H.Director of Health PolicyCity of <strong>Houston</strong><strong>Houston</strong>, TexasArturo Blanco, M.P.A.Bureau of <strong>Air</strong> Quality ControlDepartment of Health & Human Services<strong>Houston</strong>, TexasDaniel Hoyt, P.E.Bureau of <strong>Air</strong> Quality ControlDepartment of Health & Human Services<strong>Houston</strong>, TexasKarl PeppleEnvironmental Programm<strong>in</strong>gCity of <strong>Houston</strong><strong>Houston</strong>, TexasLoren Raun, Ph.D.City of <strong>Houston</strong><strong>Houston</strong>, TexasWei-Yeong Wang, Ph.D., P.E.Bureau of <strong>Air</strong> Quality ControlDepartment of Health and Human ServicesCity of <strong>Houston</strong><strong>Houston</strong>, TexasThe Task Force would like to acknowledge the follow<strong>in</strong>g <strong>in</strong>dividuals for their technical guidance. They werenot <strong>in</strong>volved <strong>in</strong> either the prepar<strong>at</strong>ion or the review of this report and are covered by the disclaimer below.U.S. Environmental Protection AgencyRuben CassoU.S. EPA Region 6Dallas, TexasTed Palma, M.S.Office of <strong>Air</strong> Quality, Plann<strong>in</strong>g and StandardsResearch Triangle Park, North Carol<strong>in</strong>aAnne PopeOffice of <strong>Air</strong> Quality, Plann<strong>in</strong>g and StandardsResearch Triangle Park, North Carol<strong>in</strong>aJoann RiceOffice of <strong>Air</strong> Quality, Plann<strong>in</strong>g and StandardsResearch Triangle Park, North Carol<strong>in</strong>aRoy Smith, Ph.D.Office of <strong>Air</strong> Quality, Plann<strong>in</strong>g and StandardsResearch Triangle Park, North Carol<strong>in</strong>aMadele<strong>in</strong>e Strum, Ph.D.Office of <strong>Air</strong> Quality, Plann<strong>in</strong>g and StandardsResearch Triangle Park, North Carol<strong>in</strong>aJoe ToumaOffice of <strong>Air</strong> Quality, Plann<strong>in</strong>g and StandardsResearch Triangle Park, North Carol<strong>in</strong>aRuth T<strong>at</strong>omU.S. EPA RegionDallas, TexasCalifornia Environmental Protection AgencyRobert Blaisdell, Ph.D.Office of Environmental Health Hazard AssessmentOakland, CaliforniaAndrew Salmon, M.A., D.Phil.Office of Environmental Health Hazard AssessmentOakland, CaliforniaTexas Commission on Environmental QualityDavid BrymerMonitor<strong>in</strong>g Oper<strong>at</strong>ions DivisionAust<strong>in</strong>, TexasDavid ManisD<strong>at</strong>a Management and Quality Assurance SectionAust<strong>in</strong>, Texas<strong>Houston</strong> Advanced Research CenterJim Lester, Ph.D.Environment Group<strong>Houston</strong>, TexasGre<strong>at</strong>er <strong>Houston</strong> PartnershipSkip KasdorfEconomic Research<strong>Houston</strong>, Texas4
AcknowledgementsThe Task Force would like to offer special thanks toMichael Zilkha,whose generous gift to the Institute for Health Policy made this endeavor possible.DisclaimerThe op<strong>in</strong>ions and <strong>in</strong>terpret<strong>at</strong>ions expressed here<strong>in</strong> are the sole responsibility of the Mayor'sTask Force on the Health Effects of <strong>Air</strong> <strong>Pollution</strong> and do not necessarily reflect the official viewsof their respective organiz<strong>at</strong>ions or the views of the <strong>in</strong>dividuals and organiz<strong>at</strong>ions who contributedtheir technical expertise. The authors have <strong>at</strong>tempted to provide the most accur<strong>at</strong>e<strong>in</strong>form<strong>at</strong>ion and analysis accord<strong>in</strong>g to accepted research standards <strong>at</strong> the time of public<strong>at</strong>ion.5
AbstractPhoto by Aaron KohrAgency Dreamstime.comThousands of tons of potentially harmful chemicals are discharged eachday <strong>in</strong>to <strong>Houston</strong>'s <strong>at</strong>mosphere as a result of human activities, substances,and technologies.Consequently, people liv<strong>in</strong>g <strong>in</strong> <strong>Houston</strong> are exposedrout<strong>in</strong>ely to a myriad of pollutants <strong>in</strong> the air they bre<strong>at</strong>he. Estim<strong>at</strong>ed and/ormeasured concentr<strong>at</strong>ions of some of these airborne chemicals <strong>in</strong> ambientair are high enough to cause illness or <strong>in</strong>jury <strong>in</strong> exposed <strong>in</strong>dividuals, especiallythose <strong>in</strong> our society who are most vulnerable, such as children andseniors. Although the available d<strong>at</strong>a are <strong>in</strong>complete and uneven, the TaskForce surveyed <strong>in</strong>form<strong>at</strong>ion on 179 air pollutants and identified 12 substances<strong>in</strong> <strong>Houston</strong>'s air th<strong>at</strong> are def<strong>in</strong>ite risks to human health, 9 th<strong>at</strong> areprobable risks, and 24 th<strong>at</strong> are possible risks. Sixteen substances werefound to be unlikely risks to <strong>Houston</strong>ians <strong>at</strong> current ambient levels, and 118substances were labeled uncerta<strong>in</strong> risks because there was <strong>in</strong>adequ<strong>at</strong>e or<strong>in</strong>sufficient <strong>in</strong>form<strong>at</strong>ion to determ<strong>in</strong>e whether they presently pose a healththre<strong>at</strong> to <strong>Houston</strong> residents.6
Just because a task is difficult, however, does not necessarilymean th<strong>at</strong> it is not worth do<strong>in</strong>g. Members of the TaskForce acknowledge th<strong>at</strong> this exercise <strong>in</strong> compar<strong>at</strong>ive riskassessment <strong>in</strong>volves unavoidably imprecise, uncerta<strong>in</strong>, and<strong>in</strong>complete d<strong>at</strong>a. Nevertheless, they believe strongly th<strong>at</strong> theMayor's question is the right question to ask, and th<strong>at</strong> scientistsshould not shy away from respond<strong>in</strong>g, even when limitedknowledge and <strong>in</strong>adequ<strong>at</strong>e understand<strong>in</strong>g limit them to onlypartial or approxim<strong>at</strong>e answers.The risk rank<strong>in</strong>gs provided <strong>in</strong> this report represent theconsensus judgment of a group of objective, academicexperts. They are meant to draw the <strong>at</strong>tention of decision makersto those air pollutants th<strong>at</strong>, after tak<strong>in</strong>g account of all availableevidence, appear to constitute a real health thre<strong>at</strong> to<strong>Houston</strong>ians. The results should be used as a direction f<strong>in</strong>der,a compass if you will, to help guide decision makers as theystruggle with difficult choices about how best to alloc<strong>at</strong>e limitedresources among an overabundance of air pollution problems.In th<strong>at</strong> context, f<strong>in</strong>d<strong>in</strong>gs of the Task Force should not be takenas the f<strong>in</strong>al word or absolute truth, but r<strong>at</strong>her as an <strong>in</strong>itial<strong>at</strong>tempt to look comprehensively across the entirety of air pollutionproblems <strong>in</strong> <strong>Houston</strong> and set some provisional priorities. Itis our <strong>in</strong>tent th<strong>at</strong> the conclusions of the Task Force be subject tocont<strong>in</strong>uous ref<strong>in</strong>ement and modific<strong>at</strong>ion as new knowledgebecomes available. Ultim<strong>at</strong>ely, we hope th<strong>at</strong> the f<strong>in</strong>d<strong>in</strong>gs presentedhere will encourage constructive deb<strong>at</strong>e over betteroptions for reduc<strong>in</strong>g health risks, as well as stimul<strong>at</strong>e furtherresearch and cont<strong>in</strong>ual re-exam<strong>in</strong><strong>at</strong>ion of air pollution issues.Background<strong>Houston</strong> and Los Angeles are probably the two cities <strong>in</strong>the U.S. most associ<strong>at</strong>ed <strong>in</strong> the public m<strong>in</strong>d with air pollution.Over the past decade it was not unusual to see headl<strong>in</strong>es like“<strong>Houston</strong> passes L.A. <strong>in</strong> smog” or “Los Angeles retakes lead <strong>in</strong>air pollution.” <strong>Houston</strong>, with a popul<strong>at</strong>ion of more than 2 millionliv<strong>in</strong>g <strong>in</strong> an area of more than 600 square miles, is the largestcity <strong>in</strong> Texas and the fourth largest city <strong>in</strong> the U.S. (Los Angelesis second). It is the county se<strong>at</strong> of Harris County, which is thethird most populous <strong>in</strong> the country. The Gre<strong>at</strong>er <strong>Houston</strong> areais the seventh largest metropolitan area <strong>in</strong> the U.S. with a popul<strong>at</strong>ionof more than 5 million resid<strong>in</strong>g <strong>in</strong> 10 counties.As one would expect, there are numerous sources of airpollution <strong>in</strong> <strong>Houston</strong>. Tailpipe emissions from cars, trucks, andbuses are a significant source of airborne pollutants ow<strong>in</strong>g tothe fact th<strong>at</strong> <strong>Houston</strong>ians drive on average more than140,000,000 miles every day. A plethora of toxic pollutants areemitted <strong>in</strong>to <strong>Houston</strong>'s air by more than 400 chemical manufactur<strong>in</strong>gfacilities, <strong>in</strong>clud<strong>in</strong>g 2 of the 4 largest ref<strong>in</strong>eries <strong>in</strong> the U.S.The huge petrochemical complex along the <strong>Houston</strong> ShipChannel is the largest <strong>in</strong> the country, and the Port of <strong>Houston</strong>,which is the largest <strong>in</strong> the U.S. <strong>in</strong> terms of foreign tonnage andsecond <strong>in</strong> total tonnage, is the sixth-largest <strong>in</strong> the world.Add<strong>in</strong>g to the city's air pollution are aggreg<strong>at</strong>e airborne emissionsfrom many small oper<strong>at</strong>ions spread geographicallyacross Gre<strong>at</strong>er <strong>Houston</strong>, such as surface co<strong>at</strong><strong>in</strong>g processes,dry cleaners, gas st<strong>at</strong>ions, pr<strong>in</strong>t<strong>in</strong>g processes, restaurants,charcoal barbecues, and gasol<strong>in</strong>e-fueled lawn ma<strong>in</strong>tenanceequipment.Meteorology - Meteorological conditions and p<strong>at</strong>ternsalso contribute to the air pollution problem <strong>in</strong> <strong>Houston</strong>.Between April and October there tends to be a high number ofwarm sunny days with stagnant w<strong>in</strong>ds, which causes groundlevelbuildup of air pollutant concentr<strong>at</strong>ions, especially photochemicaloxidants such as ozone. Most air pollution episodes<strong>in</strong> <strong>Houston</strong> occur as the w<strong>in</strong>d direction rot<strong>at</strong>es cont<strong>in</strong>uouslyover a 24-hour period trapp<strong>in</strong>g a mass of stagnant, unmov<strong>in</strong>gair over the city. In these situ<strong>at</strong>ions elev<strong>at</strong>ed levels of air pollutionoccur <strong>in</strong> comb<strong>in</strong><strong>at</strong>ion with high temper<strong>at</strong>ures and humidity,mak<strong>in</strong>g the air <strong>in</strong> <strong>Houston</strong> hazy, malodorous, and oppressive.Pollutants and Sources - The pollution th<strong>at</strong> sometimesdegrades <strong>Houston</strong>'s air quality is made up of thousandsof airborne agents, <strong>in</strong>clud<strong>in</strong>g biological (e.g., ragweed pollen),chemical (e.g., benzene), and physical (e.g., noise) stressors,which <strong>in</strong>dividually and <strong>in</strong> comb<strong>in</strong><strong>at</strong>ion may have an adverseeffect on human health. Our focus <strong>in</strong> this report is on a subsetof all chemical pollutants (or classes of pollutants) likely to bepresent <strong>in</strong> urban airsheds and known or suspected to harmpeople <strong>at</strong> sufficiently elev<strong>at</strong>ed concentr<strong>at</strong>ions. N<strong>at</strong>ionalAmbient <strong>Air</strong> Quality Standards (NAAQS) have been promulg<strong>at</strong>edfor six substances. In this report we focus on two of thesepollutants - ozone and particul<strong>at</strong>e m<strong>at</strong>ter. Another 188 substancesare listed <strong>in</strong> the Clean <strong>Air</strong> Act as Hazardous <strong>Air</strong>Pollutants (HAPs) based on concerns about their toxicity, and8
(1 HOUR STANDARD)(1 HOUR STANDARD)10
<strong>in</strong>g, and route of exposure, and other factors like nutrition,health st<strong>at</strong>us, age, sex, and genetic makeup.The health risk posed by a particular air pollutant is usuallythought of as a comb<strong>in</strong><strong>at</strong>ion of both the likelihood and severityof harm th<strong>at</strong> may be experienced by people exposed to typicalambient concentr<strong>at</strong>ions present <strong>in</strong> the <strong>in</strong>door and outdoorair <strong>in</strong> their communities. A ”screen<strong>in</strong>g” or approxim<strong>at</strong>e estim<strong>at</strong>eof health risk can be calcul<strong>at</strong>ed by compar<strong>in</strong>g a measured ormodeled ambient concentr<strong>at</strong>ion aga<strong>in</strong>st an established healthwas based on how often, and by how much, ambient concentr<strong>at</strong>ionsexceeded the NAAQS. No such ambient concentr<strong>at</strong>ionexceedances were found for PM 2.5 concentr<strong>at</strong>ions <strong>in</strong> 2000through 2005 so the rank<strong>in</strong>g was based on the weight of the evidence<strong>in</strong>dic<strong>at</strong><strong>in</strong>g th<strong>at</strong> exposures <strong>at</strong> or below the exist<strong>in</strong>g standardmay contribute to <strong>in</strong>creased morbidity and mortality. Thetask of assign<strong>in</strong>g HAPs to particular risk c<strong>at</strong>egories was moredifficult for three reasons: there are currently no health-basedstandards, as there are for ozone and PM 2.5; there tends to berisk value - a threshold levelbased on the probability th<strong>at</strong> an<strong>in</strong>dividual (or members of aFigure 3Overview of the Risk Rank<strong>in</strong>g Approach Used by the Task Forcedef<strong>in</strong>ed popul<strong>at</strong>ion) exposed toth<strong>at</strong> airborne concentr<strong>at</strong>ion for alifetime will develop cancer.Theoretically, <strong>at</strong> least, thisapproach produces a roughnumerical estim<strong>at</strong>e of chronic riskfor each pollutant, which can thenbe used to sort <strong>in</strong>dividual chemicals<strong>in</strong>to appropri<strong>at</strong>e risk c<strong>at</strong>egories.But <strong>in</strong> reality there arenumerous complic<strong>at</strong>ions. Forexample, there are no established(consensus-based, governmentsanctioned)health risk values forover half of the HAPs. Furthermore,most HAPs are not measuredrout<strong>in</strong>ely <strong>at</strong> urban monitor<strong>in</strong>gsites so there is a scarcity of actualmeasurements to either estim<strong>at</strong>eambient concentr<strong>at</strong>ions orverify models used to predictambient concentr<strong>at</strong>ions. As aresult, compar<strong>at</strong>ive assessment ofair pollution-rel<strong>at</strong>ed health risks isunavoidably an exercise <strong>in</strong> scientificjudgment based on <strong>in</strong>complete and imperfect d<strong>at</strong>a.Rank<strong>in</strong>g Process - The Task Force used a system<strong>at</strong>icprocess to survey the available <strong>in</strong>form<strong>at</strong>ion and compare rel<strong>at</strong>iverisks among air pollutants <strong>in</strong> <strong>Houston</strong>. There are healthbasedstandards (NAAQS), as well as abundant health effects<strong>in</strong>form<strong>at</strong>ion and extensive exposure d<strong>at</strong>a for the two criteria pollutants(ozone and particul<strong>at</strong>e m<strong>at</strong>ter) <strong>in</strong>cluded <strong>in</strong> this analysis.Therefore, assignment of ozone to a particular risk c<strong>at</strong>egoryless d<strong>at</strong>a on l<strong>in</strong>kages between exposure and effects; andmeasurements of ambient concentr<strong>at</strong>ions are generally spottyor completely lack<strong>in</strong>g. The approach used by the Task Forceto compare rel<strong>at</strong>ive risks among these substances is summarizedgraphically <strong>in</strong> Figure 3 and expla<strong>in</strong>ed more fully <strong>in</strong>Appendix 1.To obta<strong>in</strong> estim<strong>at</strong>es of ambient concentr<strong>at</strong>ions for asmany HAPs as possible, the Task Force used modeled annu-11
al average concentr<strong>at</strong>ions for 1999 from EPA's N<strong>at</strong>ional-scale<strong>Air</strong> Toxics Assessment (NATA) (U.S. EPA, 2006d). A descriptionof NATA 1999 is presented <strong>in</strong> Appendix 2. Results fromthe NATA provided estim<strong>at</strong>ed ambient concentr<strong>at</strong>ions for 177substances (176 HAPs and diesel particul<strong>at</strong>e m<strong>at</strong>ter) <strong>in</strong> 895census tracts (each with approxim<strong>at</strong>ely 4,000 <strong>in</strong>habitants)<strong>in</strong>cluded <strong>in</strong> the 10-county Gre<strong>at</strong>er <strong>Houston</strong> area. The NATAvalues were derived by EPA us<strong>in</strong>g a computerized air dispersionmodel th<strong>at</strong> comb<strong>in</strong>ed 1999 airborne emissions d<strong>at</strong>a fromoutdoor sources, <strong>in</strong>clud<strong>in</strong>g po<strong>in</strong>t,mobile (on-road and non-road),area, and background sourceswith <strong>Houston</strong>-specific meteorologicalvariables. The model also took<strong>in</strong>to consider<strong>at</strong>ion the breakdown,deposition and transform<strong>at</strong>ion ofpollutants <strong>in</strong> the <strong>at</strong>mosphere aftertheir release. The Task Force supplementedthese d<strong>at</strong>a with measured2004 annual concentr<strong>at</strong>ionsfor 50 pollutants (49 HAPs plus adiesel particul<strong>at</strong>e m<strong>at</strong>ter surrog<strong>at</strong>e)from 20 monitor<strong>in</strong>g sites <strong>in</strong>and around <strong>Houston</strong> - 14 <strong>in</strong> HarrisCounty, 4 <strong>in</strong> Galveston, 1 <strong>in</strong>Brazoria, and 1 <strong>in</strong> Montgomery.These d<strong>at</strong>a were obta<strong>in</strong>ed fromEPA's <strong>Air</strong> Quality System (AQS);for a description of the AQSd<strong>at</strong>aset see Appendix 2. AllAQS d<strong>at</strong>a used for risk rank<strong>in</strong>gPhoto by Heidi Bethelwas from 2004 (U.S. EPA, 2006e), the most recent year forwhich complete d<strong>at</strong>a were available.To get a sense of rel<strong>at</strong>ive health risks associ<strong>at</strong>ed with estim<strong>at</strong>edambient concentr<strong>at</strong>ions of HAPs, the Task Force usedhealth-rel<strong>at</strong>ed toxicity values developed for health risk assessmentsby either the U.S. EPA or the California Office ofEnvironmental Health Hazard Assessment (OEHHA), whichevervalue was the more str<strong>in</strong>gent (health protective) (CaliforniaEPA & OEHHA, 2002; California OEHHA, 2005; U.S. EPA, 2005,2006h, 2006i). In <strong>in</strong>stances when no value was developed byUS EPA or California OEHHA, health values from other availablesources were used. A detailed table of health values is presented<strong>in</strong> Appendix 3, Table A3.1. For carc<strong>in</strong>ogens, estim<strong>at</strong>eswere based on their respective unit risk values (UREs),which represent the excess lifetime cancer risk estim<strong>at</strong>ed toresult from cont<strong>in</strong>uous lifetime exposure to an average concentr<strong>at</strong>ionof 1 microgram per cubic meter (µg/m3) of a certa<strong>in</strong> pollutant<strong>in</strong> the air. For noncarc<strong>in</strong>ogens, estim<strong>at</strong>es were based oncomparison of estim<strong>at</strong>ed ambient concentr<strong>at</strong>ions with theirrespective chronic non-cancer <strong>in</strong>hal<strong>at</strong>ion health values: referenceconcentr<strong>at</strong>ions (RfC) - usedby U.S. EPA; reference exposureslevels (REL) - used by CaliforniaOEHHA; or m<strong>in</strong>imum risk levels(MRL) - used by the Agency forToxic Substances and DiseaseRegistry (ATSDR).Each HAP was assigned <strong>in</strong>itiallyto a specific risk c<strong>at</strong>egorycont<strong>in</strong>gent on how measured ormodeled annual-average concentr<strong>at</strong>ionstransl<strong>at</strong>ed <strong>in</strong>to compar<strong>at</strong>iverisk estim<strong>at</strong>es us<strong>in</strong>g establishedUREs (carc<strong>in</strong>ogens) and/orRfCs, RELs, or MRLs (noncarc<strong>in</strong>ogens).Initial risk-c<strong>at</strong>egory assignmentswere adjusted, as necessary,based on evalu<strong>at</strong>ion of additional<strong>in</strong>form<strong>at</strong>ion about rel<strong>at</strong>iveemission quantities and number ofcensus tracts or monitor<strong>in</strong>g st<strong>at</strong>ionsaffected. See Appendix 1for a thorough explan<strong>at</strong>ion on the rank<strong>in</strong>g process.F<strong>in</strong>al Risk C<strong>at</strong>egories - Us<strong>in</strong>g the process outl<strong>in</strong>edabove, the Task Force assigned each of the 179 air pollutants(176 HAPs modeled and/or monitored, ozone, f<strong>in</strong>e particul<strong>at</strong>em<strong>at</strong>ter, and diesel particul<strong>at</strong>e m<strong>at</strong>ter) to one of five compar<strong>at</strong>iverisk c<strong>at</strong>egories. Substances were design<strong>at</strong>ed “UnlikelyRisks” when there was suggestive evidence of negligible or<strong>in</strong>significant risk to the general popul<strong>at</strong>ion and vulnerable subgroups.Substances were deemed “Uncerta<strong>in</strong> Risks” whenthere was <strong>in</strong>adequ<strong>at</strong>e or <strong>in</strong>sufficient evidence to ascerta<strong>in</strong>whether they posed a significant risk to the general popul<strong>at</strong>ion12
and vulnerable subgroups. Substances were design<strong>at</strong>ed“Possible Risks” when there was partial or limited evidenceth<strong>at</strong> suggested they might constitute a significant risk undercerta<strong>in</strong> circumstances, and “Probable Risks” when therewas substantial corrobor<strong>at</strong><strong>in</strong>g evidence th<strong>at</strong> they were likely torepresent a significant risk under the right conditions. Thosesubstances for which there was compell<strong>in</strong>g and conv<strong>in</strong>c<strong>in</strong>g evidenceof significant risk to the general popul<strong>at</strong>ion or vulnerablesubgroups <strong>at</strong> current ambient concentr<strong>at</strong>ions were labeled“Def<strong>in</strong>ite Risks.”As shown <strong>in</strong> Table 1, 12 air pollutants were classified as“Def<strong>in</strong>ite Risks”. The Task Force found th<strong>at</strong> exist<strong>in</strong>g and projectedambient concentr<strong>at</strong>ions of two criteria pollutants - ozoneand f<strong>in</strong>e particles (PM 2.5) - are almost certa<strong>in</strong>ly caus<strong>in</strong>g respir<strong>at</strong>oryand cardiopulmonary effects <strong>in</strong> some <strong>in</strong>dividuals as wellas contribut<strong>in</strong>g to prem<strong>at</strong>ure de<strong>at</strong>h. It was also determ<strong>in</strong>ed th<strong>at</strong>airborne concentr<strong>at</strong>ions of seven carc<strong>in</strong>ogens - diesel particul<strong>at</strong>em<strong>at</strong>ter (see Appendix 4 for more detail on this pollutant),1,3-butadiene, chromium VI (see Appendix 4 for more detailon this pollutant), benzene, ethylene dibromide, formaldehyde,and acrylonitrile - pose an unacceptable <strong>in</strong>creased cancer risk.In addition, it was concluded th<strong>at</strong> five substances -- 1,3-butadience(reproductive effects <strong>in</strong> addition to be<strong>in</strong>g a carc<strong>in</strong>ogen),formaldehyde (respir<strong>at</strong>ory effects), acrole<strong>in</strong> (respir<strong>at</strong>oryeffects), chlor<strong>in</strong>e (respir<strong>at</strong>ory effects), hexamethylene diisocyan<strong>at</strong>e(pulmonary and respir<strong>at</strong>ory effects). -- are present <strong>at</strong>ambient concentr<strong>at</strong>ions th<strong>at</strong> represent an unacceptable<strong>in</strong>creased risk for chronic disease <strong>in</strong> <strong>Houston</strong>.The evidence is not as strong but nevertheless persuasiveth<strong>at</strong> an additional 9 air pollutants are likely to pose unacceptablehealth risks <strong>at</strong> concentr<strong>at</strong>ions measured or modeled<strong>in</strong> <strong>Houston</strong> air. These substances were design<strong>at</strong>ed as“Probable Risks,” and <strong>in</strong>cluded eight carc<strong>in</strong>ogens - v<strong>in</strong>yl chloride,acetaldehyde, ethylene dichloride, naphthalene, arseniccompounds, carbon tetrachloride, ethylene oxide, 1,1,2,2-tetrachloroethane- and one pollutant - acrylic acid - th<strong>at</strong> has chronicnon-cancer effects. These are shown <strong>in</strong> Table 2 on pg. 14.13
The evidence available for another 24 air pollutants waseven more limited, but still suggestive th<strong>at</strong> <strong>Houston</strong>ians might,<strong>in</strong> certa<strong>in</strong> situ<strong>at</strong>ions, experience neg<strong>at</strong>ive health consequencesfrom exposure to plausible concentr<strong>at</strong>ions <strong>in</strong> ambientair. Twenty-two of these substances are carc<strong>in</strong>ogens and,as summarized <strong>in</strong> Table 3 on pg. 15, the Task Force classifiedthem as “Possible Risks”.The Task Force deemed 16 air pollutants to be “UnlikelyRisks” (See Table 4 on pg. 16) because available evidencesuggests th<strong>at</strong> they probably cre<strong>at</strong>e no significant thre<strong>at</strong> of harmfor <strong>Houston</strong>ians. Two of these substances - coke oven emissionsand nitrosodimethylam<strong>in</strong>e - have zero reported emissions;two have negligible modeled ambient concentr<strong>at</strong>ions;and 12 have unknown emissions <strong>in</strong> the Gre<strong>at</strong>er <strong>Houston</strong> Area.The Task Force labeled 118 air pollutants as “Uncerta<strong>in</strong>Risks”. The complete list<strong>in</strong>g appears <strong>in</strong> Appendix 5.Pollutants were assigned to this c<strong>at</strong>egory because there was<strong>in</strong>adequ<strong>at</strong>e or <strong>in</strong>sufficient <strong>in</strong>form<strong>at</strong>ion to determ<strong>in</strong>e whether theycurrently pose a significant health thre<strong>at</strong> to the residents of<strong>Houston</strong>. There are almost twice as many substancesassigned to this risk c<strong>at</strong>egory as to the other four classific<strong>at</strong>ionscomb<strong>in</strong>ed. Of these 118 air pollutants, 16 are carc<strong>in</strong>ogensemitted <strong>in</strong> Gre<strong>at</strong>er <strong>Houston</strong> for which UREs are available; 45 arenoncarc<strong>in</strong>ogens emitted <strong>in</strong> Gre<strong>at</strong>er <strong>Houston</strong> for which RfCs areavailable; 17 are emitted here and have both a URE and RfC;and f<strong>in</strong>ally, 27 are emitted here but have neither a URE nor anRfC. Another 13 pollutants of the 118 do not appear <strong>in</strong> theemissions <strong>in</strong>ventory for the Gre<strong>at</strong>er <strong>Houston</strong> Area, 1 of which(1,2-diphenylhydraz<strong>in</strong>e) is a carc<strong>in</strong>ogen with a URE (seeAppendix 5).In summary, the Task Force surveyed d<strong>at</strong>a on ambientconcentr<strong>at</strong>ions (from the U.S. EPA and the <strong>Houston</strong> monitor<strong>in</strong>gnetwork) for 179 air pollutants th<strong>at</strong> might potentially affect thehealth of <strong>Houston</strong>ians. Of these 179 pollutants, 137 HAPs haverel<strong>at</strong>ed health-based benchmarks (from the U.S. EPA andCalifornia OEHHA) and 2 pollutants (ozone and f<strong>in</strong>e particul<strong>at</strong>em<strong>at</strong>ter) are regul<strong>at</strong>ed by N<strong>at</strong>ional Ambient <strong>Air</strong> QualityStandards. After review<strong>in</strong>g the evidence, it was the collectiveop<strong>in</strong>ion of Task Force members th<strong>at</strong>, currently and <strong>in</strong>to the foreseeablefuture, 12 substances are def<strong>in</strong>ite risks, 9 are probablerisks, 24 are possible risks, 118 are uncerta<strong>in</strong> risks, and 16 areunlikely risks. The most appropri<strong>at</strong>e focus for additional publichealth concern and effort is <strong>in</strong>itially on the 21 substancesranked as either def<strong>in</strong>ite or probable risks. As shown <strong>in</strong> Tables1 and 2, they represent a comb<strong>in</strong><strong>at</strong>ion of carc<strong>in</strong>ogens and noncarc<strong>in</strong>ogensemitted by a diversity of source c<strong>at</strong>egories.Cave<strong>at</strong>s - It is critical to understand th<strong>at</strong> assessment ofair pollution-rel<strong>at</strong>ed health risks is not an exact science. Forexample, annual f<strong>at</strong>alities <strong>in</strong> a particular city from car accidents,homicides, or lightn<strong>in</strong>g strikes can be determ<strong>in</strong>ed quite14
accur<strong>at</strong>ely from de<strong>at</strong>h certific<strong>at</strong>es. But the number of f<strong>at</strong>alitiesrel<strong>at</strong>ed to air pollution cannot be so easily and precisely ascerta<strong>in</strong>ed,except when exceptional pollution episodes cause significantand proximal <strong>in</strong>creases <strong>in</strong> mortality, as <strong>in</strong> the MeuseValley <strong>in</strong> 1930, Donora, Pennsylvania <strong>in</strong> 1948, and London <strong>in</strong>1952. Today, improved air quality <strong>in</strong> most American cities, andthe fact th<strong>at</strong> cause-and-effect rel<strong>at</strong>ionships are less welldef<strong>in</strong>ed<strong>at</strong> lower ambient concentr<strong>at</strong>ions, make it necessary touse st<strong>at</strong>istical techniques, along with appropri<strong>at</strong>e scientificassumptions and approxim<strong>at</strong>ions to estim<strong>at</strong>e the number of“theoretical” de<strong>at</strong>hs from air pollution likely to occur under artificial(but hopefully realistic) exposure scenarios.Efforts to measure air pollution-rel<strong>at</strong>ed risks (both morbidityand mortality) directly are stymied by an array of problemsth<strong>at</strong> make it difficult to establish causality between typical levelsof urban air pollution and connected adverse health effects.Among the common obstacles th<strong>at</strong> normally confront riskassessors are the follow<strong>in</strong>g:■ Incomplete understand<strong>in</strong>g of disease etiology;■ Wide range of non-environmental causes for mostdiseases to which environmental agents contribute;■ Environmental pollutants often enhance orexacerb<strong>at</strong>e, r<strong>at</strong>her than only cause disease ordysfunction;15
■ Lack of suitable methods, measurements, andmodels to a) estim<strong>at</strong>e exposure, dose, and effects,and b) characterize variability over <strong>in</strong>dividuals, time,and space;■ Deficiency of surveillance and report<strong>in</strong>g systemsfor exposure and environmentally-rel<strong>at</strong>edhealth outcomes;■ Long l<strong>at</strong>ency period from exposure to neg<strong>at</strong>ivehealth consequences for many environmentally<strong>in</strong>duceddiseases (e.g., lung cancer);■ Real-world exposures occur not to a s<strong>in</strong>glepollutant, but to complic<strong>at</strong>ed mixtures ofenvironmental agents th<strong>at</strong> vary both temporallyand sp<strong>at</strong>ially;■ Observed health endpo<strong>in</strong>ts (e.g., lung damage)may not be the primary target of the environmentalagent (e.g., immune system); and■ Inherent variability among <strong>in</strong>dividuals <strong>in</strong> terms ofbiological (e.g., genetic) susceptibility toenvironmentally-<strong>in</strong>duced illness and <strong>in</strong>jury.It is also important to keep <strong>in</strong> m<strong>in</strong>d th<strong>at</strong> the Task Forceconsidered only a specific and narrowly def<strong>in</strong>ed type of risk -namely the harmful chronic (long-term) effects of human<strong>in</strong>hal<strong>at</strong>ion exposure to estim<strong>at</strong>ed annual-average outdoorconcentr<strong>at</strong>ions of 179 chemical pollutants. <strong>Air</strong> pollution canalso cause acute (short-term) effects <strong>in</strong> people, as well asserious impairment to ecological resources (e.g., fish, wildlife)and damage to social welfare (e.g., poor visibility, degradedproperty values). People are exposed to other chemical, biological,and physical agents <strong>in</strong> the air they bre<strong>at</strong>he, and reallifeexposures are not just to outdoor air pollutants but also toairborne contam<strong>in</strong>ants <strong>in</strong>side residences, cars, workplaces,restaurants, and other sett<strong>in</strong>gs. Also, certa<strong>in</strong> substances <strong>in</strong><strong>Houston</strong>'s ambient air, <strong>in</strong>clud<strong>in</strong>g photochemical degrad<strong>at</strong>ionproducts and short-lived <strong>in</strong>termedi<strong>at</strong>es, may pose significanthealth risks, and are not well understood because of theircomplex photochemistry. Consider<strong>at</strong>ion of these and otherpotentially noteworthy factors, such as cumul<strong>at</strong>ive effectsfrom simultaneous or sequential exposure to multiple stressorsby various p<strong>at</strong>hways and routes, were explicitly excludedfrom this <strong>in</strong>itial assessment to make the task manageableand feasible with<strong>in</strong> time and resource constra<strong>in</strong>ts.F<strong>in</strong>ally, it should be remembered th<strong>at</strong> the Task Force usedonly d<strong>at</strong>a th<strong>at</strong> were on hand or easily obta<strong>in</strong>able to complete itsassessment. Ambient concentr<strong>at</strong>ion estim<strong>at</strong>es by census tractwere only available for one year (1999) from NATA’s most recent16
assessments, and monitor<strong>in</strong>g d<strong>at</strong>a from 20 st<strong>at</strong>ions <strong>in</strong> <strong>Houston</strong>were only available for a small fraction of HAPs, and only analyzed<strong>in</strong> depth for 2004, the most recent complete year. TheTask Force used “off-the-shelf” health values (UREs andRfCs/RELs/MRLs) from the U.S. EPA (U.S. EPA, 2005, 2006h,2006i), the California OEHHA (California EPA & OEHHA, 2002;California OEHHA, 2005) and the Agency for Toxic Substancesand Disease Registry (ATSDR) to estim<strong>at</strong>e health risks, implicitlyassum<strong>in</strong>g th<strong>at</strong> these unmodified risk values were uniformlyapplicable to the <strong>Houston</strong> situ<strong>at</strong>ion and popul<strong>at</strong>ion.SUMMARY OF AIR POLLUTION-RELATEDHEALTH EFFECTSThousands of epidemiologic (human) and toxicologic(animal) studies conducted over the past 35 years have documentedthe fact th<strong>at</strong> urban air pollution <strong>at</strong> sufficiently elev<strong>at</strong>edconcentr<strong>at</strong>ions can adversely affect human health. Poor airquality can potentially cause or contribute to a variety of harmfuloutcomes, rang<strong>in</strong>g from subtle biochemical and physiologicalchanges, to symptoms like headaches, eye and thro<strong>at</strong> irrit<strong>at</strong>ion,wheez<strong>in</strong>g and cough<strong>in</strong>g, difficulty bre<strong>at</strong>h<strong>in</strong>g, aggrav<strong>at</strong>ionof exist<strong>in</strong>g respir<strong>at</strong>ory and cardiovascular conditions,chronic respir<strong>at</strong>ory disease, cancer, and prem<strong>at</strong>ure de<strong>at</strong>h.Although the most obvious effects are typically on the respir<strong>at</strong>oryand cardiovascular systems, many air pollutants can harmdevelopment processes and be toxic to other systems, <strong>in</strong>clud<strong>in</strong>g,among others, nervous, reproductive, immune, digestive,ur<strong>in</strong>ary and endocr<strong>in</strong>e systems. In addition, numerous air pollutantsare known or suspected human carc<strong>in</strong>ogens.Ozone-rel<strong>at</strong>ed health effects are of special <strong>in</strong>terestbecause <strong>Houston</strong> currently exceeds the NAAQS standard.Ozone is a strong oxidiz<strong>in</strong>g agent, and short-term exposures onthe order of m<strong>in</strong>utes to hours can impair pulmonary function,decrease lung volumes and flows, and <strong>in</strong>crease airway responsiveness,resistance, and irrit<strong>at</strong>ion. Evidence <strong>in</strong>dic<strong>at</strong>es th<strong>at</strong> asubstantial fraction of summertime hospital visits and admissionsfor respir<strong>at</strong>ory problems are associ<strong>at</strong>ed with elev<strong>at</strong>edshort-term ozone levels. Repe<strong>at</strong>ed daily short-term exposure toozone can cause an <strong>in</strong>creased response to bronchial allergenchallenges <strong>in</strong> subjects with preexist<strong>in</strong>g allergic airway disease,with or without asthma. Long-term exposure to ozone overmonths to years can cause structural changes <strong>in</strong> the respir<strong>at</strong>orytract, and may play a role <strong>in</strong> caus<strong>in</strong>g irreversible lung damage.Ozone exposure can also impair the immune system soth<strong>at</strong> people are more susceptible to respir<strong>at</strong>ory <strong>in</strong>fections, likecolds and pneumonia.Although <strong>Houston</strong> does not exceed the current NAAQSfor either of the regul<strong>at</strong>ed fractions of particul<strong>at</strong>e m<strong>at</strong>ter (PM 2.5and PM 10), it is likely to exceed the new f<strong>in</strong>e (PM 2.5) particlestandard if and when it is promulg<strong>at</strong>ed. Particul<strong>at</strong>e m<strong>at</strong>ter is acomb<strong>in</strong><strong>at</strong>ion of solid, liquid, and solid-liquid particles suspended<strong>in</strong> air, and typically is composed of a complex mixture oforganic and <strong>in</strong>organic constituents. F<strong>in</strong>e particles, with aerodynamicdiameters ≤ 2.5 microns, are taken <strong>in</strong>to the deepest partof the lungs, where they tend to rema<strong>in</strong> trapped among millionsof t<strong>in</strong>y alveoli. Short-term exposures (m<strong>in</strong>utes to hours) to elev<strong>at</strong>edlevels of PM 2.5 have been l<strong>in</strong>ked with physiologicalchanges, biomarkers of cardiac changes, decreased lungfunction, <strong>in</strong>creased respir<strong>at</strong>ory symptoms, emergency roomvisits and hospitaliz<strong>at</strong>ion for cardiopulmonary diseases, andmortality from cardiopulmonary diseases. Longer-term exposures(months to years) have been causally associ<strong>at</strong>ed witheffects on the respir<strong>at</strong>ory system, such as decreased lung function,development of chronic respir<strong>at</strong>ory disease, and mortalityfrom cardiopulmonary diseases and lung cancer.There is no NAAQS for diesel particul<strong>at</strong>e m<strong>at</strong>ter, however,concerns about human health effects recently promptedCalifornia to list it as a Toxic <strong>Air</strong> Contam<strong>in</strong>ant (TAC) (CaliforniaARB, 1998; California ARB & OEHHA, 1998). Diesel exhaust,which is ubiquitous <strong>in</strong> urban environments, is a complex mixtureof hundreds of toxic substances, <strong>in</strong>clud<strong>in</strong>g gaseous andparticul<strong>at</strong>e constituents. The particles <strong>in</strong> diesel exhaust aremostly 2.5 microns, and are composed of an elemental carboncore with adsorbed organic compounds and small amounts ofsulf<strong>at</strong>e, nitr<strong>at</strong>e, metals, and other trace elements. Short-termexposures (m<strong>in</strong>utes to hours) may cause eye, thro<strong>at</strong>, andbronchial irrit<strong>at</strong>ion, lightheadedness, nausea, cough, andphlegm, as well as exacerb<strong>at</strong>ion of allergic responses andasthma-like symptoms. Long-term exposures (months toyears) may play a role <strong>in</strong> chronic respir<strong>at</strong>ory disease, and arelikely to <strong>in</strong>crease the risk of develop<strong>in</strong>g lung cancer.Short-term, high-level exposure (m<strong>in</strong>utes to hours) tomany of these substances, like benzene, toluene, and17
Depend<strong>in</strong>g on exposure and other factors, evenhealthy adults may suffer acute or chronic effectsfrom this air pollution miasma.Photo by Hannu LiivaarAgency/Dreamstime.comformaldehyde, can cause headaches, difficulty bre<strong>at</strong>h<strong>in</strong>g,nausea, confusion, and seizures. Long-term, lower-levelexposure (months to years) to HAPs may cause many differentadverse health effects, <strong>in</strong>clud<strong>in</strong>g cancer and damage torespir<strong>at</strong>ory, circul<strong>at</strong>ory (cardiovascular), nervous, reproductive,digestive (GI tract), endocr<strong>in</strong>e, and immune systems, aswell as kidney, blood and developmental effects. Despite thefact th<strong>at</strong> many HAPs are ever-present <strong>in</strong> urban <strong>at</strong>mospheres,few cities or communities have extensive monitor<strong>in</strong>g networksfor this diverse concoction of air pollutants.A recently released study by the U.S. EPA, the N<strong>at</strong>ionalscale<strong>Air</strong> Toxics Assessment or NATA, exam<strong>in</strong>ed the effect of1999 emissions on ambient concentr<strong>at</strong>ions and rel<strong>at</strong>ed exposuresacross the U.S. (U.S. EPA, 2006b). They found th<strong>at</strong>n<strong>at</strong>ionally, benzene accounted for almost 25 percent of theestim<strong>at</strong>ed lifetime cancer risk from the HAPs studied, andth<strong>at</strong> together with six other pollutants -- carbon tetrachloride,chromium VI, polycyclic organic m<strong>at</strong>ter (POM), 1,3-butadience,formaldehyde, and coke oven emissions -- accountedfor over 90% of the estim<strong>at</strong>ed HAP-rel<strong>at</strong>ed cancer risk.Acrole<strong>in</strong> (respir<strong>at</strong>ory effects), formaldehyde (respir<strong>at</strong>oryeffects), and diesel particul<strong>at</strong>e m<strong>at</strong>ter (variety of effects) werefound to pose the top three non-cancer health risks amongHAPs. Acrole<strong>in</strong> alone contributed 91 percent of the risk forrespir<strong>at</strong>ory effects n<strong>at</strong>ion-wide.Although air pollutants are typically identified, studied,assessed, and regul<strong>at</strong>ed one <strong>at</strong> a time, this is obviously notthe way they are encountered as part of everyday urban life.On a “smoggy” day <strong>in</strong> <strong>Houston</strong>, or a typical day for th<strong>at</strong> m<strong>at</strong>ter,residents are simultaneously exposed to a complic<strong>at</strong>edmix of ozone, particul<strong>at</strong>e m<strong>at</strong>ter, carbon monoxide, sulfurdioxide, nitrogen oxides, lead, diesel exhaust, benzene, POM,1,3-butadiene, formaldehyde, and hundreds of other airbornechemicals. Depend<strong>in</strong>g on exposure and other factors, evenhealthy adults may suffer acute or chronic effects from this airpollution miasma. But those most likely to be affected are theelderly, particularly those with lung and heart disease, childrenand adults with asthma, chronic obstructive pulmonarydisease or other respir<strong>at</strong>ory illnesses, <strong>in</strong>dividuals with cardiovasculardisease, pregnant women and their fetuses, andchildren <strong>in</strong> general because, compared to adults, they <strong>in</strong>halemore air per kilogram of body weight, bre<strong>at</strong>he more rapidly,and tend to bre<strong>at</strong>he through their mouth more often.For more <strong>in</strong>form<strong>at</strong>ion on health effects of pollutants <strong>in</strong> theDef<strong>in</strong>ite Risk c<strong>at</strong>egory, see Appendix 6.VULNERABLE POPULATIONSA diversity of factors may affect the n<strong>at</strong>ure and magnitudeof health risks associ<strong>at</strong>ed with bre<strong>at</strong>h<strong>in</strong>g a specific concentr<strong>at</strong>ionof polluted air. Suppose, for example, th<strong>at</strong> ambient air pollutionlevels <strong>in</strong> a large city <strong>in</strong> the upper Midwest are equivalentto those <strong>in</strong> <strong>Houston</strong>. Rel<strong>at</strong>ed chronic health risks for residents<strong>in</strong> one city may, nevertheless, differ dram<strong>at</strong>ically from the otherbecause of differences <strong>in</strong> clim<strong>at</strong>e (e.g., temper<strong>at</strong>ure, rel<strong>at</strong>ivehumidity), meteorology (e.g., w<strong>in</strong>d speed, mix<strong>in</strong>g heights),build<strong>in</strong>g characteristics (e.g., air exchange r<strong>at</strong>es), commut<strong>in</strong>gmodes and p<strong>at</strong>terns (e.g., use of public transport<strong>at</strong>ion, timespent <strong>in</strong> traffic), activity p<strong>at</strong>terns and lifestyles (e.g., percentageof time <strong>in</strong>doors versus outdoors, exercise and nutritionalhabits), smok<strong>in</strong>g prevalence (e.g., proportion of children liv<strong>in</strong>g<strong>in</strong> homes with smokers), and socio-demographic and occup<strong>at</strong>ionalcharacteristics of the popul<strong>at</strong>ion (e.g., age distribution,genetic makeup, median household <strong>in</strong>come and educ<strong>at</strong>ion).18
The reality is th<strong>at</strong>, even <strong>at</strong> similar ambient pollutant levels, airpollution-rel<strong>at</strong>ed health risks can diverge considerably not onlyfrom city to city, but also from community to community, neighborhoodto neighborhood, street to street, house to house, andperson to person.Just as different <strong>in</strong>dividuals may respond dissimilarly tothe same dose of a particular prescription medic<strong>in</strong>e, so too candifferent <strong>in</strong>dividuals be affected dissimilarly by equal concentr<strong>at</strong>ions(or doses) of air pollution. The n<strong>at</strong>ure, likelihood, andseverity of air pollution-rel<strong>at</strong>ed health effects are directly rel<strong>at</strong>edto the vulnerability of exposed <strong>in</strong>dividuals and popul<strong>at</strong>ions. Inthis context, vulnerability is used to mean the conditions determ<strong>in</strong>edby physical, social, economic, and environmental factorsor processes, which <strong>in</strong>crease the susceptibility of a communityor an <strong>in</strong>dividual to the impact of hazards. There are fourgeneral types of vulnerability th<strong>at</strong> <strong>in</strong>fluence air pollution-rel<strong>at</strong>edhealth effects: <strong>in</strong>ter-<strong>in</strong>dividual differences <strong>in</strong> biological susceptibility;differential exposure; disparities <strong>in</strong> preparedness tocope with air pollution exposure; and divergence <strong>in</strong> the abilityto recover from air pollution exposure. It is important to noteth<strong>at</strong> these c<strong>at</strong>egories are not mutually exclusive, and th<strong>at</strong> popul<strong>at</strong>ionswith disproportion<strong>at</strong>e numbers of vulnerable <strong>in</strong>dividualswill be more likely to suffer air pollution-rel<strong>at</strong>ed discomfort,dysfunction, disability, disease, and de<strong>at</strong>h (U.S. EPA, 2003).Biological Susceptibility - Some people are geneticallypredisposed to experience adverse effects from air pollutionbecause they have genetic polymorphisms th<strong>at</strong> change thelevel of expression of a gene or the activity of gene product,such as an enzyme. Life stage can also affect susceptibility,and it is well established th<strong>at</strong> pregnant women, fetuses, children,and the elderly tend to be more prone to air pollutionrel<strong>at</strong>edeffects. Furthermore, those with preexist<strong>in</strong>g medicalconditions, such as asthma or heart disease, are also more likelyto endure adverse effects from air pollution exposure.Differential Exposure - When two <strong>in</strong>dividuals or popul<strong>at</strong>ionshave different exposures to air pollution, they are <strong>at</strong> differentpo<strong>in</strong>ts on the dose-response curve, which means th<strong>at</strong>they may have dissimilar likelihoods of suffer<strong>in</strong>g adverseeffects. This can be true for contemporaneous exposure (e.g.,two <strong>in</strong>dividuals are exposed to different air pollution levels <strong>at</strong>the same time), historical exposure (e.g., two <strong>in</strong>dividuals areexposed to the same level now but had different exposures <strong>in</strong>the past), background exposure (e.g., two <strong>in</strong>dividuals have thesame exposure now to ambient (outdoor) air pollution but havedifferent current exposure to <strong>in</strong>door (or background) air pollution),and body burden (e.g., two <strong>in</strong>dividuals have the sameexposure now to air pollution but have different levels of environmentalchemicals, their metabolites, or reaction products <strong>in</strong>their bodies).Another important factor th<strong>at</strong> may affect disparities <strong>in</strong>exposure to ambient air pollution is the presence and use of aircondition<strong>in</strong>g (cool<strong>in</strong>g and he<strong>at</strong><strong>in</strong>g systems). The use of air condition<strong>in</strong>gisol<strong>at</strong>es <strong>in</strong>door from outdoor air, and decreases the<strong>in</strong>filtr<strong>at</strong>ion of ambient pollutants <strong>in</strong>to residences and other build<strong>in</strong>gs.Residents of economically disadvantaged neighborhoodsmay either not have air condition<strong>in</strong>g, or limit its use,result<strong>in</strong>g <strong>in</strong> dependence on n<strong>at</strong>ural ventil<strong>at</strong>ion, and thus gre<strong>at</strong>erexposure to outdoor pollutants.Disparities <strong>in</strong> Preparedness to Cope - Differences<strong>in</strong> the quality and quantity of cop<strong>in</strong>g systems and resourcesavailable to an <strong>in</strong>dividual or popul<strong>at</strong>ion can affect their ability towithstand the effects of air pollution exposure. For example,two children may be exposed to the same concentr<strong>at</strong>ion of airpollution, but one may suffer no ill effects because her parentscould afford disease immuniz<strong>at</strong>ions, rout<strong>in</strong>e medical and dentalcheckups, daycare, a healthy diet, and vitam<strong>in</strong> supplements,while the other may get sick because she did not have thesesame advantages - and thus was less able to withstand the airpollution <strong>in</strong>sult.Divergence <strong>in</strong> Ability to Recover - Differences <strong>in</strong>the quality and quantity of cop<strong>in</strong>g systems and resources availableto an <strong>in</strong>dividual or popul<strong>at</strong>ion can affect their ability torecover from the effects of air pollution. For example, two childrenwith air pollution-<strong>in</strong>duced respir<strong>at</strong>ory problems may beexposed to the same concentr<strong>at</strong>ion of air pollution, but one mayhave fewer symptoms, less severe symptoms, less frequentdisease episodes, slower progression of the disease, and abetter prognosis for full recovery because his parents are morehealth conscious, more knowledgeable about environmentally<strong>in</strong>duceddisease, more <strong>in</strong> control of their home environmentand, most importantly, more affluent, which means they canafford health <strong>in</strong>surance, better medical care, prescription medic<strong>in</strong>e,and more nutritious food (U.S. EPA, 2003).19
CUMULATIVE RISKS FROM EXPOSURE TOMULTIPLE AIR POLLUTANTSVulnerable groups as well as the general public areexposed every day dur<strong>in</strong>g normal activities to a varied array ofthousands of environmental pollutants <strong>in</strong> the air they bre<strong>at</strong>he,the w<strong>at</strong>er and beverages they dr<strong>in</strong>k, the food they e<strong>at</strong>, the surfacesthey touch, and the products they use. The cumul<strong>at</strong>iveeffects of this complex and ever-chang<strong>in</strong>g brew of environmentalstressors, <strong>in</strong>clud<strong>in</strong>g biological (e.g., Mycobacterium tuberculosis),chemical (e.g., 1,3-butadiene), physical (e.g., he<strong>at</strong>,noise), and psychosocial (e.g., job- or family-rel<strong>at</strong>ed stress)agents, may be critically important for accur<strong>at</strong>e assessment ofenvironmentally-<strong>in</strong>duced risks, <strong>in</strong>clud<strong>in</strong>g those rel<strong>at</strong>ed to airpollution. We know, for example, th<strong>at</strong> exposure to tobaccosmoke and asbestos or radon <strong>in</strong>creases the risk of develop<strong>in</strong>glung cancer over wh<strong>at</strong> would be expected from simple additionof <strong>in</strong>dividual effects. Moreover, there is evidence th<strong>at</strong> exposureto noise and toluene results <strong>in</strong> higher risk of hear<strong>in</strong>g loss thanfrom either stressor alone, th<strong>at</strong> exposure to polycyclic arom<strong>at</strong>ichydrocarbons and ultraviolet radi<strong>at</strong>ion <strong>in</strong>creases toxicity toaqu<strong>at</strong>ic organisms, and th<strong>at</strong> adults with <strong>in</strong>creased perceivedstress and children of parents experienc<strong>in</strong>g stress are moresusceptible to viral <strong>in</strong>fections.Thus, it is essential to keep <strong>in</strong> m<strong>in</strong>d th<strong>at</strong> the health risk ofany particular chemical <strong>in</strong> outdoor air is just a lone contributorto the cumul<strong>at</strong>ive risk from the sum of all chemicalsbre<strong>at</strong>hed <strong>in</strong> ambient air, which, <strong>in</strong> turn, is merely a share of thecumul<strong>at</strong>ive risk associ<strong>at</strong>ed with aggreg<strong>at</strong>e airborne chemicalexposures th<strong>at</strong> occur <strong>in</strong> all <strong>in</strong>door and outdoor environmentsand for all occup<strong>at</strong>ional and non-occup<strong>at</strong>ional activities.Even this is only part of the story, however, because to estim<strong>at</strong>ecumul<strong>at</strong>ive <strong>in</strong>hal<strong>at</strong>ion risk it is also necessarily to takeaccount of the effects from concurrent exposure to biological,physical, and psychosocial stressors. In the end, a realisticestim<strong>at</strong>e of cumul<strong>at</strong>ive health risks from total air pollutionexposure would have to <strong>in</strong>corpor<strong>at</strong>e not only consider<strong>at</strong>ion ofthe variables described above, but also of the contemporaneousrisks from all pert<strong>in</strong>ent routes of exposure (i.e., <strong>in</strong>hal<strong>at</strong>ion,<strong>in</strong>gestion, and dermal absorption) over all applicable temporaland sp<strong>at</strong>ial dimensions.In reality, comprehensive assessment of cumul<strong>at</strong>ive, airpollution-rel<strong>at</strong>ed health risk is presently precluded by the lackof appropri<strong>at</strong>e methods, measurements, and models to estim<strong>at</strong>erelevant exposures and rel<strong>at</strong>ed health effects. We are, forexample, unsure <strong>in</strong> most cases whether the comb<strong>in</strong>ed consequencesof <strong>in</strong>hal<strong>at</strong>ion exposure to multiple air pollutants arelikely to be <strong>in</strong>dependent (substances cause separ<strong>at</strong>e, unrel<strong>at</strong>edeffects), additive (effect of one substance adds to the other),synergistic (effects are more than additive), or antagonistic(effects are less than additive). In the absence of better <strong>in</strong>form<strong>at</strong>ion,it is common practice to assume th<strong>at</strong> risks are additivefor all airborne carc<strong>in</strong>ogens (regardless of type of cancer), andfor all systemic toxicants (i.e., caus<strong>in</strong>g chronic effects otherthan cancer, such as <strong>in</strong>jury to the respir<strong>at</strong>ory or nervous systems)th<strong>at</strong> affect the same organ system (e.g., respir<strong>at</strong>ory, cardiopulmonary,neurologic, reproductive).The bottom-l<strong>in</strong>e message is th<strong>at</strong> the risk c<strong>at</strong>egories discussedearlier are based solely on consider<strong>at</strong>ion of the healtheffects caused by ambient (outdoor) concentr<strong>at</strong>ions of each<strong>in</strong>dividual substance or group of substances act<strong>in</strong>g alone. Riskrank<strong>in</strong>gs might change, for <strong>in</strong>stance, if we took account of actualexposures, which are determ<strong>in</strong>ed by comb<strong>in</strong><strong>in</strong>g <strong>in</strong>form<strong>at</strong>ionabout (a) airborne concentr<strong>at</strong>ions <strong>in</strong> various <strong>in</strong>door and outdoorloc<strong>at</strong>ions, (<strong>in</strong>clud<strong>in</strong>g both occup<strong>at</strong>ional and non-occup<strong>at</strong>ionalsett<strong>in</strong>gs) through which people move, and (b) the time theyspend <strong>in</strong> each place (or microenvironment). Further modific<strong>at</strong>ionscould occur if the rank<strong>in</strong>gs factored <strong>in</strong> other cumul<strong>at</strong>iverisk issues, such as <strong>in</strong>teractions among multiple pollutants th<strong>at</strong>cause similar effects or the comb<strong>in</strong>ed vulnerabilities of highlyexposed popul<strong>at</strong>ions.A CASE STUDY - CUMULATIVE RISKS INA VULNERABLE COMMUNITYAt this po<strong>in</strong>t, it is useful to illustr<strong>at</strong>e how the characteristicsof popul<strong>at</strong>ions and neighborhoods can rel<strong>at</strong>e to sources ofhazardous air pollutants and put some people's health <strong>at</strong> muchgre<strong>at</strong>er risk. An earlier section <strong>in</strong>troduced the notion th<strong>at</strong> peoplemay be more vulnerable to pollution's health effects for avariety of reasons <strong>in</strong>clud<strong>in</strong>g whether they live closer to highconcentr<strong>at</strong>ions of pollutants, already suffer from disease or dis-20
ability, have <strong>in</strong>adequ<strong>at</strong>e means to cope with stresses, or fewerresources to recover. The neighborhoods of East <strong>Houston</strong>share many of these characteristics and provide a concreteexample of how different risks can add up when they are concentr<strong>at</strong>ed<strong>in</strong> a few areas.About half of the po<strong>in</strong>t sources for air pollution <strong>in</strong> theGre<strong>at</strong>er <strong>Houston</strong> area are concentr<strong>at</strong>ed on the eastern side ofHarris County. Over twenty of the largest <strong>in</strong>dustrial sources areloc<strong>at</strong>ed <strong>in</strong> East <strong>Houston</strong>. The Port of <strong>Houston</strong>, and the ShipChannel th<strong>at</strong> feeds it, passes through the middle of this areaand gener<strong>at</strong>es a variety of hazardous pollutants, add<strong>in</strong>g tothose from the nearby <strong>in</strong>dustrial sources. Four major highways<strong>in</strong>tersect this area <strong>in</strong>clud<strong>in</strong>g, Interst<strong>at</strong>e Highways 10, 610 and45 and St<strong>at</strong>e Highway 225; each gener<strong>at</strong><strong>in</strong>g substantial pollutionfrom high traffic density. With<strong>in</strong> the City of <strong>Houston</strong>, thereare n<strong>in</strong>e super-neighborhoods th<strong>at</strong> span this area: DenverHarbor/Port <strong>Houston</strong>, Pleasantville, Cl<strong>in</strong>ton Park/Tri-Community,Magnolia Park, Lawndale/Wayside, Harrisburg/Manchester,Pecan Park, Park Place, and Meadowbrook/Allendale. On thebasis of loc<strong>at</strong>ion alone these neighborhoods appear far morevulnerable to health risks than others <strong>in</strong> Gre<strong>at</strong>er <strong>Houston</strong>.More detail can be provided by the N<strong>at</strong>ional-scale <strong>Air</strong>Toxics Assessment (NATA) 1999 (U.S. EPA, 2006d), s<strong>in</strong>ce it hasmodeled ambient concentr<strong>at</strong>ions of pollutants <strong>at</strong> the level of thecensus tract. There are 895 census tracts <strong>in</strong> the Gre<strong>at</strong>er<strong>Houston</strong> area, and 28 of these are loc<strong>at</strong>ed <strong>in</strong> the n<strong>in</strong>e superneighborhoods<strong>in</strong> East <strong>Houston</strong>. If we consider only the 12 pollutantswhose concentr<strong>at</strong>ions and toxicity put them <strong>in</strong> our highestrisk c<strong>at</strong>egory, most census tracts have one or two pollutantspresent <strong>at</strong> this high level. Ozone, for example is rel<strong>at</strong>ively pervasive.The reveal<strong>in</strong>g contrast comes <strong>in</strong> the comparisonbetween the total picture of the 895 census tracts and a closerlook <strong>at</strong> the 28 th<strong>at</strong> make up our super-neighborhoods.Figure 4 shows the tally of how many census tractsregister harmful ambient concentr<strong>at</strong>ions of HAPs (th<strong>at</strong> is, <strong>at</strong>the level of a def<strong>in</strong>ite health risk) for one or more pollutants <strong>in</strong>the Gre<strong>at</strong>er <strong>Houston</strong> area. Over 80 percent of all censustracts show three or fewer pollutants <strong>at</strong> a level th<strong>at</strong> high.Figure 4 Gre<strong>at</strong>er <strong>Houston</strong> Area Census Tracts byNumber of Def<strong>in</strong>ite Risk PollutantsNumber of Pollutants21
Figure 5 gives the correspond<strong>in</strong>g tally for our East <strong>Houston</strong>neighborhoods. None of the East <strong>Houston</strong> census tracts havefewer than 3 pollutants <strong>in</strong> the highest risk c<strong>at</strong>egory. Almost 90percent of the census tracts loc<strong>at</strong>ed here have four or morepollutants present. Further, the one tract <strong>in</strong> the entire <strong>Houston</strong>area th<strong>at</strong> has seven pollutants present <strong>at</strong> our highest risk levelfalls <strong>in</strong> one of these neighborhoods. Of the tracts throughoutGre<strong>at</strong>er <strong>Houston</strong> th<strong>at</strong> have 6 or more pollutants, fully half ofthem appear <strong>in</strong> East <strong>Houston</strong>.The way these pollutant concentr<strong>at</strong>ions are distributeddisproportion<strong>at</strong>ely <strong>in</strong> East <strong>Houston</strong> neighborhoods suggests agre<strong>at</strong>er burden of exposure for residents there, as compared tothose liv<strong>in</strong>g <strong>in</strong> other parts of the city. If we consider th<strong>at</strong> theeffects of exposure to each different pollutant can be cumul<strong>at</strong>ive,then neighborhoods with 5 or more pollutants present willface a higher lifetime risk of cancer or chronic disease thanthose where only one or two of these pollutants are found.If we factor <strong>in</strong> some of the other dimensions of vulnerabilitymentioned above, then the overall risks to health <strong>in</strong>creasestill further. The median level of family <strong>in</strong>come <strong>in</strong> our 9 superneighborhoodsis more than 30 percent lower than for the Cityof <strong>Houston</strong>; over a quarter of the residents fall below the povertylevel. Almost 20 percent of the residents have less than an<strong>in</strong>th grade educ<strong>at</strong>ion. These neighborhoods have some of thehighest un<strong>in</strong>sured r<strong>at</strong>es for health coverage <strong>in</strong> Harris County.Consider the census tracts th<strong>at</strong> have 6 or 7 of the 12 pollutantsfound <strong>at</strong> levels th<strong>at</strong> pose a def<strong>in</strong>ite risk to health. Thesetracts appear <strong>in</strong> orange and red on the map <strong>in</strong> Appendix 7.Two super-neighborhoods account for the majority of thesetracts: Cl<strong>in</strong>ton Park/Tri-Community and Harrisburg/Manchester,the l<strong>at</strong>ter conta<strong>in</strong><strong>in</strong>g the tract <strong>in</strong> red with 7 pollutants.Harrisburg/Manchester is the poorer of the two; the median percapita <strong>in</strong>come (drawn from the U.S. Census for 2000) is $8,820.For Cl<strong>in</strong>ton Park, it is $9,529. As a reference po<strong>in</strong>t, the City ofFigure 5 East <strong>Houston</strong> Census Tracts byNumber of Def<strong>in</strong>ite Risk PollutantsNumber of Pollutants22
<strong>Houston</strong> reaches $21,701. These are neighborhoods whereresidents live on less than half of the <strong>in</strong>come of their fellow<strong>Houston</strong>ians.In Harrisburg/Manchester, 37 percent of the residentshave less than a high school educ<strong>at</strong>ion, and 32 percent fallbelow the Federal poverty level - double the r<strong>at</strong>e for the surround<strong>in</strong>gcounty. In Cl<strong>in</strong>ton Park, 27 percent have less than ahigh school educ<strong>at</strong>ion, and the same percent fall below thepoverty level. The residents <strong>in</strong> these neighborhoods are alsosegreg<strong>at</strong>ed by race or ethnicity. Cl<strong>in</strong>ton Park is over 90 percentAfrican-American. Harrisburg/Manchester is 88 percentHispanic. Further, the p<strong>at</strong>tern of land use shows pockets ofresidences surrounded by <strong>in</strong>dustrial sites, either disposallagoons for dredged m<strong>at</strong>erial from the Ship Channel <strong>at</strong> Cl<strong>in</strong>tonPark or fence l<strong>in</strong>es beh<strong>in</strong>d heavy <strong>in</strong>dustry for Harrisburg/Manchester. The conditions necessary for healthy lifestyles,economic sustenance and quality of life for residents are fewerhere than <strong>in</strong> most neighborhoods.Aside from vulnerability, there is also the question ofwhether the sources of the pollutants pos<strong>in</strong>g the highest risksare the same <strong>in</strong> East <strong>Houston</strong> as <strong>in</strong> the rest of the Gre<strong>at</strong>er<strong>Houston</strong> Area. As it turns out, they are typically not the same.For East <strong>Houston</strong>, NATA <strong>at</strong>tributes the ambient modeled concentr<strong>at</strong>ionsof 7 of the top 12 pollutants to po<strong>in</strong>t sources; for theGre<strong>at</strong>er <strong>Houston</strong> Area, this number drops to 3. East <strong>Houston</strong>had no pollutants where area sources dom<strong>in</strong><strong>at</strong>ed among those<strong>in</strong> the def<strong>in</strong>ite risk c<strong>at</strong>egory; Gre<strong>at</strong>er <strong>Houston</strong> had 1. Betweenon-road and non-road mobile sources, the most dram<strong>at</strong>ic differenceis for diesel particul<strong>at</strong>e m<strong>at</strong>ter: over 90 percent of theambient modeled concentr<strong>at</strong>ions <strong>in</strong> East <strong>Houston</strong> neighborhoodsare <strong>at</strong>tributed to non-road mobile sources compared tothree-quarters of the total <strong>in</strong> Gre<strong>at</strong>er <strong>Houston</strong>.The map <strong>in</strong> Appendix 7 also shows several monitor<strong>in</strong>gsites where one or more of the pollutants <strong>in</strong> the def<strong>in</strong>ite risk c<strong>at</strong>egoryare currently be<strong>in</strong>g measured (The supplemental TableA8.1 <strong>in</strong> Appendix 8 shows which pollutants are monitored).S<strong>in</strong>ce these sites record ambient concentr<strong>at</strong>ions, the levelspresent <strong>in</strong> any given census tract cannot be accur<strong>at</strong>elydeterm<strong>in</strong>ed without consider<strong>in</strong>g factors such as w<strong>in</strong>d directionand temper<strong>at</strong>ure. Nonetheless, the sites th<strong>at</strong> appear <strong>in</strong>Appendix 7 recorded annual average concentr<strong>at</strong>ions for2004 th<strong>at</strong> exceeded our health value thresholds for pos<strong>in</strong>gdef<strong>in</strong>ite health risks. Three of these sites are conta<strong>in</strong>ed <strong>in</strong> oradjacent to the neighborhoods th<strong>at</strong> also had the largest numberof def<strong>in</strong>ite risk pollutants, based on NATA modeled estim<strong>at</strong>esfor 1999.In sum, East <strong>Houston</strong> neighborhoods th<strong>at</strong> face a numberof vulnerabilities based on their marg<strong>in</strong>al social and economicstand<strong>in</strong>g also carry a heavier burden of health risks frombre<strong>at</strong>h<strong>in</strong>g pollutants <strong>in</strong> their air. They tend to be loc<strong>at</strong>ed closerto major po<strong>in</strong>t sources than most other neighborhoods <strong>in</strong> theGre<strong>at</strong>er <strong>Houston</strong> area and to be nearer to major transport<strong>at</strong>ioncorridors. The burden of these risks taken together poses specialneeds <strong>in</strong> these neighborhoods.CONCLUSIONS AND RECOMMENDATIONSSubstantial efforts have been devoted over the years toscrut<strong>in</strong>iz<strong>in</strong>g air pollution levels <strong>in</strong> <strong>Houston</strong>, and considerableresources have been expended on mitig<strong>at</strong>ion measures.Although the success of these endeavors is difficult to quantify,it appears th<strong>at</strong> levels of some air pollutants, like ozone, havedecreased s<strong>in</strong>ce the early 1980s even though <strong>Houston</strong>'s popul<strong>at</strong>ion,economy, and traffic have grown steadily. Much of theprogress over the past 35 years can be <strong>at</strong>tributed to regul<strong>at</strong>orycontrols mand<strong>at</strong>ed by the 1970 Clean <strong>Air</strong> Act and subsequentamendments. But air quality improvements <strong>in</strong> <strong>Houston</strong> appearto have slowed or even stalled recently, and there is legitim<strong>at</strong>econcern th<strong>at</strong> m<strong>at</strong>ters will only get worse. A critical first step <strong>in</strong>f<strong>in</strong>d<strong>in</strong>g cost-effective solutions is to identify those airborne pollutantsth<strong>at</strong> represent the most serious health risks so th<strong>at</strong> controlstr<strong>at</strong>egies can be designed to focus on the worst risks first.Historically, federal and st<strong>at</strong>e regul<strong>at</strong>ory efforts have beendirected primarily toward meet<strong>in</strong>g N<strong>at</strong>ional Ambient <strong>Air</strong> QualityStandards for the 6 criteria pollutants commonly found <strong>in</strong> urbanair. Most of the <strong>at</strong>tention <strong>in</strong> <strong>Houston</strong> has been on ozone -- theonly criteria pollutant for which the city is not <strong>in</strong> compliance --because of harsh penalties mand<strong>at</strong>ed by the Clean <strong>Air</strong> Act ifambient ozone concentr<strong>at</strong>ions do not meet the 8-hour standardby June 2010 (an unlikely prospect). There is also a grow<strong>in</strong>gbody of evidence <strong>in</strong>dic<strong>at</strong><strong>in</strong>g th<strong>at</strong> f<strong>in</strong>e particul<strong>at</strong>e m<strong>at</strong>ter causessignificant health effects <strong>at</strong> ambient concentr<strong>at</strong>ions below the23
exist<strong>in</strong>g NAAQS. Consequently, it is possible th<strong>at</strong> the standardwill be lowered, thereby putt<strong>in</strong>g <strong>Houston</strong> <strong>in</strong> noncompliance andmak<strong>in</strong>g it subject to further penalties. Regardless of the st<strong>at</strong>utoryissues surround<strong>in</strong>g ozone and PM 2.5, and despite longstand<strong>in</strong>gand ongo<strong>in</strong>g control programs, the Task Force determ<strong>in</strong>edth<strong>at</strong> current outdoor concentr<strong>at</strong>ions of both ozone andf<strong>in</strong>e particul<strong>at</strong>e m<strong>at</strong>ter represent a real and present thre<strong>at</strong> to thehealth of <strong>Houston</strong> residents.Diesel exhaust is a complic<strong>at</strong>ed chemical mixture th<strong>at</strong>contributes to ambient levels of both gaseous and particul<strong>at</strong>eair pollution <strong>in</strong> urban and rural environments. It conta<strong>in</strong>smany known or suspected cancer-caus<strong>in</strong>g substances aswell as other harmful pollutants th<strong>at</strong> may cause acute andchronic health effects. The widespread use of diesel eng<strong>in</strong>esmeans th<strong>at</strong> diesel exhaust and its by-products are ubiquitous<strong>in</strong> urban <strong>at</strong>mospheres, and exposure is virtually unavoidablefor city dwellers. Among those most likely to experience higher-than-averageexposures are commuters, <strong>in</strong>clud<strong>in</strong>g childrenrid<strong>in</strong>g school buses, bus and truck drivers, oper<strong>at</strong>ors of heavyequipment, and people liv<strong>in</strong>g near busy streets and roadways,port facilities, <strong>in</strong>dustrial plants, and truck load<strong>in</strong>g andunload<strong>in</strong>g oper<strong>at</strong>ions. Although direct measurements ofambient concentr<strong>at</strong>ions are unavailable, <strong>in</strong>direct estim<strong>at</strong>es ofdiesel particle levels <strong>in</strong> <strong>Houston</strong> suggest th<strong>at</strong> residents areexperienc<strong>in</strong>g <strong>in</strong>creased risk of illness and prem<strong>at</strong>ure de<strong>at</strong>hfrom current exposures.The identific<strong>at</strong>ion of ozone, PM 2.5, and diesel particul<strong>at</strong>em<strong>at</strong>ter as def<strong>in</strong>ite health risks is rel<strong>at</strong>ively straightforward ow<strong>in</strong>gto the compar<strong>at</strong>ively large d<strong>at</strong>a base on adverse health effectsth<strong>at</strong> exists for each substance, along with clear evidence th<strong>at</strong>people are exposed to outdoor levels considered unsafe. Thepicture is generally less certa<strong>in</strong> and more problem<strong>at</strong>ic for theHAPs, which <strong>in</strong>clude a diverse mix of carc<strong>in</strong>ogens and systemictoxicants. These air pollutants historically have receivedless regul<strong>at</strong>ory <strong>at</strong>tention, and ambient concentr<strong>at</strong>ions andexposure-effect rel<strong>at</strong>ionships tend to be less well characterized.Accord<strong>in</strong>gly, unambiguous assignment of these substancesto a particular risk c<strong>at</strong>egory is often h<strong>in</strong>dered by<strong>in</strong>complete and <strong>in</strong>adequ<strong>at</strong>e d<strong>at</strong>a, mak<strong>in</strong>g it necessary <strong>in</strong> many<strong>in</strong>stances to use scientific judgment as a basis for extrapol<strong>at</strong><strong>in</strong>gbeyond the limited or nonexistent d<strong>at</strong>a base.Despite these difficulties, the Task Force found conv<strong>in</strong>c<strong>in</strong>gevidence th<strong>at</strong> 12 HAPs are def<strong>in</strong>ite health risks for<strong>Houston</strong>ians - 4 carc<strong>in</strong>ogens, 4 systemic toxicants, 2 substancesth<strong>at</strong> are both, ozone, and f<strong>in</strong>e particul<strong>at</strong>e m<strong>at</strong>ter (SeeAppendix 8, Table A8.1). Another 9 (7 cancer-caus<strong>in</strong>gagents, 1 systemic toxicant, and 1 th<strong>at</strong> is both) were design<strong>at</strong>edprobable risks because the Task Force deemed there wassufficient, although less compell<strong>in</strong>g evidence th<strong>at</strong> they currentlypose significant health risks for people liv<strong>in</strong>g <strong>in</strong> <strong>Houston</strong> (seeAppendix 8, Table A8.2). Although available d<strong>at</strong>a werepartial and uneven, the Task Force also decided there was sufficientsuggestive evidence to justify label<strong>in</strong>g an additional 24substances - 20 carc<strong>in</strong>ogens, 2 systemic toxicants, and 2 th<strong>at</strong>are both - as possible health risks <strong>at</strong> ambient concentr<strong>at</strong>ions <strong>in</strong><strong>Houston</strong> air. A further 16 substances, all carc<strong>in</strong>ogens, werefound to represent unlikely health risks because there are noknown emissions <strong>in</strong> the <strong>Houston</strong> area and/or model<strong>in</strong>g suggestedth<strong>at</strong> ambient levels are likely to be negligible (seeTable 4).The <strong>in</strong>tr<strong>in</strong>sic challenges of compar<strong>in</strong>g HAPs-rel<strong>at</strong>edhealth risks are illustr<strong>at</strong>ed by the fact th<strong>at</strong> 118 (67%) of the 176HAPs exam<strong>in</strong>ed by the Task Force were assigned to the uncerta<strong>in</strong>risk c<strong>at</strong>egory. This decision was based on our collectivejudgment th<strong>at</strong> there is <strong>in</strong>sufficient evidence on hand to ascerta<strong>in</strong>whether these substances currently pose a significantthre<strong>at</strong> to the health and well-be<strong>in</strong>g of <strong>Houston</strong> residents. Inshort, it was not possible to say, with an acceptable degree ofcerta<strong>in</strong>ty, whether these pollutants are a health risk. Obviously,from a public health perspective this leaves us <strong>in</strong> an uns<strong>at</strong>isfy<strong>in</strong>gsitu<strong>at</strong>ion, where<strong>in</strong> we lack the necessary scientific <strong>in</strong>form<strong>at</strong>ionto dist<strong>in</strong>guish among def<strong>in</strong>ite, probable, possible, andunlikely health risks. Only targeted research aimed <strong>at</strong> fill<strong>in</strong>gcritical d<strong>at</strong>a gaps and resolv<strong>in</strong>g crucial uncerta<strong>in</strong>ties will allowus eventually to (a) determ<strong>in</strong>e the appropri<strong>at</strong>e risk c<strong>at</strong>egory forHAPs presently listed as uncerta<strong>in</strong> risks, and (b) verify the riskassignments for HAPs <strong>in</strong> other c<strong>at</strong>egories.Notwithstand<strong>in</strong>g the <strong>in</strong>herent scientific uncerta<strong>in</strong>ties, theresults of our assessment further re<strong>in</strong>force the prevail<strong>in</strong>g op<strong>in</strong>ionof many experts th<strong>at</strong> ambient air pollution <strong>in</strong> <strong>Houston</strong> isharmful to exposed <strong>in</strong>dividuals and popul<strong>at</strong>ions. Furthermore,we know th<strong>at</strong> air pollution-rel<strong>at</strong>ed health risks disproportion<strong>at</strong>e-24
In summary, we view the compar<strong>at</strong>ive risk process as a decisiontool for organiz<strong>in</strong>g and analyz<strong>in</strong>g <strong>in</strong>form<strong>at</strong>ion about airpollution <strong>in</strong> a manner th<strong>at</strong> will aid decision makers as theyPhoto by Heidi Bethelchoose among compet<strong>in</strong>g priorities.ly affect those most vulnerable - the young, the elderly, the sick,the pregnant, the unborn, and the poor. Cumul<strong>at</strong>ive health risksfrom comb<strong>in</strong>ed effects of concurrent exposure to multiple airpollutants are a particular concern <strong>in</strong> vulnerable popul<strong>at</strong>ions.Socio-economically disadvantaged groups, for example, aremore likely to live near <strong>in</strong>dustrial facilities and busy roadways,where air pollution levels are typically elev<strong>at</strong>ed. Moreover, theyare also more likely to work <strong>in</strong> hazardous occup<strong>at</strong>ions, to reside<strong>in</strong> dilapid<strong>at</strong>ed hous<strong>in</strong>g with <strong>in</strong>adequ<strong>at</strong>e air condition<strong>in</strong>g, to e<strong>at</strong>a substandard diet, to smoke cigarettes and dr<strong>in</strong>k alcohol, andto generally live more stressful and less healthful lifestyles. Ittherefore makes sense from a public health perspective todirect <strong>at</strong>tention and resources toward high-risk groups so as toanticip<strong>at</strong>e and prevent adverse effects, if possible. Fail<strong>in</strong>g th<strong>at</strong>,emphasis should be placed on stopp<strong>in</strong>g or limit<strong>in</strong>g exposuresth<strong>at</strong> damage the health and well-be<strong>in</strong>g of the most vulnerable<strong>in</strong> our society.As we look for cost-effective solutions, it is imper<strong>at</strong>ive tounderstand and acknowledge th<strong>at</strong> air pollution is a by-productof our culture and our way of life. It is produced as a directresult of choices we make, both <strong>in</strong>dividually and collectively,about energy sources, technologies, economic activities, andlifestyles. While the rel<strong>at</strong>ive contribution of a particular sourceor source c<strong>at</strong>egory may vary from place to place, it is theblend<strong>in</strong>g together of comb<strong>in</strong>ed emissions from numerouspo<strong>in</strong>t, mobile, and area sources th<strong>at</strong> makes <strong>Houston</strong>'s airquality unhealthful. Thus, focus<strong>in</strong>g on a s<strong>in</strong>gle type of source,no m<strong>at</strong>ter how obvious or obnoxious, is unlikely, by itself, tosolve the problem.In summary, we view the compar<strong>at</strong>ive risk process as adecision tool for organiz<strong>in</strong>g and analyz<strong>in</strong>g <strong>in</strong>form<strong>at</strong>ion about airpollution <strong>in</strong> a manner th<strong>at</strong> will aid decision makers as theychoose among compet<strong>in</strong>g priorities. It is not, <strong>in</strong> our op<strong>in</strong>ion, adecision rule th<strong>at</strong> autom<strong>at</strong>ically and <strong>in</strong>evitably leads to a specificconclusion about resource alloc<strong>at</strong>ion. We hope our risk rank<strong>in</strong>gswill be a useful adjunct to other relevant <strong>in</strong>form<strong>at</strong>ion, andth<strong>at</strong> results will contribute to <strong>in</strong>formed decisions not only abouthow to use available resources more effectively and efficiently,but also about how to justify the need for additional fund<strong>in</strong>g.We recommend th<strong>at</strong> decision makers avoid us<strong>in</strong>g our f<strong>in</strong>d<strong>in</strong>gsas a detailed road map th<strong>at</strong> provides precise directions abouthow to move forward; <strong>in</strong>stead, we recommend th<strong>at</strong> they useresults as a compass to help determ<strong>in</strong>e appropri<strong>at</strong>e directionsfor the development of an overarch<strong>in</strong>g str<strong>at</strong>egy to address<strong>Houston</strong>'s air pollution problem.25
As we look for cost-effective solutions, it is imper<strong>at</strong>iveto understand and acknowledge th<strong>at</strong> air pollution isa by-product of our culture and our way of life.26
AppendicesPhoto by Heidi Bethel27
Appendix 1The Risk Rank<strong>in</strong>g Procedure: An Illustr<strong>at</strong>ion for BenzeneConsider the key question addressed <strong>in</strong> this report:“Which ambient air pollutants are the most likely to pose significanthealth risks for current and future residents of <strong>Houston</strong>?”For purposes of this report, ambient air pollutants <strong>in</strong>clude:HAPs and diesel particul<strong>at</strong>es, as well as two criteria pollutants,ozone and f<strong>in</strong>e particul<strong>at</strong>es. The task was to assign priorityamong these contam<strong>in</strong>ants based on the rel<strong>at</strong>ive health riskth<strong>at</strong> each poses to the residents of the Gre<strong>at</strong>er <strong>Houston</strong> area.Although a full quantit<strong>at</strong>ive risk assessment was not possible,we were able to screen the pollutants by compar<strong>in</strong>g estim<strong>at</strong>esof their ambient concentr<strong>at</strong>ions aga<strong>in</strong>st authorit<strong>at</strong>ive health riskvalues for cancer and reference values for chronic disease,whenever these were available. Health risk values were calcul<strong>at</strong>edfrom <strong>in</strong>hal<strong>at</strong>ion, unit risk estim<strong>at</strong>es. The reference valueswere based on <strong>in</strong>hal<strong>at</strong>ion, reference concentr<strong>at</strong>ions; while not adirect estim<strong>at</strong>e of risk, these specify levels <strong>at</strong> or below whichadverse health effects are not likely to occur. The full set of unitrisk estim<strong>at</strong>es and reference concentr<strong>at</strong>ions, as well as theirrespective sources, appears <strong>in</strong> Appendix 3. As a rule, werelied on current, EPA-sanctioned (f<strong>in</strong>al, peer-reviewed) valuesand concentr<strong>at</strong>ions, unless more str<strong>in</strong>gent levels had beenpromulg<strong>at</strong>ed by California EPA. Estim<strong>at</strong>es of ambient concentr<strong>at</strong>ionswere drawn from two, <strong>in</strong>dependent sources: the NATAmodeled averages for 1999 (available <strong>in</strong> Spr<strong>in</strong>g of 2006) (U.S.EPA, 2006d) and the monitor<strong>in</strong>g averages for 2004 drawn fromEPA's <strong>Air</strong> Quality System (U.S. EPA, 2006e) (See Appendix 2for a description of these d<strong>at</strong>a).S<strong>in</strong>ce our purpose is to establish an order<strong>in</strong>g among pollutants<strong>in</strong> terms of rel<strong>at</strong>ive risks, we cre<strong>at</strong>ed 4 ranked c<strong>at</strong>egories- unlikely, possible, probable and def<strong>in</strong>ite -- each design<strong>at</strong><strong>in</strong>ga particular level of risk. A fifth c<strong>at</strong>egory, uncerta<strong>in</strong>,was added to cover <strong>in</strong>stances when ambiguity or a lack of<strong>in</strong>form<strong>at</strong>ion kept us from determ<strong>in</strong><strong>in</strong>g an appropri<strong>at</strong>e risk level.Us<strong>in</strong>g c<strong>at</strong>egories permits us to accommod<strong>at</strong>e a range ofnumerical values <strong>at</strong> each risk level and to allow for imprecision<strong>in</strong> our estim<strong>at</strong>es. We are also able to take advantage of somewidely-used qualit<strong>at</strong>ive dist<strong>in</strong>ctions among risk levels, mak<strong>in</strong>gthe c<strong>at</strong>egories more mean<strong>in</strong>gful.The assignment of pollutants to these 5 risk c<strong>at</strong>egoriesworks <strong>in</strong> three rounds. In the first and longest round, d<strong>at</strong>a onthe ambient concentr<strong>at</strong>ion of each pollutant are collected fromNATA's modeled estim<strong>at</strong>e for each census tract and from themeasured estim<strong>at</strong>es from AQS monitors. These d<strong>at</strong>a are thenscreened rel<strong>at</strong>ive to selected threshold levels for each unit riskestim<strong>at</strong>e and reference concentr<strong>at</strong>ion correspond<strong>in</strong>g to the pollutantunder consider<strong>at</strong>ion.There were 4 threshold concentr<strong>at</strong>ions computed fromeach available unit risk estim<strong>at</strong>e; these formed the boundariesof 5 risk group<strong>in</strong>gs, each correspond<strong>in</strong>g to added lifetimecancer risk to the popul<strong>at</strong>ion - “Below 1/1,000,000” “Between1/100,000 and 1/1,000,000” “Between 1/10,000 and1/100,000” “Between 1/1,000 and 1/10,000” “1/1,000 andGre<strong>at</strong>er”. Similarly, there were 3 percentile thresholds computedfor each reference concentr<strong>at</strong>ion, also lead<strong>in</strong>g to 5group<strong>in</strong>gs - “Below 50% RfC” “Between 75% and 50% RfC”“Between 100% and 75% RfC” “Between 150% and 100%RfC” and “150% and Above”.Pollutants are then assigned to the appropri<strong>at</strong>e group<strong>in</strong>gbased on their modeled NATA concentr<strong>at</strong>ions and their measuredAQS concentr<strong>at</strong>ions, taken separ<strong>at</strong>ely. As a result, thereare four dist<strong>in</strong>ctive order<strong>in</strong>gs: a unit risk estim<strong>at</strong>e group<strong>in</strong>g forNATA concentr<strong>at</strong>ions and one for AQS concentr<strong>at</strong>ions, togetherwith a reference concentr<strong>at</strong>ion group<strong>in</strong>g for each. With<strong>in</strong>each of these group<strong>in</strong>gs, pollutants are sorted first by their rel<strong>at</strong>iveemissions masses reported <strong>in</strong> the N<strong>at</strong>ional EmissionsInventory (NEI) for 1999 (U.S. EPA, 2006c). Four percentile c<strong>at</strong>egorieswere used: “90th Percentile and Above” “89th to 75thPercentile” “74th to 50th Percentile” and “Below 50thPercentile”. With<strong>in</strong> each of these c<strong>at</strong>egories, pollutants arethen sorted by the number of census tracts or monitors yield<strong>in</strong>gconcentr<strong>at</strong>ions above the threshold risk or reference levels forth<strong>at</strong> group<strong>in</strong>g; this provides a rough <strong>in</strong>dic<strong>at</strong>ion of the rel<strong>at</strong>iveextent of exposure <strong>in</strong> the popul<strong>at</strong>ion. The mass and loc<strong>at</strong>ionfactors become important <strong>in</strong> the third round. Those pollutantswith neither a unit risk estim<strong>at</strong>e nor a reference concentr<strong>at</strong>ionare assigned to a residual group, as are those with either noconcentr<strong>at</strong>ions reported or modeled concentr<strong>at</strong>ions of zero.In the second round, we apply a decision rule to take usfrom the 4 elabor<strong>at</strong>e order<strong>in</strong>gs developed <strong>in</strong> the first round toour 5 overall risk c<strong>at</strong>egories. In effect, the rule assigns each28
Photo by Heidi Bethelgroup<strong>in</strong>g to a particular risk c<strong>at</strong>egory and, thereby, cre<strong>at</strong>es adefault assignment for each pollutant. Pollutants with concentr<strong>at</strong>ionsth<strong>at</strong> place them <strong>in</strong> the two highest group<strong>in</strong>gs -“Between 1/1,000 and 1/10,000” and “1/1,000 or Gre<strong>at</strong>er” forunit risk thresholds and “Between 150% RfC and 100% RfC”and “150% RfC and Above” for reference thresholds -- go to the“Def<strong>in</strong>ite Risk” c<strong>at</strong>egory. Those <strong>in</strong> the next highest group<strong>in</strong>g goto Probable Risk; and those <strong>in</strong> the group<strong>in</strong>g below th<strong>at</strong> one goto Possible Risk. Those <strong>in</strong> the lowest group<strong>in</strong>g - “Below1/1,000,000” and “Below 50% RfC” - are assigned to theUncerta<strong>in</strong> c<strong>at</strong>egory, along with the pollutants <strong>in</strong> the residualgroup without unit risk estim<strong>at</strong>es or reference concentr<strong>at</strong>ions.Pollutants with evidence of no emissions <strong>in</strong> the Gre<strong>at</strong>er <strong>Houston</strong>Area, modeled concentr<strong>at</strong>ions of zero, or no measured concentr<strong>at</strong>ionsreported, go to the Unlikely c<strong>at</strong>egory. Note th<strong>at</strong> bothAQS and NATA concentr<strong>at</strong>ions are comb<strong>in</strong>ed <strong>in</strong> the same c<strong>at</strong>egories<strong>at</strong> this po<strong>in</strong>t. Although preference is given to the measuredover the modeled d<strong>at</strong>a, only just over 20 pollutants with ahealth risk or reference value have both k<strong>in</strong>ds of d<strong>at</strong>a. Althoughthese pollutants may appear <strong>in</strong> multiple c<strong>at</strong>egories as a result,<strong>in</strong> every case, we assign them to the highest c<strong>at</strong>egory <strong>in</strong> whichthey appear.In the third round, adjustments are made to improve thereliability of the default assignments. Here, the emissions andloc<strong>at</strong>ion factors come <strong>in</strong>to play. If there is evidence th<strong>at</strong> emissionslevels have changed dram<strong>at</strong>ically, the pollutant can bemoved to a lower risk c<strong>at</strong>egory (1 pollutant). Pollutants whoseassignments are based on a modeled concentr<strong>at</strong>ion <strong>in</strong> only as<strong>in</strong>gle census tract can be moved to a lower risk c<strong>at</strong>egory (7pollutants). Those whose unit risk estim<strong>at</strong>es are based on oralr<strong>at</strong>her than <strong>in</strong>hal<strong>at</strong>ion evidence can be moved to a lower c<strong>at</strong>egory(3 pollutants). A total of 11 pollutants were moved <strong>in</strong>this round to produce the f<strong>in</strong>al assignments to our 5 risk c<strong>at</strong>egories.To illustr<strong>at</strong>e this process, consider the pollutant, benzene;it has both a unit risk estim<strong>at</strong>e and a reference concentr<strong>at</strong>ionand appears <strong>in</strong> both modeled and measured concentr<strong>at</strong>ionestim<strong>at</strong>es.Us<strong>in</strong>g the Cal/EPA unit risk estim<strong>at</strong>e for benzene, 2.9x10- 5per ug/m3, we calcul<strong>at</strong>e the threshold risk concentr<strong>at</strong>ions asfollows. Take a particular, lifetime, cancer risk level, say, 1 <strong>in</strong>10,000 expressed as 1/10,000, and then divide it by the unitrisk estim<strong>at</strong>e. This means th<strong>at</strong> the air concentr<strong>at</strong>ion <strong>at</strong> each ofthese threshold levels changes by a factor of 10, the same asthe change <strong>in</strong> the risk levels (1/10,000: 3.4 ug/m3; 1/100,000:3.4x10- 1 ug/m3; 1/1,000,000: 3.4x10- 2 ug/m3). The highestmodeled concentr<strong>at</strong>ion for benzene from NATA is 9.04; the concentr<strong>at</strong>ionsfor 66 census tracts exceed 3.4, our threshold forthe “Between 1/1,000 and 1/10,000” cancer risk group<strong>in</strong>g. Thehighest measured concentr<strong>at</strong>ion is 5.51. Two monitors showannual averages exceed<strong>in</strong>g 3.4 ug/m3. This places benzene <strong>in</strong>the same group<strong>in</strong>g for both measured and modeled concentr<strong>at</strong>ions.The reference value thresholds are based on percentagesof the reference concentr<strong>at</strong>ion, rang<strong>in</strong>g from 150% tobelow 50%. For benzene, the reference value is 30 ug/m3.Aga<strong>in</strong>, measured and modeled concentr<strong>at</strong>ions lead to thesame group<strong>in</strong>g, “Below 50% RfC”.In the second round, benzene is assigned to the Def<strong>in</strong>iteRisk c<strong>at</strong>egory, s<strong>in</strong>ce the top two risk group<strong>in</strong>gs have been comb<strong>in</strong>ed.Its lowest group<strong>in</strong>g on the reference concentr<strong>at</strong>ion doesnot affect this assignment. F<strong>in</strong>ally, <strong>in</strong> the third round, benzene'semissions mass above the 90th percentile and its appearanceabove threshold levels <strong>in</strong> 66 census tracts and <strong>at</strong> two monitorsre<strong>in</strong>force the default assignment.29
Appendix 2D<strong>at</strong>a Source Descriptions: NATA and AQSA n<strong>at</strong>ional-scale assessment of air toxics for 1999 wasprepared by EPA and made public <strong>at</strong> the beg<strong>in</strong>n<strong>in</strong>g of 2006.(U.S. EPA, 2006b) It <strong>in</strong>cluded 176 HAPs drawn from the 188named <strong>in</strong> Section 3 of the Clean <strong>Air</strong> Amendments of 1990, andadded diesel particul<strong>at</strong>e m<strong>at</strong>ter. The assessment <strong>in</strong>cluded an<strong>at</strong>ional <strong>in</strong>ventory of air toxics emissions from outdoorsources, and estim<strong>at</strong>es of ambient concentr<strong>at</strong>ions and popul<strong>at</strong>ionexposure.Two d<strong>at</strong>abases were used. First, the N<strong>at</strong>ional EmissionInventory 1999 reported <strong>in</strong>form<strong>at</strong>ion on each pollutant <strong>in</strong> tonsreleased per year, c<strong>at</strong>egorized their emission source, andreported by county (U.S. EPA, 2006c). Second, theAssessment System for Popul<strong>at</strong>ion Exposure N<strong>at</strong>ionwide(ASPEN) (U.S. EPA, 2006d) provided annual pollutant concentr<strong>at</strong>ionsmodeled by means of a computer simul<strong>at</strong>ion.ASPEN used estim<strong>at</strong>es of air toxics emissions and meteorologicald<strong>at</strong>a from N<strong>at</strong>ional We<strong>at</strong>her Service St<strong>at</strong>ions, as wellas took <strong>in</strong>to consider<strong>at</strong>ion other determ<strong>in</strong>ants such as r<strong>at</strong>e,loc<strong>at</strong>ion, and height from which they are released, reactivedecay, deposition and secondary form<strong>at</strong>ion. The smallest geographicunit, for which the concentr<strong>at</strong>ions were modeled, was acensus tract, typically conta<strong>in</strong><strong>in</strong>g 4000 <strong>in</strong>habitants. The tencounty area of <strong>in</strong>terest comprised a total of 895 census tracts.East <strong>Houston</strong> analysis <strong>in</strong>cluded an area of 28 census tracts.Concentr<strong>at</strong>ions of each pollutant were expressed <strong>in</strong> ug/m3and were presented by source of emission, such as po<strong>in</strong>t, area,mobile (on road and non-road), and for some pollutants asbackground. Background concentr<strong>at</strong>ions are based on monitoredd<strong>at</strong>a, estim<strong>at</strong>es from the technical liter<strong>at</strong>ure and reportedemissions dur<strong>in</strong>g 1999. They are <strong>at</strong>tributable to unidentifiedand n<strong>at</strong>ural sources, previous emissions persist<strong>in</strong>g <strong>in</strong> the environment,and to long-range transport. Additional <strong>in</strong>form<strong>at</strong>ion onbackground concentr<strong>at</strong>ions is available <strong>at</strong>:http://www.epa.gov/ttn/<strong>at</strong>w/n<strong>at</strong>a1999/background.html.Extensive <strong>in</strong>form<strong>at</strong>ion on ASPEN model can be found <strong>at</strong>:http://www.epa.gov/ttn/<strong>at</strong>w/n<strong>at</strong>a1999/aspen99.html.The <strong>Air</strong> Quality System (AQS) d<strong>at</strong>abase, as compiled bythe U.S. Environmental Protection Agency (EPA), provides airmonitor<strong>in</strong>g d<strong>at</strong>a -- ambient concentr<strong>at</strong>ions of criteria and hazardousair pollutants -- from monitor<strong>in</strong>g sites throughout theUnited St<strong>at</strong>es. These concentr<strong>at</strong>ions are reported to the EPA byvarious agencies throughout the United St<strong>at</strong>es (e.g. the TexasCommission on Environmental Quality). The d<strong>at</strong>a can beobta<strong>in</strong>ed directly from the EPA <strong>in</strong> ASCII form<strong>at</strong>, or can beaccessed onl<strong>in</strong>e. The d<strong>at</strong>a th<strong>at</strong> we obta<strong>in</strong>ed were <strong>in</strong> threeforms labeled as: DM_300 (exceedance d<strong>at</strong>a for ozone, PM 2.5and PM 10); DM_350 (raw d<strong>at</strong>a for HAPs, VOCs, speci<strong>at</strong>ed carbon,ozone, PM 2.5 and PM 10); and DM_AMP450 (annualmeans for HAPs, VOCs, speci<strong>at</strong>ed carbon, ozone, PM 2.5 andPM 10). D<strong>at</strong>asets were received for years 1970 through 2005.We selected 2004 as the year of analysis, s<strong>in</strong>ce it had the mostcomplete recent d<strong>at</strong>a. The ten county area was used as a filterfor the d<strong>at</strong>a request s<strong>in</strong>ce “COUNTY_NAME” is a variable <strong>in</strong> theAQS d<strong>at</strong>aset.There were a total of 49 HAPs th<strong>at</strong> were monitored and<strong>in</strong>cluded <strong>in</strong> our analysis. Of those 49, 25 had cancer risk valuesand 41 had non-cancer reference values. Several VOCsth<strong>at</strong> are also def<strong>in</strong>ed as HAPs were duplic<strong>at</strong>ed <strong>in</strong> bothd<strong>at</strong>asets. This was confirmed by analysis of both the raw andsummary d<strong>at</strong>a.For 2004, there were 19 “species” of carbon monitoredand <strong>in</strong>cluded <strong>in</strong> the AQS d<strong>at</strong>aset for the 10 county area. Onlytwo of these were <strong>in</strong>cluded <strong>in</strong> the f<strong>in</strong>al analysis as surrog<strong>at</strong>esfor diesel particul<strong>at</strong>e m<strong>at</strong>ter, based on the recommend<strong>at</strong>ion ofEPA officials. Our f<strong>in</strong>al analysis of raw and summary d<strong>at</strong>a forHAPs and speci<strong>at</strong>ed carbons <strong>in</strong>cluded 51 pollutants. Ozone,PM 2.5 and PM 10 were reviewed for daily exceedances for2000-2005.Pollutants are represented as “parameters” <strong>in</strong> the AQSd<strong>at</strong>aset and are assigned a five digit code. Site IDs <strong>in</strong> the d<strong>at</strong>abaserepresent geographic loc<strong>at</strong>ions of monitor<strong>in</strong>g sites. Aparameter occurrence code (POC) is used to dist<strong>in</strong>guishbetween multiple monitors <strong>at</strong> the same site th<strong>at</strong> are measur<strong>in</strong>gthe same parameter. So, <strong>in</strong> effect, a POC represents a monitor.Monitor<strong>in</strong>g dur<strong>at</strong>ion is also <strong>in</strong>cluded <strong>in</strong> the d<strong>at</strong>a set per POC <strong>at</strong><strong>in</strong>dividual site IDs. For example, a dur<strong>at</strong>ion code of 7 represents24 hours, whereas a dur<strong>at</strong>ion code of 1 represents 1 hour.The particular method for collect<strong>in</strong>g and analyz<strong>in</strong>g samples for30
Appendix 2the time period is represented by a three digit “method” code.For example, a method code of 175 represents a passiv<strong>at</strong>edcanister. Collection frequency is also <strong>in</strong>cluded and was usedto calcul<strong>at</strong>e the percentage of scheduled read<strong>in</strong>gs th<strong>at</strong> wereactually recorded. “Unit_Code” represents the unit of measurement.Although unit risk estim<strong>at</strong>es and reference concentr<strong>at</strong>ionsare reported <strong>in</strong> µg per m 3 ; most HAPs are measured <strong>in</strong>parts-per-billion carbon (ppbC). In order to convert these valuesto µg per m 3 , the molecular weight and number of carbonsof these pollutants were used <strong>in</strong> the follow<strong>in</strong>g equ<strong>at</strong>ion:This formula was obta<strong>in</strong>ed from EPA(http://www.epa.gov/oar/oaqps/pams/analysis/receptor/rectxtsac.html)and confirmed through our calcul<strong>at</strong>ions. F<strong>in</strong>ally, <strong>in</strong>the raw d<strong>at</strong>aset, sample d<strong>at</strong>es and recorded values for thosed<strong>at</strong>es (depend<strong>in</strong>g on the collection frequency) are <strong>in</strong>cluded.The d<strong>at</strong>aset, entitled DM_AMP450, conta<strong>in</strong>s all of the variablesmentioned above; however, <strong>in</strong>stead of multiple read<strong>in</strong>gsper day for all days of collection, an arithmetic mean is reported.In order to obta<strong>in</strong> this mean, the EPA simply added all monitoredvalues and divided by the total number present. Noread<strong>in</strong>gs are excluded. For verific<strong>at</strong>ion, arithmetic means werecalcul<strong>at</strong>ed us<strong>in</strong>g the “raw” d<strong>at</strong>aset and confirmed aga<strong>in</strong>st the“summary” d<strong>at</strong>aset.31
Appendix 3Inventory of Health Values and Reference Concentr<strong>at</strong>ionsChronic <strong>in</strong>hal<strong>at</strong>ion dose-response <strong>in</strong>form<strong>at</strong>ion for this forthis assessment was obta<strong>in</strong>ed from various sources. It was aTask Force decision to give first priority to the most protectiveof the f<strong>in</strong>al, peer-reviewed health values for cancer and noncancerendpo<strong>in</strong>ts between those values reported by the USEPA's Integr<strong>at</strong>ed Risk Inform<strong>at</strong>ion System (IRIS) (U.S. EPA,2006i) and California EPA's Office of Environmental HealthHazard Assessment (OEHHA) (California OEHHA, 2006).California OEHHA values were found <strong>in</strong> two tables: a table entitledAll Chronic Reference Exposure Levels (RELs) adopted byOEHHA as of February 2005 (for health risks other than cancer)(California OEHHA, 2005); and a table entitled Hot SpotsUnit Risk and Cancer Potency Values found <strong>in</strong> Appendix A ofthe <strong>Air</strong> Toxics Hot Spots Program Risk Assessment Guidel<strong>in</strong>es(Part II) Technical Support Document for Describ<strong>in</strong>g AvailableCancer Potency Factors (California EPA & OEHHA, 2002).Where values from IRIS or OEHHA do not exist, a consolid<strong>at</strong>edlist of health risk values from EPA's Office of <strong>Air</strong> QualityPlann<strong>in</strong>g and Standards (OAQPS) entitled Prioritized ChronicDose Response Values for Screen<strong>in</strong>g Risk Assessments (U.S.EPA, 2005) which was upd<strong>at</strong>ed <strong>in</strong> February 2005 was used.This table consolid<strong>at</strong>ed health risk values from externally peerreviewed EPA IRIS draft assessments, f<strong>in</strong>al peer-reviewed EPAIRIS assessments, the Agency for Toxic Substances andDisease Registry (ATSDR), California OEHHA and US EPA'sHealth Effects Assessment Tables (HEAST) values, prioritized<strong>in</strong> th<strong>at</strong> order. The Task Force's prioritiz<strong>at</strong>ion of health valuesfollowed th<strong>at</strong> of the OAQPS table with the exception th<strong>at</strong> firstpriority was given to the most protective of the f<strong>in</strong>al, peerreviewedhealth values for cancer and non-cancer endpo<strong>in</strong>tsbetween values reported by IRIS and California OEHHA.Where values do not exist from any of the above sources,we consulted and crosschecked a table entitled Health EffectsInform<strong>at</strong>ion Used <strong>in</strong> Cancer and Noncancer RiskCharacteriz<strong>at</strong>ion for the 1999 N<strong>at</strong>ional-Scale Assessment (U.S.EPA, 2006h). This table was used <strong>in</strong> EPA's 1999 N<strong>at</strong>ional-Scale <strong>Air</strong> Toxics Assessment (NATA) (U.S. EPA, 2006b) andwas upd<strong>at</strong>ed on November 7, 2005.US Environmental Protection Agency (EPA)The US EPA has developed dose-response assessmentsfor chronic exposure to many of the pollutants <strong>in</strong> this report.EPA reports reference concentr<strong>at</strong>ions, or RfCs (to protectaga<strong>in</strong>st effects other than cancer), and/or a unit risk estim<strong>at</strong>e,or URE (to estim<strong>at</strong>e the probability of contract<strong>in</strong>g cancer).Reference concentr<strong>at</strong>ions are estim<strong>at</strong>es of an <strong>in</strong>hal<strong>at</strong>ion exposureto the human popul<strong>at</strong>ion (<strong>in</strong>clud<strong>in</strong>g sensitive subgroups)th<strong>at</strong> are likely to be without appreciable risks of deleteriouseffects dur<strong>in</strong>g a lifetime. The URE is the upper-bound excesscancer risk estim<strong>at</strong>ed to result from a lifetime of cont<strong>in</strong>uousexposure to an agent <strong>at</strong> a concentr<strong>at</strong>ion of 1 µg/m3 <strong>in</strong> air.California Office of Environmental Health HazardAssessment (OEHHA)Dose-response assessments have been developed formany substances for both cancer and non-cancer endpo<strong>in</strong>tsby the California OEHHA. The process for develop<strong>in</strong>g thesevalues is similar to th<strong>at</strong> use by the EPA to develop IRIS values.Non-cancer <strong>in</strong>hal<strong>at</strong>ion health risk values are expressed aschronic <strong>in</strong>hal<strong>at</strong>ion reference exposure levels (RELs). OEHHA'squantit<strong>at</strong>ive dose-response <strong>in</strong>form<strong>at</strong>ion on carc<strong>in</strong>ogenicity by<strong>in</strong>hal<strong>at</strong>ion exposure is expressed <strong>in</strong> terms of the URE, def<strong>in</strong>edsimilarly to EPA's URE.Agency for Toxic Substances and Disease Registry(ATSDR)M<strong>in</strong>imum Risk Levels (MRLs) are developed and publishedby ATSDR, which is part of the US Department of Healthand Human Services. The MRL is def<strong>in</strong>ed as an estim<strong>at</strong>e ofdaily human exposure to a substance th<strong>at</strong> is likely to be without32
Appendix 3an appreciable risk of adverse effects (other than cancer) overa specified dur<strong>at</strong>ion of exposure. MRLs are considered to beconcentr<strong>at</strong>ions below which contam<strong>in</strong>ants are unlikely to posea health thre<strong>at</strong>. Concentr<strong>at</strong>ions above an MRL do not necessarilyrepresent a thre<strong>at</strong>. The concept, def<strong>in</strong>ition and deriv<strong>at</strong>ionof <strong>in</strong>hal<strong>at</strong>ion MRLs is philosophically consistent (though notidentical) with the basis for EPA's RfCs. MRLs are publishedand upd<strong>at</strong>ed on the world wide web (ATSDR).US EPA Health Effects Assessment Tables (HEAST)HEAST is a list<strong>in</strong>g of provisional UREs and RfCs developedby EPA. HEAST assessments have undergone review by<strong>in</strong>dividual EPA program offices and are supported by agencyreferences, but are not considered to be high-quality, EPA-wideconsensus <strong>in</strong>form<strong>at</strong>ion. HEAST was last upd<strong>at</strong>ed <strong>in</strong> 1997 andexists only <strong>in</strong> hard copy (PB97-921199). HEAST values are onlyused when no values from other sources exist.Conversions of Oral Unit Risk Estim<strong>at</strong>es <strong>in</strong>toInhal<strong>at</strong>ion Estim<strong>at</strong>esFor eleven carc<strong>in</strong>ogenic substances (benzotrichloride,captan, dichlorvos, 3,3'-dimethoxybenzid<strong>in</strong>e, 3,3'-dimethylbenzid<strong>in</strong>e, ethyl acryl<strong>at</strong>e, isophorone, pentachloronitrobenzene,propylene dichloride, qu<strong>in</strong>ol<strong>in</strong>e, triflural<strong>in</strong>) th<strong>at</strong> lack<strong>in</strong>hal<strong>at</strong>ion assessments from these sources, <strong>in</strong>hal<strong>at</strong>ion UREsare derived from oral carc<strong>in</strong>ogenic potency estim<strong>at</strong>es and arereported <strong>in</strong> the OAQPS or NATA tables.Photo by Heidi Bethel33
Table A3.1. Health Values and Reference Concentr<strong>at</strong>ionsAppendix 334
Table A3.1. Health Values and Reference Concentr<strong>at</strong>ionsAppendix 335
Table A3.1. Health Values and Reference Concentr<strong>at</strong>ionsAppendix 336
Table A3.1. Health Values and Reference Concentr<strong>at</strong>ionsAppendix 337
Table A3.1. Health Values and Reference Concentr<strong>at</strong>ionsAppendix 338
Table A3.1. Health Values and Reference Concentr<strong>at</strong>ionsAppendix 339
40Photos by Heidi Bethel
Appendix 4Metals, Diesel PM Conversions and Polycyclic Organic M<strong>at</strong>terAll Metals AnalysesThe U.S. EPA's 1999 N<strong>at</strong>ional <strong>Air</strong> Toxics Assessment(NATA) (U.S. EPA, 2006b) model<strong>in</strong>g and analyses used f<strong>in</strong>e andcourse PM d<strong>at</strong>a <strong>in</strong> model<strong>in</strong>g metal concentr<strong>at</strong>ions. The Mayor'sTask Force analyses used only f<strong>in</strong>e PM metal concentr<strong>at</strong>ionsfrom PM 2.5 speci<strong>at</strong>ed metals d<strong>at</strong>a files from the U.S. EPA's <strong>Air</strong>Quality System d<strong>at</strong>abase (U.S. EPA, 2006e) to compare to referenceconcentr<strong>at</strong>ions (RfCs) and unit risk estim<strong>at</strong>es (UREs).The choice to elim<strong>in</strong><strong>at</strong>e the PM 10 speci<strong>at</strong>ed metals d<strong>at</strong>a wasbased on the assumption th<strong>at</strong> PM 2.5 particles would penetr<strong>at</strong>efurther <strong>in</strong>to the lungs and therefore represent gre<strong>at</strong>er healthconsequences than PM 10 speci<strong>at</strong>ed metals. After complet<strong>in</strong>gthe analyses, it was found th<strong>at</strong> metal concentr<strong>at</strong>ions from ambientPM 2.5 speci<strong>at</strong>ed metals files for 2004 were consistentlylower than the modeled NATA concentr<strong>at</strong>ions from 1999. The<strong>in</strong>consistency between the modeled and ambient d<strong>at</strong>a analysesis further complic<strong>at</strong>ed by the fact th<strong>at</strong> the time frame forthese analyses is separ<strong>at</strong>ed by five years. The NATA Model-to-Monitor Comparison (U.S. EPA, 2006g) reported th<strong>at</strong> measuredambient metal concentr<strong>at</strong>ions were typically higher than modeledconcentr<strong>at</strong>ions for chromium, lead, manganese and nickel.Recalcul<strong>at</strong><strong>in</strong>g our ambient metal concentr<strong>at</strong>ions to <strong>in</strong>cludeboth f<strong>in</strong>e and course speci<strong>at</strong>ed metals may lead to higher riskc<strong>at</strong>egories reported for metals from ambient d<strong>at</strong>asets.Chromium CompoundsChromium compounds, which are a group of pollutants, are listed<strong>in</strong> the Clean <strong>Air</strong> Act (U.S. EPA, 1990) as one of the 188Hazardous <strong>Air</strong> Pollutants (HAPs). Chromium sources of emissions<strong>in</strong>clude the combustion of coal and oil, electropl<strong>at</strong><strong>in</strong>g,vehicles, iron and steel plants, and metal smelters. Chromiumoccurs <strong>in</strong> the environment primarily <strong>in</strong> two valence st<strong>at</strong>es, trivalentchromium (Cr III), which occurs n<strong>at</strong>urally and is an essentialnutrient, and hexavalent chromium (Cr VI), which along withthe less common metallic chromium (Cr 0), is most commonlyproduced by <strong>in</strong>dustrial processes. <strong>Air</strong> emissions of chromiumare predom<strong>in</strong>antly of trivalent chromium, and <strong>in</strong> the form ofsmall particles or aerosols. Chromium forms a large number ofcompounds, <strong>in</strong> both the chromium (III) and chromium (VI) forms(ATSDR, 1998). The Mayor's Task Force assessed chromium(VI) compounds as a group of pollutants us<strong>in</strong>g modeled concentr<strong>at</strong>ionsfrom the U.S. Environmental Protection Agency's1999 N<strong>at</strong>ional <strong>Air</strong> Toxics Assessment (U.S. EPA, 2006d).Modeled chromium VI compound concentr<strong>at</strong>ions wereassessed for carc<strong>in</strong>ogenic and non-carc<strong>in</strong>ogenic endpo<strong>in</strong>ts.Currently, no UREs or RfCs exist from the sources consulted forchromium III compounds, and chromium III is much less toxicthan chromium VI.The emissions of chromium compounds reflected <strong>in</strong> the1999 NATA assessment are based on st<strong>at</strong>e and local agencyreport<strong>in</strong>g of chromium as "chromium and compounds," <strong>in</strong>dividualchromium compounds and chromium ions. In the EPA's1996 N<strong>at</strong>ional <strong>Air</strong> Toxics Assessment (U.S. EPA, 1999),because of the <strong>in</strong>consistent report<strong>in</strong>g, all of the chromium waslumped together for dispersion model<strong>in</strong>g as "Chromium VI."EPA then based quantit<strong>at</strong>ive risk estim<strong>at</strong>es on an assumptionth<strong>at</strong> 34 percent of the chromium is hexavalent chromium basedon <strong>in</strong>form<strong>at</strong>ion from past <strong>in</strong>ventory<strong>in</strong>g efforts. For 1999, EPAused a more ref<strong>in</strong>ed approach to estim<strong>at</strong>e emissions of hexavalentchromium. Individual compounds of chromium reported <strong>in</strong>the <strong>in</strong>ventory were identified as either hexavalent or trivalentbased upon their chemical formulae. Any compounds reportedas either "chromium" or "chromium and compounds" were thenspeci<strong>at</strong>ed us<strong>in</strong>g source c<strong>at</strong>egory specific speci<strong>at</strong>ion d<strong>at</strong>a (U.S.EPA, 2004). For source c<strong>at</strong>egories where speci<strong>at</strong>ion d<strong>at</strong>a werenot available, EPA assumed th<strong>at</strong> 34 percent of the chromium ishexavalent.Elemental Carbon to Diesel PM Conversion FactorIn order to assess diesel particul<strong>at</strong>e m<strong>at</strong>ter concentr<strong>at</strong>ionsthe Task Force used ambient elemental carbon (EC) concentr<strong>at</strong>ionsfor 2004 (U.S. EPA, 2006f) as a surrog<strong>at</strong>e for diesel particul<strong>at</strong>em<strong>at</strong>ter (PM) concentr<strong>at</strong>ions. This technique used the rel<strong>at</strong>ivecontribution of diesel combustion to all sources of ambientEC to determ<strong>in</strong>e a scal<strong>in</strong>g factor for diesel PM concentr<strong>at</strong>ions.Sources of EC <strong>in</strong> the <strong>Houston</strong> area <strong>in</strong>clude gas anddiesel vehicles, road dust, veget<strong>at</strong>ive detritus, wood combustion,me<strong>at</strong> cook<strong>in</strong>g and fuel oil combustion. A study by Fraser,41
et al. (Fraser et al., 2003) used organic molecular markers specificto the above sources to apportion f<strong>in</strong>e particul<strong>at</strong>e m<strong>at</strong>ter <strong>at</strong>four sites <strong>in</strong> <strong>Houston</strong>. The samples used <strong>in</strong> this study were collectedbetween March 1997 and February 1998. Two sites fromthis study, Cl<strong>in</strong>ton (adjacent to the <strong>Houston</strong> Ship Channel <strong>in</strong> thevic<strong>in</strong>ity of a high concentr<strong>at</strong>ion of <strong>in</strong>dustrial emission sources)and B<strong>in</strong>gle (loc<strong>at</strong>ed <strong>in</strong> a suburban neighborhood <strong>in</strong> north-west<strong>Houston</strong>) were used to develop an appropri<strong>at</strong>e scal<strong>in</strong>g factor torel<strong>at</strong>e ambient EC levels to diesel PM concentr<strong>at</strong>ions. Raw d<strong>at</strong>afrom this study were obta<strong>in</strong>ed from Fraser, and the r<strong>at</strong>io of elementalcarbon <strong>at</strong>tributed to diesel exhaust to total apportionedelemental carbon <strong>at</strong> each site was determ<strong>in</strong>ed to be 0.775 <strong>at</strong>Cl<strong>in</strong>ton and 0.887 <strong>at</strong> B<strong>in</strong>gle.In a second study by Fraser, et al. (Fraser et al., 2002)samples of f<strong>in</strong>e particle emissions from four heavy-duty dieselvehicles were analyzed for chemical and molecular composition.Particle emissions were sampled for vehicles under loadand idl<strong>in</strong>g. R<strong>at</strong>ios of elemental carbon to total carbon (EC/TC)for diesel emissions from two tractor-trailer trucks from the fleetof the HEB Grocery Company of San Antonio, Texas runn<strong>in</strong>g <strong>at</strong>an Heavy-Duty Chassis Cycle (HDCC), designed to simul<strong>at</strong>eurban and highway oper<strong>at</strong>ion, were measured <strong>in</strong> a range of0.66 - 0.72. The mean and median of this range is 0.69.In order to calcul<strong>at</strong>e conversion factors for ambient measuredEC to diesel (PM) concentr<strong>at</strong>ions, the d<strong>at</strong>a mentioned fromthe two studies by Fraser et al. were used. Factors for conversionwere calcul<strong>at</strong>ed for both the Cl<strong>in</strong>ton and B<strong>in</strong>gle sites bydivid<strong>in</strong>g the r<strong>at</strong>io of f<strong>in</strong>e elemental carbon mass <strong>at</strong>tributed todiesel PM <strong>in</strong> the <strong>Houston</strong> <strong>at</strong>mosphere <strong>at</strong> each site (0.775 <strong>at</strong>Cl<strong>in</strong>ton and 0.887 <strong>at</strong> B<strong>in</strong>gle) by the EC/TC r<strong>at</strong>io of 0.69 for dieseleng<strong>in</strong>e emissions from the two represent<strong>at</strong>ive tractor-trailertrucks. This calcul<strong>at</strong>ion assumes th<strong>at</strong> these two diesel trucksprovide an accur<strong>at</strong>e represent<strong>at</strong>ion of the diesel vehicle fleet asa whole <strong>in</strong> <strong>Houston</strong>. This assumption was required becausesource apportionment of elemental carbon to diesel sourcesother than diesel truck eng<strong>in</strong>es <strong>at</strong> our monitor<strong>in</strong>g sites <strong>in</strong> the<strong>Houston</strong> area was not directly available.Our conversion factors were calcul<strong>at</strong>ed as follows:Cl<strong>in</strong>ton:B<strong>in</strong>gle:(0.775)/(0.69) = 1.12 (0.887)/(0.69) = 1.29Estim<strong>at</strong>es of ambient diesel PM concentr<strong>at</strong>ions can then bemade by multiply<strong>in</strong>g the elemental carbon concentr<strong>at</strong>ionsmeasured <strong>at</strong> a local air quality monitor<strong>in</strong>g loc<strong>at</strong>ion by one of theconversion factors above. An explan<strong>at</strong>ion of which of thesefactors was used <strong>in</strong> the Mayor's Task Force evalu<strong>at</strong>ion can befound below.Several other conversion factors used by the California <strong>Air</strong>Resources Board (ARB) (California ARB, 1998; California ARB& OEHHA, 1998) <strong>in</strong> their identific<strong>at</strong>ion of particul<strong>at</strong>e emissionsfrom diesel fueled eng<strong>in</strong>es as a Toxic <strong>Air</strong> Contam<strong>in</strong>ant and bythe U.S. EPA (U.S. EPA, 2002) were also found. The ARB useda study by Gray (Gray, 1986) which showed th<strong>at</strong> the r<strong>at</strong>io of f<strong>in</strong>eelemental carbon mass <strong>at</strong>tributed to diesel eng<strong>in</strong>e emissions tototal elemental carbon <strong>in</strong> the Los Angeles <strong>at</strong>mosphere wasapproxim<strong>at</strong>ely 0.67. The EC/TC r<strong>at</strong>io for all diesel exhaust particlesemitted was 0.64. Therefore, diesel particul<strong>at</strong>e concentr<strong>at</strong>ionsare estim<strong>at</strong>ed by multiply<strong>in</strong>g the elemental carbon concentr<strong>at</strong>ionsby 1.04 (0.67/0.64 = 1.04).The U.S. EPA also calcul<strong>at</strong>ed elemental carbon to dieselPM conversion factors for various areas <strong>in</strong> the United St<strong>at</strong>esus<strong>in</strong>g seven different studies (U.S. EPA, 2002), as well as rawd<strong>at</strong>a obta<strong>in</strong>ed from various researchers <strong>in</strong>volved <strong>in</strong> the studies.For the Western United St<strong>at</strong>es, which encompasses the st<strong>at</strong>e ofTexas, an average EC to diesel PM conversion factor of 1.6 wascalcul<strong>at</strong>ed for elemental carbon measurements us<strong>in</strong>g the thermaloptical transmittance (TOT) method and an average valueof 0.8 was calcul<strong>at</strong>ed for elemental carbon measurementsus<strong>in</strong>g the thermal optical reflectance (TOR) measurementmethod dur<strong>in</strong>g w<strong>in</strong>ter months <strong>in</strong> the Eastern and WesternUnited St<strong>at</strong>es.Table A4.1. Elemental Carbon to DieselParticul<strong>at</strong>e M<strong>at</strong>ter ConversionsStudyConversion FactorFraser - Cl<strong>in</strong>ton 1.12Fraser - B<strong>in</strong>gle 1.29Cal. <strong>Air</strong> Resources Board 1.04EPA - TOT Method 1.60EPA - TOR Method 0.80The conversion factor chosen to be used <strong>in</strong> this analysiswas 1.12 calcul<strong>at</strong>ed from the local <strong>Houston</strong> d<strong>at</strong>a obta<strong>in</strong>ed byFraser et al. (Fraser et al., 2002; 2003). This value was with<strong>in</strong>the range of the other values th<strong>at</strong> were calcul<strong>at</strong>ed from varioussources (1.04 - 1.60) and was chosen because it was calcul<strong>at</strong>edus<strong>in</strong>g d<strong>at</strong>a represent<strong>in</strong>g the <strong>Houston</strong> area <strong>at</strong> a monitor<strong>in</strong>gsite loc<strong>at</strong>ed <strong>in</strong> East <strong>Houston</strong>. The East <strong>Houston</strong> area has alsobeen identified by the Task Force as an area of specific <strong>in</strong>terest<strong>in</strong> evalu<strong>at</strong><strong>in</strong>g the health impacts from air pollution sources.The ambient monitor<strong>in</strong>g d<strong>at</strong>a obta<strong>in</strong>ed from EPA had variousmeasurements for elemental carbon mak<strong>in</strong>g it necessary todeterm<strong>in</strong>e which monitors were appropri<strong>at</strong>e for our analyses.42
Under advice from staff <strong>at</strong> the U.S. Environmental ProtectionAgency, parameter code 88307 - Elemental Carbon Stn PM 2.5and parameter code 88321 - EC Improve PM 2.5 LC (U.S. EPA,2006f) were used for analyses. These two d<strong>at</strong>a types representdifferent monitor<strong>in</strong>g procedures and different monitor<strong>in</strong>g loc<strong>at</strong>ions,but can both act as a surrog<strong>at</strong>e for diesel PM conversions.Parameter code 88307 - Elemental Carbon Stn PM 2.5monitor<strong>in</strong>g sites are <strong>in</strong> urban areas and use the Thermal OpticalTransmittance (TOT) method. Parameter code 88321 - ECImprove PM 2.5 LC monitor<strong>in</strong>g sites are <strong>in</strong> rural areas and usethe Thermal Optical Reflectance (TOR) method. It was decidedto use both types of measurements <strong>in</strong> our analyses.Concentr<strong>at</strong>ions of elemental carbon from the follow<strong>in</strong>g <strong>Houston</strong>monitor<strong>in</strong>g sites were used <strong>in</strong> our analyses:Site NameParameter CodeGalveston <strong>Air</strong>port 88307<strong>Houston</strong> Ald<strong>in</strong>e 88307Channelview 88307<strong>Houston</strong> Bayland Park 88307<strong>Houston</strong> East 88307<strong>Houston</strong> Deer Park 2 88307<strong>Houston</strong> Deer Park 2 88321Conroe (Reloc<strong>at</strong>ed) 88307Cancer evalu<strong>at</strong>ions of diesel emissions vary between theU.S. Environmental Protection Agency (U.S. EPA) and theCalifornia Office of Environmental Health Hazard Assessment(OEHHA). The U.S. EPA has determ<strong>in</strong>ed th<strong>at</strong> diesel exhaust islikely to be carc<strong>in</strong>ogenic to humans but has judged th<strong>at</strong> toxicologicald<strong>at</strong>a are not yet sufficient to develop a unit risk estim<strong>at</strong>efor cancer evalu<strong>at</strong>ions. The California (OEHHA) Diesel ExhaustToxic <strong>Air</strong> Contam<strong>in</strong>ant (TAC) document (California ARB &OEHHA, 1998) st<strong>at</strong>ed th<strong>at</strong> the results of epidemiological analysesare consistent with a positive associ<strong>at</strong>ion between occup<strong>at</strong>ionalexposure to diesel exhaust and an <strong>in</strong>creased risk ofdevelop<strong>in</strong>g lung cancer and has developed a cancer unit riskestim<strong>at</strong>e (URE) for diesel exhaust. The Mayor's Task Forceanalysis has used the URE developed by OEHHA for the cancerassessment for diesel exhaust. Diesel emissions havebeen assessed for effects other than cancer by the U.S. EPA'sIntegr<strong>at</strong>ed Risk Inform<strong>at</strong>ion System (IRIS) program and thisReference Concentr<strong>at</strong>ion (RfC) value has also been adopted bythe OEHHA.It should be noted th<strong>at</strong> <strong>in</strong> the evalu<strong>at</strong>ion done by theMayor's Task Force, the cancer unit risk estim<strong>at</strong>e from theCalifornia OEHHA was for diesel exhaust, which <strong>in</strong>cludes bothparticul<strong>at</strong>e and vapor phases. This number was applied to thediesel particul<strong>at</strong>e m<strong>at</strong>ter concentr<strong>at</strong>ions estim<strong>at</strong>ed by the NATAand the Task Force. Diesel particul<strong>at</strong>e m<strong>at</strong>ter does not <strong>in</strong>cludethe vapor phase chemicals.Polycyclic organic m<strong>at</strong>ter (POM)The EPA's 1999 N<strong>at</strong>ional <strong>Air</strong> Toxics Assessment dividedPOM emissions <strong>in</strong>to eight c<strong>at</strong>egories. The first two c<strong>at</strong>egorieswere assigned a URE equal to 5% of th<strong>at</strong> for purebenzo[a]pyrene. C<strong>at</strong>egories 3-7 were composed of emissionsth<strong>at</strong> were reported as <strong>in</strong>dividual pollutants. These pollutantswere placed <strong>in</strong> the c<strong>at</strong>egory with an appropri<strong>at</strong>e URE.C<strong>at</strong>egory 8, composed of unspeci<strong>at</strong>ed carc<strong>in</strong>ogenic polynucleararom<strong>at</strong>ic hydrocarbons (a subset of POM called 7-PAH),was assigned a URE equal to 18% of th<strong>at</strong> for purebenzo[a]pyrene (U.S. EPA, 2001). The POM placement <strong>in</strong>to thepossible risk c<strong>at</strong>egory (as determ<strong>in</strong>ed by the Mayor's TaskForce) was based on the placement of POM groups 1-3 <strong>in</strong>to thisrisk c<strong>at</strong>egory and is based on their NATA modeled concentr<strong>at</strong>ions.POM group 2 ranked as the highest risk of the threegroups <strong>in</strong> the possible risk c<strong>at</strong>egory based on its modeled concentr<strong>at</strong>ion<strong>in</strong> the gre<strong>at</strong>est number of census tracts and its probabilityof caus<strong>in</strong>g cancer. More <strong>in</strong>form<strong>at</strong>ion about the rank<strong>in</strong>g ofpollutants <strong>in</strong>to risk c<strong>at</strong>egories can be found <strong>in</strong> Appendix 1 ofthis document.Photo by Heidi Bethel43
Appendix 5Appendix 5: Table of Uncerta<strong>in</strong> RisksTable A5.1. Uncerta<strong>in</strong> Risk Pollutants44
Appendix 5Table A5.1. Uncerta<strong>in</strong> Risk Pollutants45
Appendix 5Table A5.1. Uncerta<strong>in</strong> Risk Pollutants46
Appendix 6Brief Descriptions of Health Effects for Def<strong>in</strong>ite RisksSome specific health effects of the air toxics labeled as“Def<strong>in</strong>ite Risks” have been outl<strong>in</strong>ed <strong>in</strong> several sources <strong>in</strong>clud<strong>in</strong>gthe Agency for Toxic Substances and Disease Registry(ATSDR, 2006) and Scorecard.org (<strong>Green</strong> Media Toolshed)have been <strong>in</strong>cluded to elucid<strong>at</strong>e the potential problems associ<strong>at</strong>edwith these particular hazardous air pollutants. As seen<strong>in</strong> Table 1, the 12 “Def<strong>in</strong>ite Risk” pollutants <strong>in</strong>clude 9 HAPs,diesel particul<strong>at</strong>e m<strong>at</strong>ter, f<strong>in</strong>e particul<strong>at</strong>e m<strong>at</strong>ter and ozone. Abrief description of the health effects of each of these is presentedhere.1,3-Butadiene is colorless gas with a pungent odor. It isused <strong>in</strong> large volumes for the manufacture of synthetic rubberand other polymers (CEN, 7/11/2005). Human exposure occursalmost entirely through <strong>in</strong>hal<strong>at</strong>ion of contam<strong>in</strong><strong>at</strong>ed air. It exists<strong>in</strong> measurable quantities <strong>in</strong> almost all urban or suburban sett<strong>in</strong>gs(ATSDR, 1993). The primary sources of butadiene <strong>in</strong>ambient air are vehicle emissions, combustion products,<strong>in</strong>clud<strong>in</strong>g tobacco smoke, and emissions from <strong>in</strong>dustrial facilitieswhere it is made or used. It is a potent multi-organ carc<strong>in</strong>ogen<strong>in</strong> mice and to a lesser extent <strong>in</strong> r<strong>at</strong>s (NTP, 1993; Owen etal., 1987). Occup<strong>at</strong>ional exposures to butadiene have beenassoci<strong>at</strong>ed <strong>in</strong> several studies with cancers of the blood form<strong>in</strong>gorgans, particularly leukemia <strong>in</strong> styrene-butadiene rubber workers(Delzell et al., 1996). In mice, low level exposures havebeen associ<strong>at</strong>ed with ovarian <strong>at</strong>rophy. Developmental disordershave been observed <strong>in</strong> mice <strong>at</strong> higher concentr<strong>at</strong>ions(Hackett et al., 1987). Butadiene is metabolized <strong>in</strong> the body to<strong>in</strong>termedi<strong>at</strong>e products th<strong>at</strong> are reactive and can b<strong>in</strong>d to DNA,result<strong>in</strong>g <strong>in</strong> mut<strong>at</strong>ions (permanent genetic changes) (Jacksonet al., 2000). Butadiene and its metabolites can <strong>in</strong>duce mut<strong>at</strong>ions<strong>in</strong> mice (Meng et al., 1999). In some studies <strong>in</strong>creased frequenciesof mut<strong>at</strong>ions were observed <strong>in</strong> exposed workers(Ammenheuser et al., 2001; Ward et al., 2001). Butadiene is listedas a carc<strong>in</strong>ogen or a probable carc<strong>in</strong>ogen by several organiz<strong>at</strong>ions<strong>in</strong>clud<strong>in</strong>g the US N<strong>at</strong>ional Toxicology Program (NTP,1993, 2002), the Intern<strong>at</strong>ional Agency for Research on Cancer(IARC Work<strong>in</strong>g Group, 1999), and the st<strong>at</strong>e of California(OEHHA, 2000, 2006).Although acrole<strong>in</strong> is often <strong>in</strong> liquid form, it vaporizes <strong>at</strong> typicalambient temper<strong>at</strong>ures, and therefore can be present <strong>in</strong> air.Acrole<strong>in</strong> may be the result of accidental release from <strong>in</strong>dustrialsources or it may be formed by the reactions of pollutants found<strong>in</strong> outdoor air. It is also produced from the burn<strong>in</strong>g of gasol<strong>in</strong>e.Health effects are generally seen <strong>in</strong> the respir<strong>at</strong>ory system.There is currently no def<strong>in</strong>itive <strong>in</strong>form<strong>at</strong>ion on the carc<strong>in</strong>ogenicityof acrole<strong>in</strong>.Accord<strong>in</strong>g to Scorecard.org, acrylic acid is a suspectedimmunotoxicant (Hazard Action Mitig<strong>at</strong>ion Plann<strong>in</strong>g), respir<strong>at</strong>orytoxicant (EPA) and sk<strong>in</strong> toxicant (EPA). Furthermore, it isranked as one of the most hazardous pollutants to ecosystemsand human health. Inhal<strong>at</strong>ion is a common route of humanexposure to acrylic acid. No <strong>in</strong>form<strong>at</strong>ion is available on the carc<strong>in</strong>ogeniceffects of acrylic acid <strong>in</strong> humans, and animal studieshave shown mixed results.Like acrole<strong>in</strong>, acrylonitrile evapor<strong>at</strong>es quickly, and it ismost likely to be found <strong>in</strong> the air around chemical plants whereit is made. Although the evidence is not unequivocal, workersexposed to acrylonitrile <strong>at</strong> low levels for extended periods havea higher-than-average chance of develop<strong>in</strong>g lung cancer. Inanimals, exposure to acrylonitrile <strong>in</strong> the air or <strong>in</strong> dr<strong>in</strong>k<strong>in</strong>g w<strong>at</strong>erhas been found to <strong>in</strong>crease the number of tumors occurr<strong>in</strong>g <strong>in</strong>the bra<strong>in</strong>, salivary glands, and <strong>in</strong>test<strong>in</strong>es. Although birthdefects have been seen <strong>in</strong> animal studies, there is currently noevidence this is an outcome expected <strong>in</strong> humans.Benzene comes from both mobile and <strong>in</strong>dustrial sources.It is made mostly from petroleum. It has been characterized ashav<strong>in</strong>g a sweet odor. Exposure to benzene generally occursthrough the air, although it can be found <strong>in</strong> w<strong>at</strong>er and soil.Benzene <strong>in</strong>hal<strong>at</strong>ion can lead to problems with blood production.Long-term exposure to benzene can cause cancer of theblood-form<strong>in</strong>g organs (i.e. leukemia). Furthermore, animalstudies suggest benzene has harmful effects on the develop<strong>in</strong>gfetus. Neurological effects are seen <strong>in</strong> high level exposure tobenzene. The immune system may also be affected by excessiveexposure to benzene. This <strong>in</strong>creases one's risk for <strong>in</strong>fectionand may even lower the body's defense aga<strong>in</strong>st cancer.47
Appendix 6Chlor<strong>in</strong>e is considered to be a high volume chemical withproduction exceed<strong>in</strong>g 1 million pounds annually <strong>in</strong> the U.S.Inhal<strong>at</strong>ion is a probable route of human exposure to chlor<strong>in</strong>e.Low level exposure leads to irrit<strong>at</strong>ion of the eyes, nose, thro<strong>at</strong>,respir<strong>at</strong>ory tract, and lungs.Chromium takes several different forms <strong>in</strong> the environment.The most common are chromium(0), trivalent (chromium III),and hexavalent (chromium VI). Chromium VI is commonly producedby <strong>in</strong>dustrial processes. Chromium compounds, mostly<strong>in</strong> chromium III or chromium VI forms, produced by the chemical<strong>in</strong>dustry are used for chrome pl<strong>at</strong><strong>in</strong>g, the manufacture ofdyes and pigments, le<strong>at</strong>her tann<strong>in</strong>g, and wood preserv<strong>in</strong>g.These chromium compounds are found <strong>in</strong> the air as f<strong>in</strong>e dustparticles. In general, chromium VI is more toxic than chromiumIII. Chromium VI is believed to be responsible for <strong>in</strong>creasedlung cancer r<strong>at</strong>es observed <strong>in</strong> workers who have chronic exposureto chromium compounds. High levels of chromium VI mayalso cause respir<strong>at</strong>ory illness such as asthma.Accord<strong>in</strong>g to Scorecard.com, diesel particul<strong>at</strong>e m<strong>at</strong>terfrom diesel eng<strong>in</strong>es is the predom<strong>in</strong>ant source of cancer riskfrom hazardous air pollutants. It has been determ<strong>in</strong>ed th<strong>at</strong> forthe U.S., the average cancer risk associ<strong>at</strong>ed with diesel particul<strong>at</strong>em<strong>at</strong>ter is 580 per million. Diesel emissions also posesignificant non-cancer health risks. The St<strong>at</strong>e and Territorial<strong>Air</strong> <strong>Pollution</strong> Program Adm<strong>in</strong>istr<strong>at</strong>ors and the Associ<strong>at</strong>ion ofLocal <strong>Air</strong> <strong>Pollution</strong> Control Officials estim<strong>at</strong>ed th<strong>at</strong> 125,000cancer cases may be due to diesel particul<strong>at</strong>e m<strong>at</strong>ter (<strong>Green</strong>Media Toolshed).Ethylene dibromide was used primarily as a pesticide anda gasol<strong>in</strong>e additive. Although exposure to ethylene dibromidecan occur through the air, the more common routes of exposureare soil and groundw<strong>at</strong>er. Inhal<strong>at</strong>ion studies <strong>in</strong> animals <strong>in</strong>dic<strong>at</strong>eth<strong>at</strong> high concentr<strong>at</strong>ions of ethylene dibromide can lead tode<strong>at</strong>h, whereas lower concentr<strong>at</strong>ions can cause liver and kidneydamage. Although no known birth defects are due to ethylenedibromide, it has been l<strong>in</strong>ked to decreased sperm production<strong>in</strong> males.A major route of exposure for formaldehyde is the air. It isused <strong>in</strong> many <strong>in</strong>dustries and is a ubiquitous part of life.Concentr<strong>at</strong>ions, however, are gre<strong>at</strong>est <strong>in</strong> urban areas. Themost common symptoms of high-level formaldehyde exposureare irrit<strong>at</strong>ion to the eyes, nose and thro<strong>at</strong>. Chronic long-termexposure has been associ<strong>at</strong>ed with cancer of the nose andthro<strong>at</strong>, although other studies have not confirmed this. The48Department of Health and Human Services (DHHS) and theIntern<strong>at</strong>ional Agency for Research on Cancer (IARC) have concludedth<strong>at</strong> formaldehyde is a potential human carc<strong>in</strong>ogen.The most common use of hexamethylene diisocyan<strong>at</strong>e isas a harden<strong>in</strong>g agent for automobile pa<strong>in</strong>ts. The most commonroute of exposure is through air. Acute high concentr<strong>at</strong>ions aswell as long-term low levels of hexamethylene diisocyan<strong>at</strong>e areassoci<strong>at</strong>ed with respir<strong>at</strong>ory illnesses.Ozone is a respir<strong>at</strong>ory irritant which can cause effectswhich range from mild to severe depend<strong>in</strong>g on exposure conditionsand <strong>in</strong>dividual susceptibility. In general, as concentr<strong>at</strong>ionsof ground-level ozone <strong>in</strong>crease, more and more peopleexperience health effects and the effects become more severe.Common symptoms of ozone exposure <strong>in</strong>clude mild irrit<strong>at</strong>ion ofthe thro<strong>at</strong>, difficulty bre<strong>at</strong>h<strong>in</strong>g and chest tightness. Ozoneaggrav<strong>at</strong>es chronic lung disease such as emphysema andbronchitis. Permanent lung damage may be caused throughrepe<strong>at</strong>ed ozone exposures. Repe<strong>at</strong>ed exposures by childrenmay lead to reduced lung function <strong>in</strong> adulthood. In adults,repe<strong>at</strong>ed exposures will result <strong>in</strong> an acceler<strong>at</strong>ed decl<strong>in</strong>e <strong>in</strong> lungfunction. Several groups of people are particularly sensitive toozone exposure. These groups <strong>in</strong>clude: active children, activeadults of all ages, people with asthma or other respir<strong>at</strong>ory diseasesand people with unusual susceptibility to ozone.Particul<strong>at</strong>e m<strong>at</strong>ter is a multi-component pollutant made upof acids (such as nitr<strong>at</strong>es and sulf<strong>at</strong>es), organic chemicals,metals, soil or dust particles, and allergens (such as fragmentsof pollen or mold spores). The size of the particles is directlyl<strong>in</strong>ked to their capacity for caus<strong>in</strong>g health problems. Small particles,less than 2.5 micrometers pose the gre<strong>at</strong>est problemsbecause they penetr<strong>at</strong>e deep <strong>in</strong>to the lungs. Particle exposurecan lead to a variety of health effects. Short-term exposures toparticles (hours or days) can aggrav<strong>at</strong>e lung disease, caus<strong>in</strong>gasthma <strong>at</strong>tacks and acute bronchitis. Short exposures may<strong>in</strong>crease susceptibility to respir<strong>at</strong>ory <strong>in</strong>fections. Individuals withheart disease may experience heart <strong>at</strong>tacks and arrhythmias.Healthy <strong>in</strong>dividuals may experience temporary symptoms aftershort exposures such as irrit<strong>at</strong>ion of the eyes, nose and thro<strong>at</strong>;cough<strong>in</strong>g; phlegm; chest tightness; and shortness of bre<strong>at</strong>h.Long term exposures to particles have been associ<strong>at</strong>ed withreduced lung function, the development of chronic bronchitisand prem<strong>at</strong>ure de<strong>at</strong>h. Individuals particularly susceptible toparticul<strong>at</strong>e m<strong>at</strong>ter exposure <strong>in</strong>clude those with lung disease,asthma or heart disease.
Appendix 7Summary Map and Table for East <strong>Houston</strong>49
Appendix 7: Table 1East <strong>Houston</strong> Def<strong>in</strong>ite Risk Pollutants50Table A7.1. East <strong>Houston</strong> Def<strong>in</strong>ite Risk Pollutants
Appendix 8: Table 1Supplemental Tables forDef<strong>in</strong>ite Risks, Probable Risks, and Possible RisksTable A8.1. Def<strong>in</strong>ite Risk51
Appendix 8: Table 2Table A8.2. Probable Risk52
Appendix 8: Table 3Table A8.3. Possible Risk53
ReferencesAmmenheuser, M. M., Bechtold, W. E., Abdel-Rahman, S. Z., Rosenbl<strong>at</strong>t, J. I., Hast<strong>in</strong>gs-Smith, D. A., & Ward, J. B., Jr. (2001).Assessment of 1,3-butadiene exposure <strong>in</strong> polymer production workers us<strong>in</strong>g HPRT mut<strong>at</strong>ions <strong>in</strong> lymphocytes as a biomarker.Environmental Health Perspectives, 109, 1249-1255.ATSDR. M<strong>in</strong>imal risk levels (MRLs) for hazardous substances. Retrieved 05/06, 2006, from http://www.<strong>at</strong>sdr.cdc.gov/mrls.htmlATSDR. (1993). Toxicological profile for 1,3-butadiene (No. PB/93/110690/AS): U.S. Department of Health and Human Services,Public Health Service.ATSDR. (1998). Toxicological profile for chromium. Atlanta, GA: U.S. Public Health Service, U.S. Department of Health andHuman Services.ATSDR. (2006). Toxicological profile <strong>in</strong>form<strong>at</strong>ion sheet. Retrieved 05/06, 2006, from http://www.<strong>at</strong>sdr.cdc.gov/toxpro2.html#-T-California ARB. (1998). The toxic air contam<strong>in</strong>ant identific<strong>at</strong>ion process: Toxic air contam<strong>in</strong>ant emissions from diesel-fueledeng<strong>in</strong>es. Fact Sheet. Retrieved 04/02, 2006, from http://www.arb.ca.gov/toxics/dieseltac/factsht1.pdfCalifornia ARB, & OEHHA. (1998). Executive summary for the proposed identific<strong>at</strong>ion of diesel exhaust as a toxic air contam<strong>in</strong>ant.Draft Report. Available <strong>at</strong>: http://www.arb.ca.gov/toxics/dieseltac/f<strong>in</strong>exsum.pdf.California EPA, & OEHHA. (2002). <strong>Air</strong> toxics hot spots program risk assessment guidel<strong>in</strong>es. Part II. Technical support documentfor describ<strong>in</strong>g available cancer potency factors. Retrieved 01/13, 2006, fromhttp://www.oehha.ca.gov/air/cancer_guide/TSD2.html#downloadCalifornia OEHHA. (2005). All chronic reference exposure levels adopted by OEHHA, as of February 2005.Retrieved 01/10, 2006, from http://www.oehha.ca.gov/air/chronic_rels/AllChrels.htmlCalifornia OEHHA. (2006). <strong>Air</strong>. Retrieved 03/27, 2006, from http://www.oehha.ca.gov/air.htmlCEN. (7/11/2005). Facts and figures for the chemical <strong>in</strong>dustry. Chemical and Eng<strong>in</strong>eer<strong>in</strong>g News, 83(28), 41.Delzell, E., S<strong>at</strong>hiakumar, N., Hov<strong>in</strong>ga, M., Malacuso, M., Julian, J., Larson, R., et al. (1996). A follow-up study of synthetic rubberworkers. Toxicology, 113, 182-189.Fraser, M. P., Lakshmanan, K., Fritz, S. G., & Ubanwa, B. (2002). Vari<strong>at</strong>ion <strong>in</strong> composition of f<strong>in</strong>e particul<strong>at</strong>e emissions from heavydutydiesel vehicles. Journal of Geophysical Research, 107(D21), 8346.Fraser, M. P., Yue, Z. W., & Buzcu, B. (2003). Source apportionment of f<strong>in</strong>e particul<strong>at</strong>e m<strong>at</strong>ter <strong>in</strong> <strong>Houston</strong>, TX, us<strong>in</strong>g organicmolecular markers. Atmospheric Environment, 37(15), 2117-2123.Gray, H. A. (1986). Control of <strong>at</strong>mospheric f<strong>in</strong>e primary carbon particle concentr<strong>at</strong>ions (No. EQL Report 23). Pasadena CA:Environmental Quality Labor<strong>at</strong>ory, California Institute of Technology.Gre<strong>at</strong>er <strong>Houston</strong> Partnership. (2005). Clear<strong>in</strong>g the air on clean air for the Gre<strong>at</strong>er <strong>Houston</strong> region. Retrieved 11/13, 2005, fromhttp://www.houston.org/media/public<strong>at</strong>ions.asp<strong>Green</strong> Media Toolshed. Scorecard. The pollution <strong>in</strong>form<strong>at</strong>ion site. Chemical profiles. Retrieved 05/06, 2006, fromhttp://www.scorecard.org/chemical-profiles/<strong>in</strong>dex.tcl54
ReferencesHackett, P., Sikov, M., & Mast, T. (1987). Inhal<strong>at</strong>ion developmental toxicology studies: ter<strong>at</strong>ology study of 1,3-butadiene <strong>in</strong> mice(f<strong>in</strong>al report) (PNL Report No.PNL-6412 UC-48; NIH Report No. NIH-401-ES-40131: 92).Richland, WA: Pacific Northwest Labor<strong>at</strong>ory.IARC Work<strong>in</strong>g Group. (1999). 1,3-Butadiene. IARC Monographs on the Evalu<strong>at</strong>ion of Carc<strong>in</strong>ogenic Risks to Humans, 71, 109-225.Jackson, M. A., Stack, H. F., Rice, J. M., & W<strong>at</strong>ers, M. D. (2000). A review of the genetic and rel<strong>at</strong>ed effects of 1,3-butadiene <strong>in</strong>rodents and humans. [Review]. Mut<strong>at</strong>ion Research, 463(3), 181-213.Meng, Q., Henderson, R. F., T., C., Heflich, R. H., Walker, D. M., Bauer, M. J., et al. (1999). Mutagenicity of 1,3-butadiene <strong>at</strong> theHprt locus of T-lymphocytes follow<strong>in</strong>g <strong>in</strong>hal<strong>at</strong>ion exposures of female mice and r<strong>at</strong>s. Mut<strong>at</strong>ion Research, 429, 107-125.NTP. (1993). Toxicology and Carc<strong>in</strong>ogenesis Studies of 1,3-Butadiene (CAS No. 106-99-0) <strong>in</strong> B6C3F1 Mice (Inhal<strong>at</strong>ion Studies).N<strong>at</strong>l Toxicol Program Tech Rep Ser., 434, 1-389.NTP. (2002). Report on Carc<strong>in</strong>ogens. Tenth Edition. U.S. Department of Health and Human Services, Public Health Service,N<strong>at</strong>ional Toxicology Program.OEHHA. (2000). Chronic toxicity summary: 1,3-Butadiene. California Environmental Protection Agency.Available <strong>at</strong>: http://www.oehha.ca.gov/air/chronic_rels/AllChrels.html.OEHHA. (2006). Chemicals known to the St<strong>at</strong>e to cause cancer or reproductive toxicity. Sacramento, CA: California EnvironmentalProtection Agency.Owen, P., Glaister, J., Gaunt, I., & Pull<strong>in</strong>ger, D. (1987). Inhal<strong>at</strong>ion toxicity studies with 1,3 butadiene, III: two year toxicity/carc<strong>in</strong>ogenicity studies <strong>in</strong> r<strong>at</strong>s. Am Ind Hyg Assoc J., 48, 407-413.TCEQ. (2005). The <strong>Houston</strong> air quality change. Rapid economic and popul<strong>at</strong>ion growth cre<strong>at</strong>e a potent blend for the region'senvironment. N<strong>at</strong>ural Outlook, Spr<strong>in</strong>g 2005 Retrieved 04/25, 2006, fromhttp://www.tceq.st<strong>at</strong>e.tx.us/comm_exec/forms_pubs/pubs/pd/020/05-02/houston.htmlTCEQ. (2006). <strong>Houston</strong>-Galveston-Brazoria 8-Hour ozone non<strong>at</strong>ta<strong>in</strong>ment area. Retrieved 05/26, 2006, fromhttp://www.tceq.st<strong>at</strong>e.tx.us/implement<strong>at</strong>ion/air/sip/hgb.htmlU.S. EPA. (1990). Clean <strong>Air</strong> Act. Retrieved 10/14, 2005, from http://www.epa.gov/air/oaq_caa.html/U.S. EPA. (1999). 1996 N<strong>at</strong>ional-scale air toxics assessment. Retrieved 04/14, 2006, from http://www.epa.gov/ttn/<strong>at</strong>w/n<strong>at</strong>a/U.S. EPA. (2001). N<strong>at</strong>ional-scale air toxics assessment for 1996: Appendix H, Estim<strong>at</strong><strong>in</strong>g carc<strong>in</strong>ogenic potency for mixtures ofpolycyclic organic m<strong>at</strong>ter (POM) for the 1996 N<strong>at</strong>ional-scale assessment. Prelim<strong>in</strong>ary Draft Retrieved 04/23, 2006, fromhttp://www.epa.gov/ttn/<strong>at</strong>w/sab/sabrev.htmlU.S. EPA. (2002). Diesel PM model-to-measurement comparison (No. EPA420-D-02-004). Michigan: Assessment and StandardsDivision, Office of Transport<strong>at</strong>ion and <strong>Air</strong> Quality.U.S. EPA. (2003). Framework for cumul<strong>at</strong>ive risk assessment. (No. EPA/600/P-02/001F). Wash<strong>in</strong>gton, DC.: Office of Research andDevelopment, N<strong>at</strong>ional Center for Environmental Assessment, Wash<strong>in</strong>gton Office. Available <strong>at</strong>:http://cfpub.epa.gov/ncea/raf/recordisplay.cfm?deid=54944.55
ReferencesU.S. EPA. (2004). User's guide for the emissions model<strong>in</strong>g system for hazardous air pollutants (EMS-HAP) Version 3.0(No. EPA-454/B-03-006). Research Triangle Park, NC: Office of <strong>Air</strong> Quality Plann<strong>in</strong>g and Standards, Emissions, Monitor<strong>in</strong>g andAnalysis Division. Available <strong>at</strong>: http://www.epa.gov/scram001/userg/other/emshapv3ug.pdf.U.S. EPA. (2005). Prioritized chronic dose-response values for screen<strong>in</strong>g risk assessments (Table1). Retrieved 01/08, 2006, fromhttp://www.epa.gov/ttn/<strong>at</strong>w/toxsource/summary.htmlU.S. EPA. (2006a). 8-Hour ground-level ozone design<strong>at</strong>ions. Region 6: St<strong>at</strong>e design<strong>at</strong>ions. Retrieved 05/25, 2006, fromhttp://www.epa.gov/ozonedesign<strong>at</strong>ions/regions/region6desig.htmU.S. EPA. (2006b). 1999 N<strong>at</strong>ional-scale air toxics assessment. Retrieved 03/14, 2006, fromhttp://www.epa.gov/ttn/<strong>at</strong>w/n<strong>at</strong>a1999/<strong>in</strong>dex.htmlU.S. EPA. (2006c). 1999 N<strong>at</strong>ional-scale air toxics assessment: 1999 d<strong>at</strong>a tables. Texas st<strong>at</strong>e summary d<strong>at</strong>abase (NEI) and countylevelemission summaries. Retrieved 03/11, 2006, from http://www.epa.gov/ttn/<strong>at</strong>w/n<strong>at</strong>a1999/tables.htmlU.S. EPA. (2006d). 1999 N<strong>at</strong>ional-scale air toxics assessment: 1999 d<strong>at</strong>a tables. Texas st<strong>at</strong>e summary d<strong>at</strong>abase. ASPEN.Retrieved 02, 2006, from http://www.epa.gov/ttn/<strong>at</strong>w/n<strong>at</strong>a1999/tables.htmlU.S. EPA. (2006e). <strong>Air</strong> quality system. D<strong>at</strong>a on hazardous air pollutants and criteria pollutants. D<strong>at</strong>a provided by the Office of <strong>Air</strong>Quality Plann<strong>in</strong>g and Standards, U.S. EPA., URL: http://www.epa.gov/ttn/airs/airsaqs/<strong>in</strong>dex.htmU.S. EPA. (2006f). <strong>Air</strong> quality system. D<strong>at</strong>a on speci<strong>at</strong>ed carbon. Report Request ID: 315696. D<strong>at</strong>a provided by the Office of <strong>Air</strong>Quality Plann<strong>in</strong>g and Standards, U.S. EPA Retrieved 03/14/, 2006. URL: http://www.epa.gov/ttn/airs/airsaqs/<strong>in</strong>dex.htmU.S. EPA. (2006g). Comparison of 1999 model-predicted concentr<strong>at</strong>ions to monitored d<strong>at</strong>a. Retrieved 03/17, 2006, fromhttp://www.epa.gov/ttn/<strong>at</strong>w/n<strong>at</strong>a1999/99compare.htmlU.S. EPA. (2006h). Health effects <strong>in</strong>form<strong>at</strong>ion used <strong>in</strong> cancer and noncancer risk characteriz<strong>at</strong>ion for the 1999 N<strong>at</strong>ional-scaleassessment. 1999 N<strong>at</strong>ional-scale air toxics assessment. 1999 assessment results. Retrieved 03/24, 2006, fromhttp://www.epa.gov/ttn/<strong>at</strong>w/n<strong>at</strong>a1999/ns<strong>at</strong>a99.htmlU.S. EPA. (2006i). Integr<strong>at</strong>ed risk <strong>in</strong>form<strong>at</strong>ion system. IRIS d<strong>at</strong>abase for risk assessment. Retrieved 01/14, 2006, fromhttp://www.epa.gov/iris/Ward, J. B., Jr., Abdel-Rahman, S. Z., Henderson, R. F., Stock, T. H., Morandi, M., Rosenbl<strong>at</strong>t, J. I., et al. (2001). Assessment ofbutadiene exposure <strong>in</strong> synthetic rubber manufactur<strong>in</strong>g workers <strong>in</strong> Texas us<strong>in</strong>g frequencies of hprt mutant lymphocytes as abiomarker. Chem Biol Interact., 135-136, 465-483.56