A Closer Look at Air Pollution in Houston: - Green Houston
A Closer Look at Air Pollution in Houston: - Green Houston
A Closer Look at Air Pollution in Houston: - Green Houston

You also want an ePaper? Increase the reach of your titles
YUMPU automatically turns print PDFs into web optimized ePapers that Google loves.
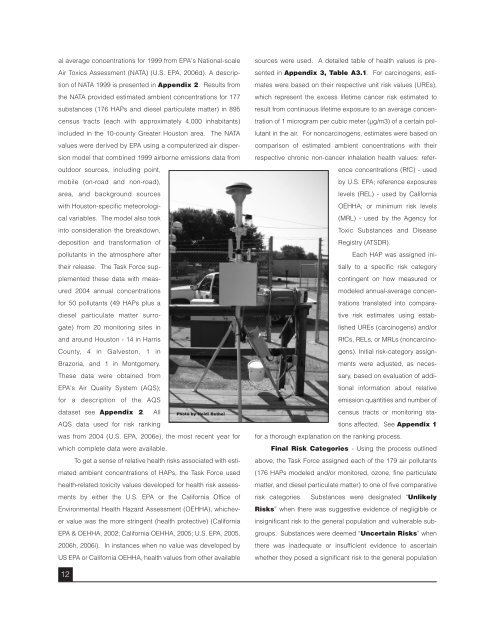
al average concentr<strong>at</strong>ions for 1999 from EPA's N<strong>at</strong>ional-scale<strong>Air</strong> Toxics Assessment (NATA) (U.S. EPA, 2006d). A descriptionof NATA 1999 is presented <strong>in</strong> Appendix 2. Results fromthe NATA provided estim<strong>at</strong>ed ambient concentr<strong>at</strong>ions for 177substances (176 HAPs and diesel particul<strong>at</strong>e m<strong>at</strong>ter) <strong>in</strong> 895census tracts (each with approxim<strong>at</strong>ely 4,000 <strong>in</strong>habitants)<strong>in</strong>cluded <strong>in</strong> the 10-county Gre<strong>at</strong>er <strong>Houston</strong> area. The NATAvalues were derived by EPA us<strong>in</strong>g a computerized air dispersionmodel th<strong>at</strong> comb<strong>in</strong>ed 1999 airborne emissions d<strong>at</strong>a fromoutdoor sources, <strong>in</strong>clud<strong>in</strong>g po<strong>in</strong>t,mobile (on-road and non-road),area, and background sourceswith <strong>Houston</strong>-specific meteorologicalvariables. The model also took<strong>in</strong>to consider<strong>at</strong>ion the breakdown,deposition and transform<strong>at</strong>ion ofpollutants <strong>in</strong> the <strong>at</strong>mosphere aftertheir release. The Task Force supplementedthese d<strong>at</strong>a with measured2004 annual concentr<strong>at</strong>ionsfor 50 pollutants (49 HAPs plus adiesel particul<strong>at</strong>e m<strong>at</strong>ter surrog<strong>at</strong>e)from 20 monitor<strong>in</strong>g sites <strong>in</strong>and around <strong>Houston</strong> - 14 <strong>in</strong> HarrisCounty, 4 <strong>in</strong> Galveston, 1 <strong>in</strong>Brazoria, and 1 <strong>in</strong> Montgomery.These d<strong>at</strong>a were obta<strong>in</strong>ed fromEPA's <strong>Air</strong> Quality System (AQS);for a description of the AQSd<strong>at</strong>aset see Appendix 2. AllAQS d<strong>at</strong>a used for risk rank<strong>in</strong>gPhoto by Heidi Bethelwas from 2004 (U.S. EPA, 2006e), the most recent year forwhich complete d<strong>at</strong>a were available.To get a sense of rel<strong>at</strong>ive health risks associ<strong>at</strong>ed with estim<strong>at</strong>edambient concentr<strong>at</strong>ions of HAPs, the Task Force usedhealth-rel<strong>at</strong>ed toxicity values developed for health risk assessmentsby either the U.S. EPA or the California Office ofEnvironmental Health Hazard Assessment (OEHHA), whichevervalue was the more str<strong>in</strong>gent (health protective) (CaliforniaEPA & OEHHA, 2002; California OEHHA, 2005; U.S. EPA, 2005,2006h, 2006i). In <strong>in</strong>stances when no value was developed byUS EPA or California OEHHA, health values from other availablesources were used. A detailed table of health values is presented<strong>in</strong> Appendix 3, Table A3.1. For carc<strong>in</strong>ogens, estim<strong>at</strong>eswere based on their respective unit risk values (UREs),which represent the excess lifetime cancer risk estim<strong>at</strong>ed toresult from cont<strong>in</strong>uous lifetime exposure to an average concentr<strong>at</strong>ionof 1 microgram per cubic meter (µg/m3) of a certa<strong>in</strong> pollutant<strong>in</strong> the air. For noncarc<strong>in</strong>ogens, estim<strong>at</strong>es were based oncomparison of estim<strong>at</strong>ed ambient concentr<strong>at</strong>ions with theirrespective chronic non-cancer <strong>in</strong>hal<strong>at</strong>ion health values: referenceconcentr<strong>at</strong>ions (RfC) - usedby U.S. EPA; reference exposureslevels (REL) - used by CaliforniaOEHHA; or m<strong>in</strong>imum risk levels(MRL) - used by the Agency forToxic Substances and DiseaseRegistry (ATSDR).Each HAP was assigned <strong>in</strong>itiallyto a specific risk c<strong>at</strong>egorycont<strong>in</strong>gent on how measured ormodeled annual-average concentr<strong>at</strong>ionstransl<strong>at</strong>ed <strong>in</strong>to compar<strong>at</strong>iverisk estim<strong>at</strong>es us<strong>in</strong>g establishedUREs (carc<strong>in</strong>ogens) and/orRfCs, RELs, or MRLs (noncarc<strong>in</strong>ogens).Initial risk-c<strong>at</strong>egory assignmentswere adjusted, as necessary,based on evalu<strong>at</strong>ion of additional<strong>in</strong>form<strong>at</strong>ion about rel<strong>at</strong>iveemission quantities and number ofcensus tracts or monitor<strong>in</strong>g st<strong>at</strong>ionsaffected. See Appendix 1for a thorough explan<strong>at</strong>ion on the rank<strong>in</strong>g process.F<strong>in</strong>al Risk C<strong>at</strong>egories - Us<strong>in</strong>g the process outl<strong>in</strong>edabove, the Task Force assigned each of the 179 air pollutants(176 HAPs modeled and/or monitored, ozone, f<strong>in</strong>e particul<strong>at</strong>em<strong>at</strong>ter, and diesel particul<strong>at</strong>e m<strong>at</strong>ter) to one of five compar<strong>at</strong>iverisk c<strong>at</strong>egories. Substances were design<strong>at</strong>ed “UnlikelyRisks” when there was suggestive evidence of negligible or<strong>in</strong>significant risk to the general popul<strong>at</strong>ion and vulnerable subgroups.Substances were deemed “Uncerta<strong>in</strong> Risks” whenthere was <strong>in</strong>adequ<strong>at</strong>e or <strong>in</strong>sufficient evidence to ascerta<strong>in</strong>whether they posed a significant risk to the general popul<strong>at</strong>ion12