A Closer Look at Air Pollution in Houston: - Green Houston
A Closer Look at Air Pollution in Houston: - Green Houston
A Closer Look at Air Pollution in Houston: - Green Houston

You also want an ePaper? Increase the reach of your titles
YUMPU automatically turns print PDFs into web optimized ePapers that Google loves.
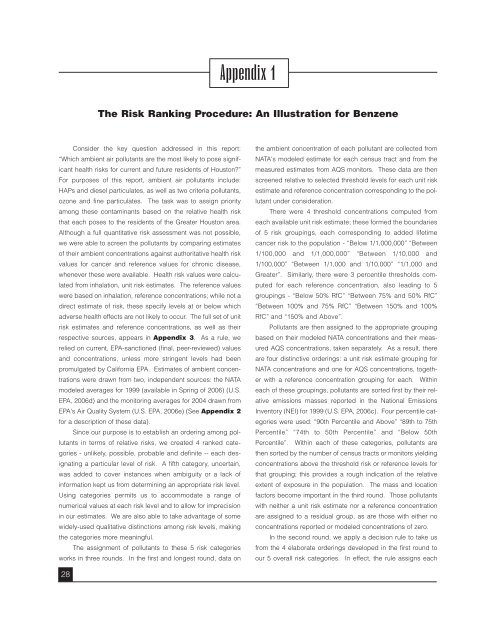
Appendix 1The Risk Rank<strong>in</strong>g Procedure: An Illustr<strong>at</strong>ion for BenzeneConsider the key question addressed <strong>in</strong> this report:“Which ambient air pollutants are the most likely to pose significanthealth risks for current and future residents of <strong>Houston</strong>?”For purposes of this report, ambient air pollutants <strong>in</strong>clude:HAPs and diesel particul<strong>at</strong>es, as well as two criteria pollutants,ozone and f<strong>in</strong>e particul<strong>at</strong>es. The task was to assign priorityamong these contam<strong>in</strong>ants based on the rel<strong>at</strong>ive health riskth<strong>at</strong> each poses to the residents of the Gre<strong>at</strong>er <strong>Houston</strong> area.Although a full quantit<strong>at</strong>ive risk assessment was not possible,we were able to screen the pollutants by compar<strong>in</strong>g estim<strong>at</strong>esof their ambient concentr<strong>at</strong>ions aga<strong>in</strong>st authorit<strong>at</strong>ive health riskvalues for cancer and reference values for chronic disease,whenever these were available. Health risk values were calcul<strong>at</strong>edfrom <strong>in</strong>hal<strong>at</strong>ion, unit risk estim<strong>at</strong>es. The reference valueswere based on <strong>in</strong>hal<strong>at</strong>ion, reference concentr<strong>at</strong>ions; while not adirect estim<strong>at</strong>e of risk, these specify levels <strong>at</strong> or below whichadverse health effects are not likely to occur. The full set of unitrisk estim<strong>at</strong>es and reference concentr<strong>at</strong>ions, as well as theirrespective sources, appears <strong>in</strong> Appendix 3. As a rule, werelied on current, EPA-sanctioned (f<strong>in</strong>al, peer-reviewed) valuesand concentr<strong>at</strong>ions, unless more str<strong>in</strong>gent levels had beenpromulg<strong>at</strong>ed by California EPA. Estim<strong>at</strong>es of ambient concentr<strong>at</strong>ionswere drawn from two, <strong>in</strong>dependent sources: the NATAmodeled averages for 1999 (available <strong>in</strong> Spr<strong>in</strong>g of 2006) (U.S.EPA, 2006d) and the monitor<strong>in</strong>g averages for 2004 drawn fromEPA's <strong>Air</strong> Quality System (U.S. EPA, 2006e) (See Appendix 2for a description of these d<strong>at</strong>a).S<strong>in</strong>ce our purpose is to establish an order<strong>in</strong>g among pollutants<strong>in</strong> terms of rel<strong>at</strong>ive risks, we cre<strong>at</strong>ed 4 ranked c<strong>at</strong>egories- unlikely, possible, probable and def<strong>in</strong>ite -- each design<strong>at</strong><strong>in</strong>ga particular level of risk. A fifth c<strong>at</strong>egory, uncerta<strong>in</strong>,was added to cover <strong>in</strong>stances when ambiguity or a lack of<strong>in</strong>form<strong>at</strong>ion kept us from determ<strong>in</strong><strong>in</strong>g an appropri<strong>at</strong>e risk level.Us<strong>in</strong>g c<strong>at</strong>egories permits us to accommod<strong>at</strong>e a range ofnumerical values <strong>at</strong> each risk level and to allow for imprecision<strong>in</strong> our estim<strong>at</strong>es. We are also able to take advantage of somewidely-used qualit<strong>at</strong>ive dist<strong>in</strong>ctions among risk levels, mak<strong>in</strong>gthe c<strong>at</strong>egories more mean<strong>in</strong>gful.The assignment of pollutants to these 5 risk c<strong>at</strong>egoriesworks <strong>in</strong> three rounds. In the first and longest round, d<strong>at</strong>a onthe ambient concentr<strong>at</strong>ion of each pollutant are collected fromNATA's modeled estim<strong>at</strong>e for each census tract and from themeasured estim<strong>at</strong>es from AQS monitors. These d<strong>at</strong>a are thenscreened rel<strong>at</strong>ive to selected threshold levels for each unit riskestim<strong>at</strong>e and reference concentr<strong>at</strong>ion correspond<strong>in</strong>g to the pollutantunder consider<strong>at</strong>ion.There were 4 threshold concentr<strong>at</strong>ions computed fromeach available unit risk estim<strong>at</strong>e; these formed the boundariesof 5 risk group<strong>in</strong>gs, each correspond<strong>in</strong>g to added lifetimecancer risk to the popul<strong>at</strong>ion - “Below 1/1,000,000” “Between1/100,000 and 1/1,000,000” “Between 1/10,000 and1/100,000” “Between 1/1,000 and 1/10,000” “1/1,000 andGre<strong>at</strong>er”. Similarly, there were 3 percentile thresholds computedfor each reference concentr<strong>at</strong>ion, also lead<strong>in</strong>g to 5group<strong>in</strong>gs - “Below 50% RfC” “Between 75% and 50% RfC”“Between 100% and 75% RfC” “Between 150% and 100%RfC” and “150% and Above”.Pollutants are then assigned to the appropri<strong>at</strong>e group<strong>in</strong>gbased on their modeled NATA concentr<strong>at</strong>ions and their measuredAQS concentr<strong>at</strong>ions, taken separ<strong>at</strong>ely. As a result, thereare four dist<strong>in</strong>ctive order<strong>in</strong>gs: a unit risk estim<strong>at</strong>e group<strong>in</strong>g forNATA concentr<strong>at</strong>ions and one for AQS concentr<strong>at</strong>ions, togetherwith a reference concentr<strong>at</strong>ion group<strong>in</strong>g for each. With<strong>in</strong>each of these group<strong>in</strong>gs, pollutants are sorted first by their rel<strong>at</strong>iveemissions masses reported <strong>in</strong> the N<strong>at</strong>ional EmissionsInventory (NEI) for 1999 (U.S. EPA, 2006c). Four percentile c<strong>at</strong>egorieswere used: “90th Percentile and Above” “89th to 75thPercentile” “74th to 50th Percentile” and “Below 50thPercentile”. With<strong>in</strong> each of these c<strong>at</strong>egories, pollutants arethen sorted by the number of census tracts or monitors yield<strong>in</strong>gconcentr<strong>at</strong>ions above the threshold risk or reference levels forth<strong>at</strong> group<strong>in</strong>g; this provides a rough <strong>in</strong>dic<strong>at</strong>ion of the rel<strong>at</strong>iveextent of exposure <strong>in</strong> the popul<strong>at</strong>ion. The mass and loc<strong>at</strong>ionfactors become important <strong>in</strong> the third round. Those pollutantswith neither a unit risk estim<strong>at</strong>e nor a reference concentr<strong>at</strong>ionare assigned to a residual group, as are those with either noconcentr<strong>at</strong>ions reported or modeled concentr<strong>at</strong>ions of zero.In the second round, we apply a decision rule to take usfrom the 4 elabor<strong>at</strong>e order<strong>in</strong>gs developed <strong>in</strong> the first round toour 5 overall risk c<strong>at</strong>egories. In effect, the rule assigns each28