A Closer Look at Air Pollution in Houston: - Green Houston
A Closer Look at Air Pollution in Houston: - Green Houston
A Closer Look at Air Pollution in Houston: - Green Houston

Create successful ePaper yourself
Turn your PDF publications into a flip-book with our unique Google optimized e-Paper software.
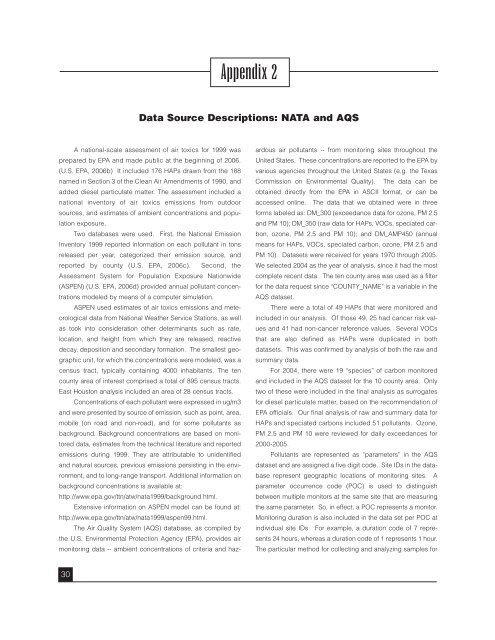
Appendix 2D<strong>at</strong>a Source Descriptions: NATA and AQSA n<strong>at</strong>ional-scale assessment of air toxics for 1999 wasprepared by EPA and made public <strong>at</strong> the beg<strong>in</strong>n<strong>in</strong>g of 2006.(U.S. EPA, 2006b) It <strong>in</strong>cluded 176 HAPs drawn from the 188named <strong>in</strong> Section 3 of the Clean <strong>Air</strong> Amendments of 1990, andadded diesel particul<strong>at</strong>e m<strong>at</strong>ter. The assessment <strong>in</strong>cluded an<strong>at</strong>ional <strong>in</strong>ventory of air toxics emissions from outdoorsources, and estim<strong>at</strong>es of ambient concentr<strong>at</strong>ions and popul<strong>at</strong>ionexposure.Two d<strong>at</strong>abases were used. First, the N<strong>at</strong>ional EmissionInventory 1999 reported <strong>in</strong>form<strong>at</strong>ion on each pollutant <strong>in</strong> tonsreleased per year, c<strong>at</strong>egorized their emission source, andreported by county (U.S. EPA, 2006c). Second, theAssessment System for Popul<strong>at</strong>ion Exposure N<strong>at</strong>ionwide(ASPEN) (U.S. EPA, 2006d) provided annual pollutant concentr<strong>at</strong>ionsmodeled by means of a computer simul<strong>at</strong>ion.ASPEN used estim<strong>at</strong>es of air toxics emissions and meteorologicald<strong>at</strong>a from N<strong>at</strong>ional We<strong>at</strong>her Service St<strong>at</strong>ions, as wellas took <strong>in</strong>to consider<strong>at</strong>ion other determ<strong>in</strong>ants such as r<strong>at</strong>e,loc<strong>at</strong>ion, and height from which they are released, reactivedecay, deposition and secondary form<strong>at</strong>ion. The smallest geographicunit, for which the concentr<strong>at</strong>ions were modeled, was acensus tract, typically conta<strong>in</strong><strong>in</strong>g 4000 <strong>in</strong>habitants. The tencounty area of <strong>in</strong>terest comprised a total of 895 census tracts.East <strong>Houston</strong> analysis <strong>in</strong>cluded an area of 28 census tracts.Concentr<strong>at</strong>ions of each pollutant were expressed <strong>in</strong> ug/m3and were presented by source of emission, such as po<strong>in</strong>t, area,mobile (on road and non-road), and for some pollutants asbackground. Background concentr<strong>at</strong>ions are based on monitoredd<strong>at</strong>a, estim<strong>at</strong>es from the technical liter<strong>at</strong>ure and reportedemissions dur<strong>in</strong>g 1999. They are <strong>at</strong>tributable to unidentifiedand n<strong>at</strong>ural sources, previous emissions persist<strong>in</strong>g <strong>in</strong> the environment,and to long-range transport. Additional <strong>in</strong>form<strong>at</strong>ion onbackground concentr<strong>at</strong>ions is available <strong>at</strong>:http://www.epa.gov/ttn/<strong>at</strong>w/n<strong>at</strong>a1999/background.html.Extensive <strong>in</strong>form<strong>at</strong>ion on ASPEN model can be found <strong>at</strong>:http://www.epa.gov/ttn/<strong>at</strong>w/n<strong>at</strong>a1999/aspen99.html.The <strong>Air</strong> Quality System (AQS) d<strong>at</strong>abase, as compiled bythe U.S. Environmental Protection Agency (EPA), provides airmonitor<strong>in</strong>g d<strong>at</strong>a -- ambient concentr<strong>at</strong>ions of criteria and hazardousair pollutants -- from monitor<strong>in</strong>g sites throughout theUnited St<strong>at</strong>es. These concentr<strong>at</strong>ions are reported to the EPA byvarious agencies throughout the United St<strong>at</strong>es (e.g. the TexasCommission on Environmental Quality). The d<strong>at</strong>a can beobta<strong>in</strong>ed directly from the EPA <strong>in</strong> ASCII form<strong>at</strong>, or can beaccessed onl<strong>in</strong>e. The d<strong>at</strong>a th<strong>at</strong> we obta<strong>in</strong>ed were <strong>in</strong> threeforms labeled as: DM_300 (exceedance d<strong>at</strong>a for ozone, PM 2.5and PM 10); DM_350 (raw d<strong>at</strong>a for HAPs, VOCs, speci<strong>at</strong>ed carbon,ozone, PM 2.5 and PM 10); and DM_AMP450 (annualmeans for HAPs, VOCs, speci<strong>at</strong>ed carbon, ozone, PM 2.5 andPM 10). D<strong>at</strong>asets were received for years 1970 through 2005.We selected 2004 as the year of analysis, s<strong>in</strong>ce it had the mostcomplete recent d<strong>at</strong>a. The ten county area was used as a filterfor the d<strong>at</strong>a request s<strong>in</strong>ce “COUNTY_NAME” is a variable <strong>in</strong> theAQS d<strong>at</strong>aset.There were a total of 49 HAPs th<strong>at</strong> were monitored and<strong>in</strong>cluded <strong>in</strong> our analysis. Of those 49, 25 had cancer risk valuesand 41 had non-cancer reference values. Several VOCsth<strong>at</strong> are also def<strong>in</strong>ed as HAPs were duplic<strong>at</strong>ed <strong>in</strong> bothd<strong>at</strong>asets. This was confirmed by analysis of both the raw andsummary d<strong>at</strong>a.For 2004, there were 19 “species” of carbon monitoredand <strong>in</strong>cluded <strong>in</strong> the AQS d<strong>at</strong>aset for the 10 county area. Onlytwo of these were <strong>in</strong>cluded <strong>in</strong> the f<strong>in</strong>al analysis as surrog<strong>at</strong>esfor diesel particul<strong>at</strong>e m<strong>at</strong>ter, based on the recommend<strong>at</strong>ion ofEPA officials. Our f<strong>in</strong>al analysis of raw and summary d<strong>at</strong>a forHAPs and speci<strong>at</strong>ed carbons <strong>in</strong>cluded 51 pollutants. Ozone,PM 2.5 and PM 10 were reviewed for daily exceedances for2000-2005.Pollutants are represented as “parameters” <strong>in</strong> the AQSd<strong>at</strong>aset and are assigned a five digit code. Site IDs <strong>in</strong> the d<strong>at</strong>abaserepresent geographic loc<strong>at</strong>ions of monitor<strong>in</strong>g sites. Aparameter occurrence code (POC) is used to dist<strong>in</strong>guishbetween multiple monitors <strong>at</strong> the same site th<strong>at</strong> are measur<strong>in</strong>gthe same parameter. So, <strong>in</strong> effect, a POC represents a monitor.Monitor<strong>in</strong>g dur<strong>at</strong>ion is also <strong>in</strong>cluded <strong>in</strong> the d<strong>at</strong>a set per POC <strong>at</strong><strong>in</strong>dividual site IDs. For example, a dur<strong>at</strong>ion code of 7 represents24 hours, whereas a dur<strong>at</strong>ion code of 1 represents 1 hour.The particular method for collect<strong>in</strong>g and analyz<strong>in</strong>g samples for30