al average concentr<strong>at</strong>ions for 1999 from EPA's N<strong>at</strong>ional-scale<strong>Air</strong> Toxics Assessment (NATA) (U.S. EPA, 2006d). A descriptionof NATA 1999 is presented <strong>in</strong> Appendix 2. Results fromthe NATA provided estim<strong>at</strong>ed ambient concentr<strong>at</strong>ions for 177substances (176 HAPs and diesel particul<strong>at</strong>e m<strong>at</strong>ter) <strong>in</strong> 895census tracts (each with approxim<strong>at</strong>ely 4,000 <strong>in</strong>habitants)<strong>in</strong>cluded <strong>in</strong> the 10-county Gre<strong>at</strong>er <strong>Houston</strong> area. The NATAvalues were derived by EPA us<strong>in</strong>g a computerized air dispersionmodel th<strong>at</strong> comb<strong>in</strong>ed 1999 airborne emissions d<strong>at</strong>a fromoutdoor sources, <strong>in</strong>clud<strong>in</strong>g po<strong>in</strong>t,mobile (on-road and non-road),area, and background sourceswith <strong>Houston</strong>-specific meteorologicalvariables. The model also took<strong>in</strong>to consider<strong>at</strong>ion the breakdown,deposition and transform<strong>at</strong>ion ofpollutants <strong>in</strong> the <strong>at</strong>mosphere aftertheir release. The Task Force supplementedthese d<strong>at</strong>a with measured2004 annual concentr<strong>at</strong>ionsfor 50 pollutants (49 HAPs plus adiesel particul<strong>at</strong>e m<strong>at</strong>ter surrog<strong>at</strong>e)from 20 monitor<strong>in</strong>g sites <strong>in</strong>and around <strong>Houston</strong> - 14 <strong>in</strong> HarrisCounty, 4 <strong>in</strong> Galveston, 1 <strong>in</strong>Brazoria, and 1 <strong>in</strong> Montgomery.These d<strong>at</strong>a were obta<strong>in</strong>ed fromEPA's <strong>Air</strong> Quality System (AQS);for a description of the AQSd<strong>at</strong>aset see Appendix 2. AllAQS d<strong>at</strong>a used for risk rank<strong>in</strong>gPhoto by Heidi Bethelwas from 2004 (U.S. EPA, 2006e), the most recent year forwhich complete d<strong>at</strong>a were available.To get a sense of rel<strong>at</strong>ive health risks associ<strong>at</strong>ed with estim<strong>at</strong>edambient concentr<strong>at</strong>ions of HAPs, the Task Force usedhealth-rel<strong>at</strong>ed toxicity values developed for health risk assessmentsby either the U.S. EPA or the California Office ofEnvironmental Health Hazard Assessment (OEHHA), whichevervalue was the more str<strong>in</strong>gent (health protective) (CaliforniaEPA & OEHHA, 2002; California OEHHA, 2005; U.S. EPA, 2005,2006h, 2006i). In <strong>in</strong>stances when no value was developed byUS EPA or California OEHHA, health values from other availablesources were used. A detailed table of health values is presented<strong>in</strong> Appendix 3, Table A3.1. For carc<strong>in</strong>ogens, estim<strong>at</strong>eswere based on their respective unit risk values (UREs),which represent the excess lifetime cancer risk estim<strong>at</strong>ed toresult from cont<strong>in</strong>uous lifetime exposure to an average concentr<strong>at</strong>ionof 1 microgram per cubic meter (µg/m3) of a certa<strong>in</strong> pollutant<strong>in</strong> the air. For noncarc<strong>in</strong>ogens, estim<strong>at</strong>es were based oncomparison of estim<strong>at</strong>ed ambient concentr<strong>at</strong>ions with theirrespective chronic non-cancer <strong>in</strong>hal<strong>at</strong>ion health values: referenceconcentr<strong>at</strong>ions (RfC) - usedby U.S. EPA; reference exposureslevels (REL) - used by CaliforniaOEHHA; or m<strong>in</strong>imum risk levels(MRL) - used by the Agency forToxic Substances and DiseaseRegistry (ATSDR).Each HAP was assigned <strong>in</strong>itiallyto a specific risk c<strong>at</strong>egorycont<strong>in</strong>gent on how measured ormodeled annual-average concentr<strong>at</strong>ionstransl<strong>at</strong>ed <strong>in</strong>to compar<strong>at</strong>iverisk estim<strong>at</strong>es us<strong>in</strong>g establishedUREs (carc<strong>in</strong>ogens) and/orRfCs, RELs, or MRLs (noncarc<strong>in</strong>ogens).Initial risk-c<strong>at</strong>egory assignmentswere adjusted, as necessary,based on evalu<strong>at</strong>ion of additional<strong>in</strong>form<strong>at</strong>ion about rel<strong>at</strong>iveemission quantities and number ofcensus tracts or monitor<strong>in</strong>g st<strong>at</strong>ionsaffected. See Appendix 1for a thorough explan<strong>at</strong>ion on the rank<strong>in</strong>g process.F<strong>in</strong>al Risk C<strong>at</strong>egories - Us<strong>in</strong>g the process outl<strong>in</strong>edabove, the Task Force assigned each of the 179 air pollutants(176 HAPs modeled and/or monitored, ozone, f<strong>in</strong>e particul<strong>at</strong>em<strong>at</strong>ter, and diesel particul<strong>at</strong>e m<strong>at</strong>ter) to one of five compar<strong>at</strong>iverisk c<strong>at</strong>egories. Substances were design<strong>at</strong>ed “UnlikelyRisks” when there was suggestive evidence of negligible or<strong>in</strong>significant risk to the general popul<strong>at</strong>ion and vulnerable subgroups.Substances were deemed “Uncerta<strong>in</strong> Risks” whenthere was <strong>in</strong>adequ<strong>at</strong>e or <strong>in</strong>sufficient evidence to ascerta<strong>in</strong>whether they posed a significant risk to the general popul<strong>at</strong>ion12
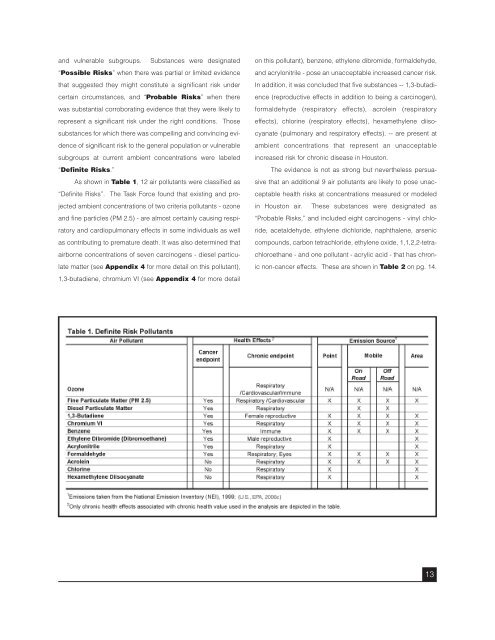
and vulnerable subgroups. Substances were design<strong>at</strong>ed“Possible Risks” when there was partial or limited evidenceth<strong>at</strong> suggested they might constitute a significant risk undercerta<strong>in</strong> circumstances, and “Probable Risks” when therewas substantial corrobor<strong>at</strong><strong>in</strong>g evidence th<strong>at</strong> they were likely torepresent a significant risk under the right conditions. Thosesubstances for which there was compell<strong>in</strong>g and conv<strong>in</strong>c<strong>in</strong>g evidenceof significant risk to the general popul<strong>at</strong>ion or vulnerablesubgroups <strong>at</strong> current ambient concentr<strong>at</strong>ions were labeled“Def<strong>in</strong>ite Risks.”As shown <strong>in</strong> Table 1, 12 air pollutants were classified as“Def<strong>in</strong>ite Risks”. The Task Force found th<strong>at</strong> exist<strong>in</strong>g and projectedambient concentr<strong>at</strong>ions of two criteria pollutants - ozoneand f<strong>in</strong>e particles (PM 2.5) - are almost certa<strong>in</strong>ly caus<strong>in</strong>g respir<strong>at</strong>oryand cardiopulmonary effects <strong>in</strong> some <strong>in</strong>dividuals as wellas contribut<strong>in</strong>g to prem<strong>at</strong>ure de<strong>at</strong>h. It was also determ<strong>in</strong>ed th<strong>at</strong>airborne concentr<strong>at</strong>ions of seven carc<strong>in</strong>ogens - diesel particul<strong>at</strong>em<strong>at</strong>ter (see Appendix 4 for more detail on this pollutant),1,3-butadiene, chromium VI (see Appendix 4 for more detailon this pollutant), benzene, ethylene dibromide, formaldehyde,and acrylonitrile - pose an unacceptable <strong>in</strong>creased cancer risk.In addition, it was concluded th<strong>at</strong> five substances -- 1,3-butadience(reproductive effects <strong>in</strong> addition to be<strong>in</strong>g a carc<strong>in</strong>ogen),formaldehyde (respir<strong>at</strong>ory effects), acrole<strong>in</strong> (respir<strong>at</strong>oryeffects), chlor<strong>in</strong>e (respir<strong>at</strong>ory effects), hexamethylene diisocyan<strong>at</strong>e(pulmonary and respir<strong>at</strong>ory effects). -- are present <strong>at</strong>ambient concentr<strong>at</strong>ions th<strong>at</strong> represent an unacceptable<strong>in</strong>creased risk for chronic disease <strong>in</strong> <strong>Houston</strong>.The evidence is not as strong but nevertheless persuasiveth<strong>at</strong> an additional 9 air pollutants are likely to pose unacceptablehealth risks <strong>at</strong> concentr<strong>at</strong>ions measured or modeled<strong>in</strong> <strong>Houston</strong> air. These substances were design<strong>at</strong>ed as“Probable Risks,” and <strong>in</strong>cluded eight carc<strong>in</strong>ogens - v<strong>in</strong>yl chloride,acetaldehyde, ethylene dichloride, naphthalene, arseniccompounds, carbon tetrachloride, ethylene oxide, 1,1,2,2-tetrachloroethane- and one pollutant - acrylic acid - th<strong>at</strong> has chronicnon-cancer effects. These are shown <strong>in</strong> Table 2 on pg. 14.13
- Page 1 and 2: A Closer Look at Air Pollution in H
- Page 3 and 4: A Closer Look at Air Pollution in H
- Page 5 and 6: Task Force MembersResearch StaffKen
- Page 7 and 8: AcknowledgementsThe Task Force woul
- Page 10: Just because a task is difficult, h
- Page 13: ing, and route of exposure, and oth
- Page 17 and 18: accurately from death certificates.
- Page 19 and 20: assessments, and monitoring data fr
- Page 21 and 22: The reality is that, even at simila
- Page 23 and 24: ability, have inadequate means to c
- Page 25 and 26: Houston reaches $21,701. These are
- Page 27 and 28: In summary, we view the comparative
- Page 29 and 30: AppendicesPhoto by Heidi Bethel27
- Page 31 and 32: Photo by Heidi Bethelgrouping to a
- Page 33 and 34: Appendix 2the time period is repres
- Page 35 and 36: Appendix 3an appreciable risk of ad
- Page 37 and 38: Table A3.1. Health Values and Refer
- Page 39 and 40: Table A3.1. Health Values and Refer
- Page 41 and 42: Table A3.1. Health Values and Refer
- Page 43 and 44: Appendix 4Metals, Diesel PM Convers
- Page 45 and 46: Under advice from staff at the U.S.
- Page 47 and 48: Appendix 5Table A5.1. Uncertain Ris
- Page 49 and 50: Appendix 6Brief Descriptions of Hea
- Page 51 and 52: Appendix 7Summary Map and Table for
- Page 53 and 54: Appendix 8: Table 1Supplemental Tab
- Page 55 and 56: Appendix 8: Table 3Table A8.3. Poss
- Page 57 and 58: ReferencesHackett, P., Sikov, M., &