view / download the documents. - til india
view / download the documents. - til india
view / download the documents. - til india

You also want an ePaper? Increase the reach of your titles
YUMPU automatically turns print PDFs into web optimized ePapers that Google loves.
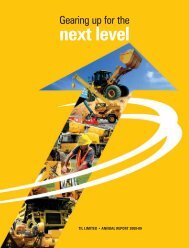
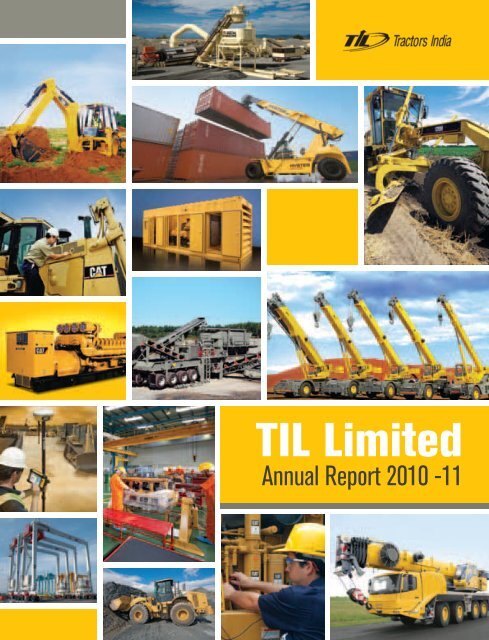
TIL LimitedAnnual Report 2010 -11
Forward Looking StatementIn this Annual Report, <strong>the</strong> forward-looking information if any, is for enabling investors to comprehend our prospects and take informed investment decisions.This report and o<strong>the</strong>r statements - written and oral - that we periodically make contain forward-looking statements that set out anticipated results based on <strong>the</strong>management’s plans and assumptions. We have tried, wherever possible to identify such statements by using words such as ‘anticipate’, ‘estimate’, ‘expects’,‘projects’, ‘intends’, ‘plans’, ‘believes’, and words of similar substance in connection with any discussion of future performance.We cannot guarantee that <strong>the</strong>se forward-looking statements will be realized, although we believe we have been prudent in assumptions. The achievement ofresults is subject to risks, uncertainties and even inaccuracies in our assumptions. Should known or unknown risks or our uncertainties materialize, or shouldunderlying assumptions prove inaccurate, actual results could vary materially from those anticipated, estimated or projected.We undertake no obligation to publicly update any forward-looking statements, arising as a result of new information, future events or o<strong>the</strong>rwise.ContentsCorporate Information 1 | Corporate Identity 2 | Financial Highlights 10 | Chairman’s Insight 12 |Vice Chairman & Managing Director’s Message 14 | Divisional Re<strong>view</strong> 18 | Finance Re<strong>view</strong> 24 |Directors’ Report 26 | Management Discussion & Analysis 32 | Corporate Governance Report 38 |Financial Section 49
Annual Report 2010-11CorporateinformationAUDITORSPrice WaterhouseBANKERSBank of IndiaBOARD OF DIRECTORSMr. A. MazumdarChairmanMr. Sumit MazumderVice Chairman and Managing DirectorMr. S. K. BhatnagarDirector and PresidentMr. R. L. GaggarSolicitor and AdvocateMr. U. V. RaoFormer Chief Executive and Managing Director - L&T LimitedMr. G. SwarupManaging Director of Paharpur Cooling Towers LimitedDr. T. MukherjeeFormer Dy. Managing Director of TATA Steel LimitedMr. K. B. SahaNominee of Life Insurance Corporation of IndiaCOMPANY SECRETARYMr. Sekhar BhattacharjeeUnion Bank of IndiaING Vysya Bank Ltd.State Bank of Bikaner & JaipurState Bank of IndiaState Bank of HyderabadAxis Bank Ltd.CITI Bank N.A.REGISTERED OFFICE1, Taratolla RoadGarden ReachKolkata 700 024Telephone: (033) 2469 3732 - 36 (5 Lines)(033) 6633 2000 / 2845E-mail: secretarial.department@<strong>til</strong><strong>india</strong>.comREGISTRAR AND SHARE TRANSFER AGENTC B Management Services (P) LimitedP-22, Bondel Road, Kolkata 700 019Telephone: (033) 4011 6700 / 4011 6711 / 4011 6718E-mail: rta@cbmsl.com
2TIL at a glanceCorporate IdentityTIL’s corporate journey spanning over 67 years is woven withchallenges, achievements, resilience, aspirations, and enterprise.Throughout this journey of corporate excellence, TIL has remainedcommitted to India’s infrastructure build by providing hightechnology products and total solutions for its customers creatinga positive difference in <strong>the</strong> space it operates.As a responsible, valued and respected organization, TIL attributesmuch of its success and growth to <strong>the</strong> quality and commitment of closeto 1900 employees across 85 locations pan India.Our Vision provides <strong>the</strong> direction and aspiration to move forward in ourcorporate journey; and bonded by our Values at work, Team TILrelentlessly demonstrates a passion for innovation and actions that arecustomer-driven. Spread across India and <strong>the</strong> subsidiaries, <strong>the</strong> goal of <strong>the</strong>Company is one - to make customers more profitable.
Over<strong>view</strong> Performance Re<strong>view</strong>s Governance Financials3Annual Report 2010-11BusinessTIL is in <strong>the</strong> business of serving <strong>the</strong> infrastructure progress of <strong>the</strong> nation withits end to end solutions, comprising a broad portfolio of products, technologiesand world-class brand alliances along with a wide array of value addedservices.TIL operates through its Material Handling Solutions division, Equipment &Project Solutions division and <strong>the</strong> wholly owned subsidiary - Tractors IndiaPvt. Ltd. (TIPL) for North and East of India and Bhutan, as well as overseassubsidiaries in Nepal (TNPL), Myanmar (MTL) and Singapore (TILO).The Material Handling Solutions (MHS) division is engaged in design,manufacture and marketing of a comprehensive range of materialhandling, lifting, port and road building solutions with integrated customersupport and after-sales service. The newly formed Equipment & ProjectSolutions (EPS) vertical focuses on providing ‘single-window’ solutions incrushing & screening, and offering innovative and eco-friendly asphalt mixtechnology for road construction. The EPS vertical also manufactures andsupplies container handling equipment for Ports.Manufacturing and technical collaborations are with Manitowoc CraneGroup, USA, Grove Worldwide USA, Potain [a part of Manitowoc – USA], AstecInc., Hyster [a part of NMHG – USA], Paceco Corp – USA [a part of MitsuiEngineering and Shipbuilding - Japan], FAMAK S.A – Poland and Mitsui MiikeMachinery Co. Ltd. [a part of <strong>the</strong> Mitsui Group – Japan].The Construction, Mining and Power Systems Solutions(CMS & PSS) divisions operate under <strong>the</strong> wholly owned subsidiary TIPL - as<strong>the</strong> exclusive dealer for Caterpillar range of products across North and East ofIndia as well as Bhutan. TIPL has also entered into association with SEM formedium wheel loaders and SITECH for GPS based connected site solutions.The Company brings <strong>the</strong> global concept of providing Equipment on Rent forconstruction, mining and power applications with one stop Rental Storesin Sahibabad, Bhubaneswar, Asansol, Lucknow, Udaipur, and Chandigarh.Also on offer is a wide variety of Used Equipment and Allied products rolledout from <strong>the</strong> Company’s Rental fleet providing affordability coupled withunmatched product support.The technologically superior products are complemented with servicesthat provide customers with solutions to meet <strong>the</strong>ir business-critical needs,helping <strong>the</strong>m to become more sustainable and profitable. The solutionsoffered by <strong>the</strong> Company increase productivity, improve operator comfort,meet environmental regulations, provide a longer life, and lower cost perunit of work done.TIL recognizes <strong>the</strong> value of training and capability development and <strong>the</strong>impact it has on improving performance. The Company remains committedtowards attuning talent and capabilities of its people through continuoustraining and development initiatives.The various 6 Sigma initiatives adopted by TIL in order to improve businessprocess have resulted in growth benefits, cost savings, effectiveness andquality improvements.Corporate Social Responsibility continues to be an integral part of TIL’sVision. As an organization, TIL is committed in its responsibility towardssociety, community and environment. Whe<strong>the</strong>r it’s caring for <strong>the</strong> safety ofour fellow employees, improving <strong>the</strong> communities in which we live and work,or sustaining <strong>the</strong> environment we all share, TIL is relentlessly engaged ingood corporate citizenship.TILMHS & EPSSubsidiariesTIPLTNPL TILO MTLCaterpillarCMS & PSSSEMSITECH
4ProductsVersa<strong>til</strong>e products for every application and a rangethat delivers maximum performance and productivityMaterial Handling Solutions (MHS)Rough Terrain CranesTruck Cranes Lorry Loaders Truck Mounted CranesCrawler Cranes Tower Cranes All Terrain CranesReach Stackers Big Forklift Trucks Container Handlers
Over<strong>view</strong> Performance Re<strong>view</strong>s Governance Financials5Annual Report 2010-11Equipment & Project Solutions (EPS)High Frequency ScreensStationary Plants Track Plants Portable PlantsHot Mix Double Barrel Asphalt Plants RTG Cranes Road HeadersELL Cranes Mechanical Drive Chain Trenchers Horizontal Directional Drills
6Construction &Mining Solutions (CMS)Hydraulic ExcavatorsBackhoe Loaders Wheel Loaders Off-Highway TrucksTrack-Type Tractors Asphalt Pavers Vibratory Soil CompactorsAsphalt Compactors Motor Graders Wheel Dozers
Over<strong>view</strong> Performance Re<strong>view</strong>s Governance Financials7Annual Report 2010-11Power Systems Solutions (PSS)C175 Diesel Generator SetsC9 ACERT Engines 3512 B EnginesC32 ACERT Diesel Engines G 3306 Gas EnginesAlliedAssociationsSITECH Technology SolutionsSEM Wheel LoadersAllmand Lighting Towers
8Total solutionsProduct support and services provided by TILadd value and contribute to customers’ business successBrandsGlobal alliances are with <strong>the</strong> mosttrusted names in <strong>the</strong> worldPre–purchase ConsultancyEquipment Investment Analysis24x7 Field Service ManagementScheduled Oil Sampling (S•O•S SM ) ServicesComponent Repair & Complete Machine RebuildsRental & Used Equipment SolutionsCustomer Support Agreements (CSA) &Maintenance and Repair Contract (MARC)Maintenance and OperatorTraining for Customers
Over<strong>view</strong> Performance Re<strong>view</strong>s Governance Financials9Annual Report 2010-11User industriesServing <strong>the</strong> entire gamut of infra spaceGeneral & Heavy ConstructionMining Agro Industries PowerPort & Airports Railways Oil & PetrochemicalsDefense Retail & Hospitality Health & Pharma
10Our numbersTotal revenue(` in lacs)EBIDTA(` in lacs)140,28112,67113,086109,594107,353107,9899,52510,4612007-082008-092009-102010-112007-082008-092009-102010-11PBT(` in lacs)PAT(` in lacs)9,0066,5696,5304,3104,4725,9536,0192007-082008-092009-102010-112007-082008-092009-102010-11
Over<strong>view</strong> Performance Re<strong>view</strong>s Governance Financials11Annual Report 2010-11ROCE (%)Earnings per share(`)30252759.3560.011944.2844.592007-082008-092009-102010-112007-082008-092009-102010-11Debtor cycle(days)TOL/TNW(times)56501.721.7943381.351.312007-082008-092009-102010-112007-082008-092009-102010-11
12Chairman’sinsightDear Shareholders,It gives me great pleasure to present <strong>the</strong> annual reportof your Company for <strong>the</strong> financial year 2010-11.The Indian economy for <strong>the</strong> year under re<strong>view</strong> has fallen short of <strong>the</strong> growth projections and <strong>the</strong>Five Year Plan outlay could not be achieved. The basics, however, are in place and <strong>the</strong> long-termoutlook remains positive. Our country along with o<strong>the</strong>r rapidly growing economies will be a keyplayer in <strong>the</strong> global revival, creating opportunities for investments, technologies and businessalliances across all major sectors. The interest and confidence India continues to receive globallyfur<strong>the</strong>r confirms this.The concern for your Company has been <strong>the</strong> inconsistent infrastructuredevelopment expenditure. Slow down in infrastructure development will bea major barrier to an inclusive socio-economic growth. There is no alternativeto significant investments and sustained government focus. Considering <strong>the</strong>infrastructure building required, India will have to accelerate her efforts toeffectively translate today’s potential into tomorrow’s reality.The Government of India’s thrust on <strong>the</strong> infrastructure segments shouldaccelerate with domestic demands and rapid urbanization being <strong>the</strong>key growth drivers. This in turn will result in growth in <strong>the</strong> earthmoving,construction, mining equipment and o<strong>the</strong>r infrastructure sectors whereTIL has a significant presence.Technology, Innovation and Leadership continue to be <strong>the</strong> mainstay of yourCompany’s growth imperatives in line with <strong>the</strong> changing business realities.Last year your Company took various strategic measures and initiativesto become a cohesive and customer-centric organization. There were newproduct introductions, capacity expansions, addition of new facilities andbranches, people development, and innovation in our solution offerings.These were all done to take customer engagement to greater heights.People development has become <strong>the</strong> single most important activity at TIL.Appropriately called ‘People Priority’, an HR initiative is fast changing ourmanagerial capability and customer engagement levels. Your Company hasalso formulated a formidable knowledge resource development plan tocreate a leadership pipeline <strong>til</strong>l 2015. The ongoing learning and traininginitiatives have been designed to drive organizational excellence and attainmulti-fold growth in <strong>the</strong> short to medium term. Because of <strong>the</strong> expectedrapid growth in our opportunities we have also created a ‘bench strength’ oftechnical and service personnel, who are fur<strong>the</strong>r trained on <strong>the</strong> job <strong>til</strong>l <strong>the</strong>yhave specific assignments.
Over<strong>view</strong> Performance Re<strong>view</strong>s Governance Financials13Annual Report 2010-11Since inception, TIL hasalways been a value-drivenorganization. Your Company’sreputation is one of its greatestassets that is founded on <strong>the</strong>pillars of trust, transparencyand talent. Your Companycontinues to be driven byvalues, ethics, integrity andcustomer-centricity.Since inception, TIL has always been a value-driven organization. YourCompany’s reputation is one of its greatest assets that is founded on <strong>the</strong>pillars of trust, transparency and talent. Your Company continues to bedriven by values, ethics, integrity and customer-centricity. These tenetsinspire each and every member of <strong>the</strong> TIL family to make customersmore profitable and enable your Company to elevate to <strong>the</strong> next level ofgrowth. Your Company is also committed in its role as a socially responsiblecorporate and has initiated many steps to create value through economic,environmental and social integration.Future readiness is <strong>the</strong> spirit at TIL. People in your Companyare united in <strong>the</strong>ir passion for excellence and determination to streng<strong>the</strong>nbrand TIL. Your Company remains committed to continue serving <strong>the</strong> nationas it has been doing for <strong>the</strong> last 67 years and grow market presence bybeing <strong>the</strong> Total Solutions Provider. Our commitment to greater customerengagement will help carve a larger portion of <strong>the</strong> expected growingopportunities.This will fur<strong>the</strong>r accelerate <strong>the</strong> pace of growth and streng<strong>the</strong>n our positionas a significant player in <strong>the</strong> infrastructure space, <strong>the</strong>reby maximizingshareholder value.On behalf of <strong>the</strong> Board of Directors, I thank all our employees, shareholders,customers, principals, bankers, suppliers and business associates for <strong>the</strong>ircontinued support and guidance. We treasure your trust.A MazumdarChairman
14Vice Chairman &Managing Director’s MessageThe year under re<strong>view</strong> was a challenging yet eventful year for TIL. Despite certainimpediments to socio-economic progress, including deferment in infrastructureinvestments and projects, India is expected to grow at a robust pace in <strong>the</strong> comingyears. Infrastructure clearly is <strong>the</strong> critical component for economic development andincreasing India’s global competitiveness. The macro-economic outlook for India posesgreat promise and today <strong>the</strong> world acknowledges that India is a country with highgrowth and vast opportunities.
Over<strong>view</strong> Performance Re<strong>view</strong>s Governance Financials15Annual Report 2010-11It has been a significant year for TIL in terms of <strong>the</strong> initiatives we tookto accrue better benefits in <strong>the</strong> long-term and keeping in mind <strong>the</strong> goodtimes ahead in our business space.Brand India, under <strong>the</strong> Twelfth Five Year Plan will be driven by demographicadvantage and investment in infrastructure, fur<strong>the</strong>r streng<strong>the</strong>ned by a youngpopulation. It is no longer a question of whe<strong>the</strong>r, but more of when! In <strong>the</strong>infrastructure space in which your Company operates, <strong>the</strong> growth drivers for2011-12 will be <strong>the</strong> rising demand in domestic markets coupled with rapidurbanization. As India moves towards inclusive growth, we will also start seeingmore and more infrastructure investments being made in rural India.SETTING THE PACEThis year’s emphasis has been on organizational realignment, to enhancestrategic focus in our manufacturing business and to reinforce our commitmentto service excellence. In addition, <strong>the</strong> focus on people development to evolveinto a business model with <strong>the</strong> customer at its core remains our strategicimperative.The transfer of <strong>the</strong> Caterpillar dealership of Construction, Mining and PowerSystems Solutions to Tractors India Private Limited (TIPL) - <strong>the</strong> wholly ownedsubsidiary was done to enhance customer-centricity and widen coverageacross existing as well as emerging markets. Along with <strong>the</strong> realignment,<strong>the</strong>re have been o<strong>the</strong>r major investments for <strong>the</strong> future for better organizationalpreparedness and to leverage <strong>the</strong> ensuing boom time. The organizationalrealignment and o<strong>the</strong>r strategic investments both in terms of facilities andpeople impacted your Company’s profitability.On a consolidated basis, <strong>the</strong> total income (including o<strong>the</strong>r income) stood at` 1,402.81 crores in 2010-11, compared to ` 1,079.89 crores in 2009-10and profit before tax stood at ` 90.06 crores, compared to ` 91.36 croresin <strong>the</strong> previous year. Despite a positive top line growth of 30 per cent,your Company’s profit was almost <strong>the</strong> same as last year primarily due to<strong>the</strong> investments and initiatives carried out to fur<strong>the</strong>r optimize <strong>the</strong> marketopportunities, and be ready for <strong>the</strong> large projects which should happen in <strong>the</strong>near future. The management priority of your Company is to prepare for <strong>the</strong>coming years, and for us <strong>the</strong>se proactive actions are deemed ‘Investment’ra<strong>the</strong>r than ‘Cost’.TODAY’S BUSINESSIt has been a significant year for TIL in terms of <strong>the</strong> initiatives we took toaccrue better benefits in <strong>the</strong> long-term and keeping in mind <strong>the</strong> good timesahead in our business space. New product launch, new collaborations, focuson Rental & Used Equipment and enhancing our market coverage are someworth mentioning. Many new facilities were opened and some upgraded duringthis period. We laid special emphasis on investing in people both in terms ofrecruitment and capability development. We are cognizant of <strong>the</strong> fact thatachieving visible and sustainable improvement in performance is a long-termgoal. It is just a matter of time before your Company reaps higher return-on-‘people-investment’. This will enable TIL to capitalize on new opportunities andbecome a more customer–driven organization.MATERIAL HANDLING SOLUTIONSFor quite some time, diversification has been <strong>the</strong> overriding focus at TIL -diversification through strategic alliances and knowledge acquisition fromglobally acclaimed industry players. We have launched a series of products thatinclude a 10 MT Truck Mounted Slew crane and indigenously designed and built75 MT Truck Mounted crane. Our product range offers a superior alternative
16The opportunities for broadening <strong>the</strong> horizon of tomorrow are positive and we arebuilding capacities to streng<strong>the</strong>n our sustainability.to a wide cross-section of Indian customers. Besides continuously evolving,changing, and innovating to combat <strong>the</strong> ever increasing competition, we arealso developing a strategy to counter <strong>the</strong> advent of used cranes coming intoour country.It has been our mantra to continuously upgrade, differentiate and offer <strong>the</strong> bestvalue proposition and under <strong>the</strong> Accelerated Improvement Program (AIP), wehave revamped our production system, re-engineered processes and invested instate-of-<strong>the</strong>-art machinery. These initiatives cumulatively helped us to reduceour manufacturing cost substantially without compromising on our qualitystandards. Fur<strong>the</strong>rmore, our indigenously designed and manufacturedTMS 875 in a brief span of 90 days reflects our design and manufacturingprowess. Going forward, we will focus on extending our crane portfolio to caterto diverse customer requirements.CONSTRUCTION & MINING SOLUTIONSMajor investments in terms of facilities, both new and up-gradation, wereundertaken during <strong>the</strong> year under re<strong>view</strong>. This was <strong>the</strong> year which perhapshad <strong>the</strong> largest recruitment of technicians in a single financial year. Techniciantraining, being very comprehensive and intensive, takes many months before<strong>the</strong>y start functioning independently. An investment, we believe, which besidesgiving rich dividends in future is also essential to our business.Although <strong>the</strong>re has been a slow down in <strong>the</strong> roads and highways sector, but wewere able to finalize some orders for mining applications. One of <strong>the</strong> contractsis for a green field project in <strong>the</strong> private sector, amongst <strong>the</strong> few that hasbeen finalized in recent times. We have also been successful in securing someprestigious Maintenance & Repair Contracts (MARC) which will add appreciablevalue in fur<strong>the</strong>r streng<strong>the</strong>ning customer loyalty.POWER SYSTEMS SOLUTIONSWe have also re-classified Power Systems Solutions division into four verticals(EP Diesel, EP Gas, Petroleum, and Industrial & OEM). This will enhanceour focus on <strong>the</strong> particular business segment and streamline operationsconsiderably.In <strong>the</strong> Power Systems business, <strong>the</strong> Petroleum product support team won‘Platinum’ honor from Caterpillar, signifying unflagging zest of our people to aimhigh and achieve higher.RENTAL & USED EQUIPMENTOur Rental business for power performed satisfactorily, and during <strong>the</strong> year,TIPL was amongst <strong>the</strong> top in Caterpillar Asia Pacific Dealership. In comparison,machinery rental s<strong>til</strong>l poses challenges for us.ENHANCING OUR KNOWLEDGE RESOURCESOur training programs all center around technology and effective response.The emphasis is on knowledge and capability enhancement through varioustraining programs and learning activities. We extensively use well testedmodules of our Principals and Technology Partners. Many of <strong>the</strong> coursesare held at <strong>the</strong>ir facilities and conducted by <strong>the</strong>ir faculty. Our own traininginstructors conduct courses in batches almost on a daily basis. We also usespecialized institutions, based on <strong>the</strong>ir expertise and our requirements.This has added significant value in 2010-11 – helping us in augmenting ourperformance–driven approach and building lasting business partnerships.Three of TIPL instructors were <strong>the</strong> first to be awarded <strong>the</strong>Accredited Instructors’ Certificate in Asia Pacific under Caterpillar InstructorAccreditation Program (CIAP). This is a significant achievement for TIPL
Over<strong>view</strong> Performance Re<strong>view</strong>s Governance Financials17Annual Report 2010-11in streng<strong>the</strong>ning its value stream. We also inaugurated our first TechnicianDevelopment and Assessment Center in Asansol, West Bengal. These measureshave helped us streng<strong>the</strong>n our capability in step with <strong>the</strong> global trend,extend our reach and quality, and reinforce TIL brand value across <strong>the</strong> wideinfrastructure spectrum.TOMORROW’S PROSPECTSThe opportunities for broadening <strong>the</strong> horizon of tomorrow are positive andwe are building capacities to streng<strong>the</strong>n our sustainability. TIL’s upcomingKharagpur facility will manufacture a diverse range of products for constructionand road building, which would include double barrel hot mix asphalt plant,aggregate crushers & screens. These will be manufactured in technicalcollaboration with Astec Inc. - a global leader of aggregate processing,asphalt road building and pipeline and u<strong>til</strong>ity trenching.Our Equipment & Project Solutions (EPS) vertical started functioning in 2010with a focus on creating a ‘single-window’ solution in crushing & screening, andproviding innovative and unique asphalt mix technology for road construction.The Equipment & Project Solutions vertical is well poised to become a majorplayer in a span of few years. The EPS vertical has also ventured into adealership agreement with Mitsui Miike Machinery Company Limited (MMMCL)to market <strong>the</strong>ir Road Headers in India. This tie-up is aimed at expanding andsynergizing our existing product portfolio, catering to <strong>the</strong> road tunneling androad construction segments.Through our realigned organizational structure under TIPL, we will continue toenhance <strong>the</strong> efficiency of our business operations fur<strong>the</strong>r and be closer to ourcustomers with enhanced personalized focus, intensified coverage and quickerresponse time, spread across four territories in North and East of India. Thestrategic direction of TIL and TIPL will be to drive <strong>the</strong> business forward andfur<strong>the</strong>r establish your Company as a Total Solutions Provider. Our aim is to offerend to end solutions to customers, ‘whenever, wherever’.In <strong>the</strong> domestic infrastructure sector, every day brings fresh opportunities togrow, think differently for better productivity and extend greater value to <strong>the</strong>customer. The objective is to forge enduring bonds with customers and to make<strong>the</strong>ir businesses more profitable.PEOPLE AT THE CORETIL has emerged as a richly diversified and stronger organization, becauseof its people. We have commenced multiple training initiatives to upgrade<strong>the</strong> skills of our people across hierarchies in line with global standards andmeet <strong>the</strong> expanded needs of our customers. Launch of Technical Training andAssessment Center aimed at developing our sales and service professionalsto sell <strong>the</strong> right solution will enhance customer experience. Through ourleadership development programs such as ‘ASCENT’ we ensure that our peopleare motivated for optimum performance levels and continue to be <strong>the</strong> cornerstone of TIL’s success.CREATING STAKEHOLDER VALUETIL is all set to move ahead into new orbits of growth and create sustainable,long-term shareholder value over <strong>the</strong> coming years. The continued confidenceof our valued shareholders, customers, principals, suppliers, bankers and o<strong>the</strong>rpartners will help us to emerge as an agile, adapting and a stronger team inIndia’s promising infrastructure sector.Sumit MazumderVice Chairman & Managing Director
18Material HandlingSolutions (MHS)Revenues - ` 20,686 lacsOrder book - ` 4,540 lacsCapital employed - ` 26,901 lacsFigures pertaining to 2010-11BRIEF OVERVIEWThe Material Handling Solutions division of TIL designs,manufactures and markets a comprehensive range ofequipment for material handling, lifting, port and road buildingsolutions with integrated customer support and after-sales service.Over <strong>the</strong> years, TIL has emerged as <strong>the</strong> foremost Material HandlingEquipment manufacturer and cutting-edge service provider withover 60 per cent market share in mobile crane segment. Itsequipment range is recognized as state-of-<strong>the</strong>-art, and sets <strong>the</strong>industry standard for quality, durability and value. The Company’sfully-integrated plant at Kolkata is <strong>the</strong> only purpose-built mobilecrane manufacturing facility in India that possesses modern andfully equipped machine shop with latest CNC - plasma cuttingmachines, fabrication and assembly shop, capable of buildingstructures that can withstand a load up to 100 MT. The Research& Development center is equipped with <strong>the</strong> latest software,enabling <strong>the</strong> division to provide superior products at a competitiveprice. It is certified under ISO 9001: 2000, reinforcing <strong>the</strong> division’scommitment to excellence.During <strong>the</strong> year, <strong>the</strong> division formed a new vertical,Equipment & Project Solutions (EPS) to focus on providingcrushing & screening solutions as well as modern, innovativeand eco-friendly technology for mixing asphalt used in roadconstruction.Key highlights of 2010-11Designed, manufactured and launched TMS 875, a 75 MT TruckMounted crane in India in a record period of 90 daysReceived an order for <strong>the</strong> 400 MT Manitowoc Crawler crane usedin wind power generation, <strong>the</strong> first of its kind in IndiaSecured <strong>the</strong> highest export order <strong>til</strong>l date for cranes worth` 15.39 crores from RITES, a Government of India EnterpriseReceived an export order from Mitsui, Japan for RTG componentsReceived <strong>the</strong> first order of 40 MT Hyster Forklift fromJindal Steel WorksSecured <strong>the</strong> first order of Potain Tower crane from Guwahati, thusopening up <strong>the</strong> Nor<strong>the</strong>ast Indian market for tower cranes
Over<strong>view</strong> Performance Re<strong>view</strong>s Governance Financials19Annual Report 2010-11StrengthsManufacturing and design excellenceStrategic partnerships with global brandsIntegrated product and service supportExperienced and technically qualified professionalsExperience spanning 67 yearsSingle largest manufacturer of slew cranes in IndiaAssociations with globally recognized brands, patented and innovativetechnology, differentiated customer support and pan-India networkrepresent <strong>the</strong> divisions’ key USPsConsiderable improvement accrued through 6 Sigma initiatives andAccelerated Improvement Program (AIP)As a result of <strong>the</strong> training and development initiatives undertaken,and safety measures adopted at <strong>the</strong> facilities, <strong>the</strong>re were noindustrial disputes and critical accidents during <strong>the</strong> yearSignificant progress at <strong>the</strong> Kharagpur site. Plant expected to becommissioned in <strong>the</strong> middle of 2011-12Equipment & Project Solutions (EPS) conducted various customerawareness programs on <strong>the</strong> Hot Mix Plant and <strong>the</strong> use of RecycledAsphalt Pavement (RAP)Specific approval obtained from <strong>the</strong> National Highways Authority ofIndia (NHAI) for use of Double Barrel Drum Mix which is a patentedtechnology of Astec for NHAI ProjectsStrategies and Future PlansOptimally leverage <strong>the</strong> opportunities available in <strong>the</strong> defenseconstruction, power, port and mining segmentsImprove market leadership of mobile cranes across all <strong>the</strong> industriesWiden <strong>the</strong> Truck Mounted crane rangeLaunched <strong>the</strong> 45 MT Rough Terrain crane and 12 MT Industrial craneIncrease customer coverageAttain cost leadership through AIPIncrease market share in Reach Stacker category by effective brandbuilding of Hyster Reach StackerPromote used/refurbished cranesExplore possibilities to enter Rental marketEmerge as a major player in EPS vertical by offering innovativeproducts, global brands and differentiated customer support
20Construction &Mining Solutions(CMS)Revenues - ` 65,451 lacsRevenue share (in TIPL) - 72 %Order book - ` 3,880 lacsCapital employed - ` 20,156 lacsFigures pertaining to 2010-11BRIEF OVERVIEWThe Construction & Mining Solutions division operates underTIPL - a wholly owned subsidiary of TIL. The division is <strong>the</strong>exclusive dealer for Caterpillar products across North andEast of India and Bhutan, providing a comprehensive rangeof Construction, Earthmoving and Mining Equipment, completewith product support and customized solutions. With a widenetwork of branches, <strong>the</strong> products and services delivered by<strong>the</strong> CMS division signify quality and long-term value.Key Highlights of 2010-11Achieved record sales in Wheel Loaders and Motor GradersSecured order for 33 Nos. CAT 773D Rear Dumpers, with a 7 yearMaintenance & Repair Contract (MARC) from BCCLReceived order for 27 Nos. CAT 777D Rear Dumpers and 8 Nos. CATD9R Track-Type Tractors, with a 10 year MARC from BCML, a part ofAditya Birla groupSecured order from SAIL - RMD for supply of 7 Nos. CAT 777DRear Dumpers, along with a contract for Spare Parts CAP for 4years/16000 hoursTraining imparted to 1395 customer operatorsContinued people development and technical training initiatives likeDPC, TCDP, CIAP and ABCHonored with <strong>the</strong> “Excellence in Customer Focus Award” for SEM
Over<strong>view</strong> Performance Re<strong>view</strong>s Governance Financials21Annual Report 2010-11StrengthsThe brand strength of Caterpillar – <strong>the</strong> global market leaderRich credential and legacy for 67 yearsA product virtually for every applicationA one-stop-shop offering total solutions – new equipment, rental& used equipment, parts with excellent product support and servicesolutions. Innovative Solutions like equipment on Rent, and resourceslike Customer Support Agreements [CSA], Maintenance & RepairContract [MARC], Component Rebuilds and Scheduled Oil Sampling[SOS] fluid analysis services add immense value to customers’operation and contribute to <strong>the</strong>ir successEnhanced penetration of <strong>the</strong> dealership business across four territoriesin India and wider geographical reachA satisfied customer baseFocused training, development and empowerment initiatives forcontinuous developmentA state-of-<strong>the</strong>-art Component Rebuild Center (CRC) at Asansol,West Bengal to provide world-class rebuilding servicesExtended allied dealership solutions (SEM and SITECH) and technologysolutions to meet customer product and price point requirementsStrategies and Future PlansStrive towards better customer service and profitable growth inmarket share, with <strong>the</strong> recent formation of four territorial dealershipsAdopt new technologies, configurations and service arrangementsto meet customer requirementsDevelop an efficient supply chainEnhance <strong>the</strong> product support capabilitiesContinuously invest in training and development initiativesFocus on <strong>the</strong> retail businessExpand market reach and have maximum footprint in <strong>the</strong> industryAccelerate <strong>the</strong> customer response timeDevelop Rental & Used Equipment business in <strong>the</strong> fast maturingrental marketsFur<strong>the</strong>r consolidate <strong>the</strong> allied dealerships of SEM and SITECHProvide customers with end to end solutions
22Revenues - ` 25,045 lacsPower SystemsSolutions (PSS)Revenue share (in TIPL) - 28 %Order book - ` 8,400 lacsCapital employed - ` 10,810 lacsFigures pertaining to 2010-11BRIEF OVERVIEWThe Power Systems Solutions division operating under TIPLis an exclusive dealer for Caterpillar range of engines andgenerator sets across North and East of India, as well asBhutan. The Power Systems business has been classified intofour verticals:EP DieselEP GasPetroleumIndustrial & OEM
Over<strong>view</strong> Performance Re<strong>view</strong>s Governance Financials23Annual Report 2010-11Key Highlights of 2010-11Rated amongst <strong>the</strong> top three Caterpillar dealers in Asia Pacific forretail rental businessAchieved multi-sectoral breakthroughs comprising Agriculture,Cement, Plantation, Real Estate and AutomotivesSupplied 29 Nos. DG sets of 2000 kVA and 8 Nos. DG sets of 1500 kVADeployed 30 Nos. Engines of 320/500 kVA on a rental basis for aresidential constructionThe Petroleum Product Support Team received <strong>the</strong> highest ratingfrom <strong>the</strong> Global Petroleum Service Assessment (GPSA) launched byCaterpillar Global PetroleumStrengthsRange and product diversity - world-class Caterpillar products withlow life-cycle costVaried product applications across a wider bandwidth of sectorsOne single source with focused customer support and round-<strong>the</strong>-clockresponse to customers’ needsA strong public sector customer baseFlexibility to work with diesel engines, gas engines, mechanical aswell as electrical drivesStrong customer trust in <strong>the</strong> division’s after-sales supportThe products have world-class quality and low life-cyclecost and enjoy excellent customer acceptance, due to<strong>the</strong> hallmark of reliability and quality power. The division alsoprovides single source of complete power solutions, applicationengineering, feasibility studies, supply chain management,on-site installation services and uninterrupted productavailability through on-site support and maintenance.Strategies and Future PlansImprove market share across all <strong>the</strong> industries servedPenetrate newer marketsContinuously invest in training and development initiativesInvest in infrastructure by setting up new officesConsolidate <strong>the</strong> opportunities available in Power SystemsAggressively grow <strong>the</strong> OEM business and <strong>the</strong> rental businessFocus on <strong>the</strong> CNG/CGD sectors, offering good growth opportunities
24FinanceRe<strong>view</strong>Highlights of <strong>the</strong> consolidated financial statementTotal income increased from ` 107,989 lacs in 2009-10 to ` 140,281 lacs in 2010-11, registering an increase of 30 per centEBIDTA grew from ` 12,671 lacs in 2009-10 to ` 13,086 lacs in 2010-11Profit Before Tax declined marginally from ` 9,136 lacs in 2009-10 to ` 9,006 lacs in 2010-11Profit After Tax increased marginally from ` 5,953 lacs in 2009-10 to ` 6,019 lacs in 2010-11Proposed Dividend is maintained at 60 per centEarnings Per Share grew from ` 59.35 in 2009-10 to ` 60.01 in 2010-11Revenue analysisRevenue by business segmentsThe Company earned revenue from <strong>the</strong> following segments:(` in lacs)2010-11 2009-10SEGMENTSMaterial Handling Solutions (MHS) 20,686 16,991Construction & Mining Solutions (CMS) 84,592 64,631Power Systems Solutions (PSS) 32,780 24,705
Over<strong>view</strong> Performance Re<strong>view</strong>s Governance Financials25Annual Report 2010-11Financial ratiosTIL has maintained <strong>the</strong> current ratio of 1.31 and a TOL/TNW of 1.79.The working capital has also been efficiently managed with debtors andinventory cover at 50 days and 117 days, respectively.TIL’s interest cover is 5.48 times.Net worthThe Company’s net worth grew from ` 28,197 lacs as on 31st March, 2010to ` 33,487 lacs as on 31st March, 2011, registering a19 per cent increase.Capital expenditureIn 2010-11, <strong>the</strong> Company incurred a net capital expenditure of ` 5,569 lacstowards land for new production facility and rental assets. This is expectedto increase <strong>the</strong> rental asset base resulting in future revenue growth andexpansion of rental business.
26Directors’ReportYour Directors have pleasure in presenting <strong>the</strong> Annual Report and Accounts for <strong>the</strong> year ended 31st March, 2011.For <strong>the</strong> year ended31.03.2011(`/Crores)For <strong>the</strong> year ended31.03.20101. FINANCIAL RESULTSProfit for <strong>the</strong> year after meeting all expenses but before charging Depreciation and Interest. 48.56 108.38Less: Interest 2.39 16.00Depreciation 4.16 16.89Profit Before Tax 42.01 75.49Tax Provisiona) Current Tax 14.20 25.75b) Deferred Tax (Credit)/Charge (3.39) 2.87Profit After Tax 31.20 46.87Balance Net Profit available for appropriation 31.20 46.87AppropriationsGeneral Reserve 3.12 4.69Proposed Dividend:Equity Shares 6.02 6.02Tax on Dividend 1.00 1.00Balance Carried Forward 21.06 35.16
Over<strong>view</strong> Performance Re<strong>view</strong>s Governance Financials27Annual Report 2010-112. RESTRUCTURING OF BUSINESSWith effect from 1st April, 2010 (‘<strong>the</strong> Appointed Date’), <strong>the</strong> dealershipbusiness of Caterpillar comprising Construction and Mining Solutionsand Power Systems Solutions carried out by <strong>the</strong> Company has beende-merged as a going concern and vested in <strong>the</strong> wholly ownedsubsidiary of <strong>the</strong> Company viz., Tractors India Private Limited (‘TIPL’)pursuant to <strong>the</strong> provisions of Sections 391 to 394 of <strong>the</strong> Companies Act,1956 under a Scheme of Arrangement (‘<strong>the</strong> Scheme’) sanctioned by<strong>the</strong> Hon’ble High Court at Calcutta vide Order dated 12th July, 2010. Inaccordance with <strong>the</strong> Scheme, TIPL has issued 44,89,430 Equity Sharesof ` 10/- each at a premium of ` 203.48 on every share aggregating to` 95,83,96,000/- (Rupees Ninety Five Crores Eighty Three Lacs NinetySix Thousands only) to <strong>the</strong> Company as <strong>the</strong> Purchase Consideration.In <strong>view</strong> of <strong>the</strong> above, <strong>the</strong> financial figures of <strong>the</strong> Company for <strong>the</strong>year under re<strong>view</strong> vis-à-vis previous year are not comparable as <strong>the</strong>previous year’s figure includes <strong>the</strong> Caterpillar business which has beende-merged from <strong>the</strong> Company and vested with TIPL with effect from(w.e.f.) 1st April, 2010.3. PERFORMANCEOn a consolidated basis, your Company’s Group turnover includingIncome from Operations and O<strong>the</strong>r Income stood at ` 1402.81Crores compared to ` 1079.89 Crores in <strong>the</strong> previous year and profitbefore tax is ` 90.06 Crores compared to ` 91.36 Crores in <strong>the</strong>previous year.On standalone basis, Turnover including income from operations andO<strong>the</strong>r Income for <strong>the</strong> year under re<strong>view</strong> stood at ` 237.33 Crores vis-àvis` 887.94 Crores in <strong>the</strong> previous year. The profit before tax stood at` 42.01 Crores vis-à-vis ` 75.49 Crores in <strong>the</strong> previous year.Tractors India Private Ltd.The newly formed Wholly Owned Subsidiary Company, Tractors IndiaPvt. Ltd., in India, achieved a turnover including income from operationsand O<strong>the</strong>r Income of ` 911.10 Crores and earned a profit before tax of` 33.80 Crores.Myanmar Tractors Ltd.The Wholly Owned Subsidiary Company, Myanmar Tractors Ltd., in<strong>the</strong> Union of Myanmar, achieved a turnover including income fromoperations and O<strong>the</strong>r Income of ` 35.19 Crores compared to ` 53.06Crores in <strong>the</strong> previous year and a profit before tax of ` 3.93 Crorescompared to ` 3.79 Crores in <strong>the</strong> previous year.TIL Overseas Pte. Ltd.The Wholly Owned Subsidiary Company, TIL Overseas Pte. Ltd., inSingapore, achieved a turnover including income from operations andO<strong>the</strong>r Income of ` 237.61 Crores compared to ` 160.58 Crores in<strong>the</strong> previous year and achieved a profit before tax of ` 10.18 Crorescompared to ` 10.92 Crores in <strong>the</strong> previous year. This activity is totallyfor and on behalf of Myanmar Tractors Limited.Tractors Nepal Pvt. Ltd.The Wholly Owned Subsidiary Company, Tractors Nepal Pvt. Ltd., inNepal, achieved a turnover including income from operations andO<strong>the</strong>r Income of ` 1.76 Crores compared to previous year of ` 2.51Crores and earned a profit before tax of ` 0.32 Crores compared to` 1.37 Crores in <strong>the</strong> previous year.4. FINANCEAfter providing ` 10.81 Crores as Provision for Taxation, ` 7.02 Crores(including Dividend Tax of ` 1 Crore) distributed as Equity Dividend,` 21.06 Crores has been carried forward to Balance Sheet. The Reserve& Surplus (excluding Revaluation Reserves) of <strong>the</strong> Company increasedfrom ` 181.22 Crores to ` 205.42 Crores and <strong>the</strong> Shareholders’ Fund(excluding Revaluation Reserves) increased from ` 191.25 Crores to` 215.45 Crores.The Reports and Accounts of Subsidiary Companies are annexed tothis Report alongwith <strong>the</strong> statement pursuant to Section 212 of <strong>the</strong>Companies Act, 1956.5. DIVIDENDThe Board has recommended a Dividend @ ` 6/- on each Equity Share(Face Value of ` 10/- each) for <strong>the</strong> year under re<strong>view</strong>.6. NEW BUSINESS-EQUIPMENT & PROJECT SOLUTIONS (EPS)Your Company has already procured around 135 acres of land atChangual Industrial Park, Paschim Midnapore, West Bengal whereinconstruction and o<strong>the</strong>r work for setting up of <strong>the</strong> first phase of<strong>the</strong> manufacturing facility have already commenced. Production/manufacturing at <strong>the</strong> said phase is expected to commence inJuly, 2011.Your Company is also in <strong>the</strong> process of acquiring around 104 acresof land on long-term lease from WBIDC Ltd. at Vidyasagar IndustrialPark, Paschim Midnapore, West Bengal. The second and third phaseof <strong>the</strong> manufacturing facility for EPS business is proposed to beset up <strong>the</strong>rein.7. FIXED DEPOSITThe Company has not accepted any deposits from <strong>the</strong> public during <strong>the</strong>year. Deposit outstanding as on 31st March, 2011 including unclaimeddeposit was nil.
288. PARTICULARS OF CONSERVATION OF ENERGY, TECHNOLOGYABSORPTION, FOREIGN EXCHANGE EARNINGS AND OUTGOThe Statement pursuant to Section 217(1)(e) of <strong>the</strong> Companies Act,1956 read with Companies (Disclosure of Particulars in <strong>the</strong> Report of<strong>the</strong> Board of Directors) Rules, 1988 is given in <strong>the</strong> Annexure formingpart of this Report.9. PARTICULARS OF EMPLOYEESThe total number of employees of <strong>the</strong> Company as on 31st March, 2011was 711.Information in accordance with <strong>the</strong> provisions of Section 217(2A) of <strong>the</strong>Companies Act, 1956, read with Companies (Particulars of Employees)Rules, 1975, as amended, forms part of this Directors’ Report. However,as per <strong>the</strong> provisions of Section 219(1)(b)(iv) of <strong>the</strong> Companies Act,1956, <strong>the</strong> Report and Accounts are being sent to all Shareholders of<strong>the</strong> Company excluding <strong>the</strong> Statement of Particulars of Employeesunder Section 217(2A) of <strong>the</strong> Companies Act, 1956. Any Shareholderinterested in obtaining a copy of <strong>the</strong> said Statement may write to <strong>the</strong>Company Secretary at <strong>the</strong> Registered Office of <strong>the</strong> Company, and <strong>the</strong>same will be sent by post.10. SUBSIDIARY COMPANIESThe statement required under Section 212 of <strong>the</strong> Companies Act, 1956in respect of Subsidiary Companies is appended herewith.11. DIRECTORSMr. A. Mazumdar and Dr. T. Mukherjee retire by rotation and beingeligible offer <strong>the</strong>mselves for re-appointment. The Board recommends<strong>the</strong>ir re-appointment.12. CORPORATE GOVERNANCEIn terms of Clause 49 of <strong>the</strong> Listing Agreement with <strong>the</strong> StockExchanges, Corporate Governance Report and Auditors Certificateregarding compliance of conditions of Corporate Governance Reportare annexed herewith forming part of this Report.13. MANAGEMENT DISCUSSION AND ANALYSIS REPORTIn terms of clause 49 of <strong>the</strong> Listing Agreement with <strong>the</strong> StockExchanges, Management Discussion and Analysis Report is annexedherewith forming part of this Report.14. DIRECTORS’ RESPONSIBILITY STATEMENTPursuant to provisions of Section 217(2AA) of <strong>the</strong> Companies Act, 1956,<strong>the</strong> Directors confirm that:i) In <strong>the</strong> preparation of <strong>the</strong> annual accounts, <strong>the</strong> applicableaccounting standards have been followed along with properexplanations relating to material departures.ii)iii)iv)The Directors have selected such accounting policies and applied<strong>the</strong>m consistently and made judgments and estimates that arereasonable and prudent so as to give a true and fair <strong>view</strong> of <strong>the</strong>state of affairs of <strong>the</strong> Company at <strong>the</strong> end of <strong>the</strong> financial yearand of <strong>the</strong> profit or loss of <strong>the</strong> Company for that period.Proper and sufficient care has been taken for <strong>the</strong> maintenance ofadequate accounting records in accordance with <strong>the</strong> provisionsof <strong>the</strong> Act for safeguarding <strong>the</strong> assets of <strong>the</strong> Company and forpreventing and detecting fraud and o<strong>the</strong>r irregularities.The annual accounts have been prepared on a goingconcern basis.15. CORPORATE SOCIAL RESPONSIBILITYGood Corporate Citizenship and Corporate Social Responsibility areintegral parts of Corporate Vision of your Company. It has always been<strong>the</strong> Company’s endeavor to take an active role in minimizing harm to<strong>the</strong> natural resources we all share.Your Company has a well managed Corporate Social Responsibilitypolicy and is strongly committed towards fostering sustainabledevelopment of People, Communities and Society at large <strong>the</strong>rebyattaining overall corporate growth and enhancing Shareholder Value.As a Socially Responsible Corporate Citizen, your Company has carriedout significant Community driven development initiatives in 2010-11with several ongoing projects as mentioned below:• Providing secondary level education to <strong>the</strong> underprivilegedchildren through <strong>the</strong> Scholarship Schemes of TIL Welfare Trust.• Vocational trainings for Youth in <strong>the</strong> project sites.• Relief for <strong>the</strong> affected areas due to natural calamities.• Partnerships with community organizations like SOS Village,Kolkata and Iswar Sankalp for extending support to <strong>the</strong>lesser-fortunate women and children of society throughcharitable contributions.• Observing TIL Caring Day. Every year through a matchingcontribution scheme, your Company reaches out to <strong>the</strong> lesserprivilegedsections of <strong>the</strong> society.• Celebrating special occasions and festivals like Christmas with<strong>the</strong> deprived street children of our society.
Over<strong>view</strong> Performance Re<strong>view</strong>s Governance Financials29Annual Report 2010-11• Providing medical facilities to underprivileged senior citizens ofour society in partnership with Help Age through <strong>the</strong>ir MobileMedical Units.Your Company is committed to continue to work towards good corporatecitizenship with <strong>the</strong> existing activities as well as new initiatives infuture.16. ENVIRONMENTAs an environmentally conscious corporate citizen, your Companyhas always been pursuing initiatives to respect, preserve and protectenvironment. For instance, Contamination Control and EffluentTreatment Plant in Component Rebuild Center at Asansol has had areducing negative impact on environment. Besides, every year on <strong>the</strong>World Environment Day, your Company undertakes various initiatives tocontribute to <strong>the</strong> environment ranging from:• Sapling and tree plantation at different project sites, offices andsurrounding communities.• Celebrating World Environment Day with a <strong>view</strong> to createawareness on Environmental Concerns among children throughvarious programs.• Participating in partnership with a renowned NGO in <strong>the</strong> cleanup drive of <strong>the</strong> polluted Rabindra Sarobar area by deploymentof a CAT 424B Backhoe Loader to promote a garbage freecleaner City.Your Company shall continue to follow a focused approach towardsmaintaining a sustainable development through its continuousendeavors of making <strong>the</strong> environment and <strong>the</strong> surrounding communitiesa better place for our future generations.17. AUDITORSMessrs. Price Waterhouse, Chartered Accountants, <strong>the</strong> retiringAuditors of <strong>the</strong> Company, have informed that <strong>the</strong>y do not wish to seekre-appointment at <strong>the</strong> ensuing Annual General Meeting.In <strong>view</strong> of <strong>the</strong> above, <strong>the</strong> Board hereby recommends <strong>the</strong> appointmentof Messrs. Deloitte Haskins & Sells, Chartered Accountants, Kolkata asStatutory Auditors of <strong>the</strong> Company to hold office from <strong>the</strong> conclusion of<strong>the</strong> ensuing Annual General Meeting un<strong>til</strong> <strong>the</strong> conclusion of next AnnualGeneral Meeting.Pursuant to <strong>the</strong> provisions of Section 224 and o<strong>the</strong>r applicable provisionsof <strong>the</strong> Companies Act, 1956, <strong>the</strong> aforesaid appointment is subject to <strong>the</strong>approval of <strong>the</strong> shareholders of <strong>the</strong> Company at <strong>the</strong> ensuing AnnualGeneral Meeting.18. AUDITORS’ REPORTThe notes to <strong>the</strong> Accounts referred to in <strong>the</strong> Auditors’ Report are selfexplanatoryand, <strong>the</strong>refore, do not call for any fur<strong>the</strong>r comment underSection 217(3) of <strong>the</strong> Companies Act, 1956.19. ACKNOWLEDGEMENTSThe Board of Directors take this opportunity to thank all its valuedCustomers, Principals, Shareholders, Banks, Financial Institutions,Government Authorities and Stock Exchanges for <strong>the</strong>ir continuedco-operation and support to <strong>the</strong> Company. The Board also takesthis opportunity to express its sincere appreciation for <strong>the</strong> excellentsupport and dedicated efforts put in by <strong>the</strong> employees for continuedgood performance.For and on behalf of Board of DirectorsPlace : KolkataDate : 17th May, 2011.A. MazumdarChairman
30Annexure to Directors’ ReportInformation in accordance with Section 217(1)(e) of <strong>the</strong> Companies Act, 1956 and <strong>the</strong> Companies (Disclosure of Particulars in <strong>the</strong>Report of <strong>the</strong> Board of Directors) Rules, 1988.FORM ACONSERVATION OF ENERGYThe Company has always been conscious of <strong>the</strong> need for and significance of conservation of energy and has been steadily making progress towards this end/objective and enjoying tangible results.1. Measures taken:The Company’s manufacturing process is not energy intensive in nature and hence it is committed to conserve energy by optimal usage of this scarceresource. Energy Conservation measures have been implemented at all factories and offices, like energy efficient blowers and pumps, backward curveblowers, LED & CFL lamps, 28 W lighting with electronic ballast for office area, Low height lighting for factories etc.2. Improvements:The Company has embarked upon a system of periodic and regular monitoring of <strong>the</strong> power aspect and maintenance of all equipment, <strong>the</strong>reby conservingenergy to an advantageous level.3. Impact of (1) & (2): The outcome of <strong>the</strong>se changes has resulted in cost savings for <strong>the</strong> Company.4. Total Energy Consumption and Energy Consumption Per Unit of Production.Year ended31.03.2011*Year ended31.03.2010*A. Power and fuel consumptiona) ElectricityPurchased Units 16,12,129 17,16,033Total amount (` Lakhs) 106.11 105.70Rate Per Unit (`) 6.58 6.16b) Own GenerationThrough Diesel GeneratorUnits 24,518 1,60,307Units per litre 4.72 4.06Cost per unit (`) 7.64 8.59* The aforesaid figures are not comparable in <strong>view</strong> of transfer of Caterpillar business of <strong>the</strong> Company to its wholly-owned subsidiary, Tractors IndiaPrivate Limited w.e.f. 1st April, 2010.StandardUnitYear ended31.03.2011Year ended31.03.2010B. Consumption per unit of ProductionProduct – Cranes Electricity (in ‘000) Nos. 12.79* 4.49** Comparison with previous year not relevant because of change in product mix and capacity u<strong>til</strong>ization.
Over<strong>view</strong> Performance Re<strong>view</strong>s Governance Financials31Annual Report 2010-11FORM BTECHNOLOGY ABSORPTIONI. Research and Development1. Specific Areas: Our Research and Development activities are commensurate with <strong>the</strong> realms of <strong>the</strong> industry. Improving on existing models and importsubstitution of components toge<strong>the</strong>r with developing new models and absorbing superior technology designs from foreign collaborators are somemeasures undertaken to answer <strong>the</strong> demanding technology parameters of operation.2. Benefits Derived: Improvised formulation with technology and cost efficiencies have boosted and asserted <strong>the</strong> Company’s claim as <strong>the</strong> market leaderin <strong>the</strong> material handling industry.3. Plan of Action: New technical collaborations, revamping of existing models, creating an excellent and conducive work ambience and enlighteningand directing <strong>the</strong> existing and incumbent workforce towards achieving a much higher objective of customer satisfaction shall remain a priority.II.Technology Absorption, Adoption & Innovation1. Efforts made: The Company has continued its endeavor to absorb, adopt and implement <strong>the</strong> best technologies for its product range to meet <strong>the</strong>requirements of a globally competitive market. All of <strong>the</strong> Company’s products are compliant with <strong>the</strong> prevalent regulatory norms in India.2. Benefits: The Company believes that <strong>the</strong> improved technology and <strong>the</strong> value addition that is being made to its product range will enhance <strong>the</strong> qualityof its products.3. Imported Technology: In order to acquire <strong>the</strong> latest state of <strong>the</strong> art technology available globally,- <strong>the</strong> Company has executed technical collaborationagreements with some of <strong>the</strong> world’s finest and distinguished enterprises.FOREIGN EXCHANGE EARNINGS AND OUTGO1. Efforts:The Company is exploring <strong>the</strong> possibility of achieving <strong>the</strong> fabrication orders, specific market access, and designs subcontracting from its principal, toenhance its foreign exchange earnings.2. Earnings and Outgo: ` in Lacsi) Foreign Exchange Earnings:Export sales (FOB), Commission, Dividend, Technical Fees, etc. 1672ii)Foreign Exchange outgo (includes raw material, capital goods, components & spares, and o<strong>the</strong>r expenditure in foreign currency,including dividends):a) Raw Material 5003b) Machines (Trading items) 216c) Components & Spares 32d) Capital goods -e) Travelling 10f) Technical Know-how Fees 241g) Royalty 115h) Dividend 116Place : KolkataDate : 17th May, 2011.A. MazumdarChairman
32ManagementDiscussion& AnalysisINDUSTRY STRUCTURE & DEVELOPMENTDuring <strong>the</strong> course of <strong>the</strong> Management Discussion & Analysis last year, your Company mentioned that as per <strong>the</strong> report by Management Consultant McKinsey,<strong>the</strong> revised amount proposed towards infrastructural development by Government of India is estimated at ` 37,500,000 lacs. Your Company also mentionedthat major investments in <strong>the</strong> infrastructure sector were to happen and that <strong>the</strong>se investments would be significant in 2011-12 which would also conclude <strong>the</strong>11th Five Year Plan tenure.The Indian economy for <strong>the</strong> year 2011-12 is looking forward to a positive growth and fiscal consolidation. The overall macro-economic environment for industryis also very supportive and <strong>the</strong> budget for 2011-12 indicates a sustainable economic growth. With <strong>the</strong> growth in 2010-11 now estimated at 8.6 per cent, <strong>the</strong>turnaround needs to be quick and sustainable, although some concerns s<strong>til</strong>l persist such as high inflation and temporary slowdown in <strong>the</strong> industry growth.The growth rate in India has been far better than o<strong>the</strong>r emerging economies. The effect of <strong>the</strong> global economic slowdown has been largely contained due toproactive measures and also due to greater reliance on domestic demand. As per <strong>the</strong> report of Central Statistics Office (CSO), India’s Gross Domestic Product(GDP) growth has been estimated at 8.6 per cent in fiscal 2010-11 and <strong>the</strong> drivers for <strong>the</strong> overall growth in 2010-11 have been <strong>the</strong> following:-a. Growth in industrial sectorb. Growth in manufacturing sectorc. Growth in mining and quarry sectord. Growth in service sectorIn a recent report by Asian Development Bank (ADB), India and six o<strong>the</strong>r major economies in Asia will be driving <strong>the</strong> region’s growth and could account for morethan half <strong>the</strong> global Gross Domestic Product by 2050. The Indian economy is expected to grow to a level of USD 40.4 Trillion from USD 1.4 Trillion in 2010. Thiswill be possible only through a faster rate of economic growth in <strong>the</strong> next 40 years and <strong>the</strong> young workforce population in India will act as a foundation to achieve<strong>the</strong> projected growth.India being one of <strong>the</strong> fastest growing economies in <strong>the</strong> world, <strong>the</strong> need for infrastructural facilities is ever increasing across sectors. The development of adequateinfrastructure has been identified as <strong>the</strong> most critical pre-requisite for continuing <strong>the</strong> current growth momentum of <strong>the</strong> economy. The Indian economy for 2011-12is expected to grow at 9 per cent plus and according to UNCTAD’s World Investment Prospect Survey 2009-11, India is <strong>the</strong> second most attractive destination for
Over<strong>view</strong> Performance Re<strong>view</strong>s Governance Financials33Annual Report 2010-11FDI (after China) in <strong>the</strong> world. The Government of India plans to step up its infrastructure expenditure as a percentage of <strong>the</strong> national GDP from 6.5 per cent in2009-10 to around 9 per cent in 2012. The Government of India has also announced that <strong>the</strong> investments in infrastructure is expected to total USD 1 Trillion in<strong>the</strong> 12th Five Year Plan i.e. 2012-17 compared to USD 514 Billion in <strong>the</strong> 11th Five Year Plan.160140120100806040200US$ Billions4.0%3.0%24 27 28 324.0% 4.0% 4.0% 4.2%46399.0%1438.0%7.0% 115944.5%58FY03 FY04 FY05 FY06 FY07 FY08 FY09 FY10E FY11E FY12E10.0%9.0%8.0%7.0%6.0%5.0%4.0%3.0%2.0%1.0%0.0%[Source - Goldman Sachs]Infrastructure Investment (US$ Billions)Spend as % of GDPAs also mentioned during <strong>the</strong> Management Discussion & Analysis of 2009-10, many key projects were deferred that were expected to be finalized during 2010-11and 2011-12. O<strong>the</strong>r construction projects which were also stalled are now showing signs of revival and it is expected that in 2011-12, <strong>the</strong> investments will happenin <strong>the</strong>se sectors.Given <strong>the</strong> Government’s planned expenditure for infrastructure sector constituting around 48.50 per cent of total plan outlay for FY12 – a growth of 23.03 per centover <strong>the</strong> Union Budget 2010-11, it indicates an increased focus on <strong>the</strong> sector.In order to ensure development in infrastructure, <strong>the</strong> Government of India is also making radical changes in policy matters to promote <strong>the</strong> Public PrivatePartnership (PPP) module and facilitate private investments and attract FDIs. As per RBI Bulletin, India targets to achieve annual FDI worth USD 50 Billion by2012 and plans to double <strong>the</strong> inflows by 2017.The Government of India’s thrust on <strong>the</strong> infrastructure segment will continue which will also result in exponential growth in <strong>the</strong> Construction Equipment Sector.According to <strong>the</strong> latest study conducted by leading Management Consultant McKinsey, Indian Earthmoving & Construction Equipment (ECE) has <strong>the</strong> potential togrow 5-fold from its current size to USD 13 Billion by 2015 growing at a CAGR of 24 per cent.Demand Generator (Percentage)2%7%10%Earth-moving equipmentMaterial-handling and cranesConcrete equipmentRoad-buildingequipmentO<strong>the</strong>rs13%68%Source: “Report on Indian mining and construction equipment industry.” Ministry of Heavy Industries and Public Enterprises
34Construction equipment volume is expected to increase at a CAGR of 18.1 per cent over by 2013 vis-à-vis 12.3 per cent CAGR clocked over <strong>the</strong> 2005-09 period.Increasing demand for construction equipment (‘000 units)49433531224652616820052006 2007 2008 2009E FY10E 2011E 2012E 2013ESource: Off-Highway ResearchThe Roads & Highways will remain a key growth driver for IndianInfrastructure growth. The National Highways Authority of India (NHAI)has been assigned <strong>the</strong> task of awarding contracts for around 100 projects,covering 11,151 kms, over <strong>the</strong> financial year starting w.e.f. April 1, 2011. With<strong>the</strong> Government of India permitting 100 per cent FDI in <strong>the</strong> roads sector,most foreign investors in <strong>the</strong> Indian roads sector have formed consortiumswith Indian companies to participate in <strong>the</strong> development of road projects in<strong>the</strong> country. As a result, construction companies are now being rewardedwith large order books and portfolios of BOT projects. The Government plansto construct 35,000 kms of highways by 2014 under <strong>the</strong> NHDP with aninvestment of USD 60 Billion.The Government of India’s expenditure in <strong>the</strong> Indian Shipping & PortSectors will continue. The ‘Maritime Agent 2020’ recently launched,envisages investments worth over USD 33 Billion in <strong>the</strong> maritime sector.This aims to create a port capacity of around 3200 MT from 617 MT as on31.03.2010 which will be able to handle <strong>the</strong> expected growth in traffic of about2500 MT by 2020. Majority of <strong>the</strong>se projects are to be implemented through<strong>the</strong> PPP route. With <strong>the</strong> increase in container traffic, <strong>the</strong>re is a need to developcontainer terminals and make available container handling equipment atPorts. Containerization and container traffic at major ports grew at a CAGR of13 per cent between 2005-06 and 2009-10. This will create opportunities for<strong>the</strong> requirement of container handling equipment in India.In <strong>the</strong> Railways Sector, <strong>the</strong> Government of India has proposed investmentsto <strong>the</strong> tune of ` 57, 630 crores for <strong>the</strong> year 2011-12 with <strong>the</strong> objective ofmodernizing and developing India’s Railway infrastructure. The IndianRailways have allowed private sector entities to operate container trains and<strong>til</strong>l date agreements with 16 companies have been entered into for supply ofcontainer services. The Indian Railways also plan to add 25000 kms of newlines by 2020 with a major increase in <strong>the</strong> PPP.The demand for <strong>the</strong> Power Sector continues to be robust as <strong>the</strong> shortfallin power generation continues to be 13 per cent at peak demand and percapita usage is also 10 per cent of <strong>the</strong> global average. There is going to beaggressive demand for power generator sets from industries like tex<strong>til</strong>e, IT,railways, auto ancillaries, petroleum, etc. As per <strong>the</strong> analysis done by Frost &Sullivan, <strong>the</strong> Indian diesel generator set market estimates to reach a revenue ofUSD 2444 Million by 2015.The Government of India’s focus on infrastructure development hassignificantly boosted <strong>the</strong> construction equipment industry and expenditure inthis sector is expected to be nearly USD 253.9 Billion by 2012–13.With increased competition, your Company has initiated various steps whichinclude offering a wider gamut of products and services, increased coverage,enhanced focus on people capabilities, investments in infrastructure, R&D anddesign excellence which will enable your Company to seize <strong>the</strong> opportunitieswhen <strong>the</strong>y materialize.BUSINESS PERFORMANCEFor <strong>the</strong> year under re<strong>view</strong>, your Company will highlight <strong>the</strong> businessperformance in <strong>the</strong> following manner:a) Under TIL Ltd., Material Handling Solutions and Equipment & ProjectSolutions will be discussed.b) Under Tractors India Private Limited (TIPL), Construction & MiningSolutions and Power Systems Solutions will be discussed.Material Handling SolutionsMaterial Handling Solutions accounted for 19 per cent of <strong>the</strong> Group Sales during <strong>the</strong>year 2010-11. The overall sales were 20 per cent higher compared to <strong>the</strong> previousyear. MHS registered a turnover of ` 219.5 crores in 2010-11 vis-à-vis` 182.4 crores in 2009-10.
Over<strong>view</strong> Performance Re<strong>view</strong>s Governance Financials35Annual Report 2010-11The division retained its leadership position in Mobile Slew cranes marketwith market share of 58 per cent. Special focus was given to Truck cranesand <strong>the</strong> division increased its sales of Truck cranes by 15 per cent in spiteof severe competition from Chinese manufacturers. TIL has demonstratedmarket leadership in this segment also with over 38 per cent market share.The order book as on 31st March, 2011 was ` 45 crores.The Mining segment continued to have confidence in our cranes – cranesvalued ` 20 crores were supplied to mining companies. The prospects for2011-12 are also bright.The Group supplied eleven Rough Terrain cranes valued ` 15.4 crores toRITES for <strong>the</strong>ir projects in Myanmar.The MHS division has successfully completed supply of Material HandlingEquipment required for <strong>the</strong> first phase of Project Akash and fur<strong>the</strong>r ordersare in <strong>the</strong> pipeline for this Project. Continuing <strong>the</strong>ir trust in Material HandlingEquipment, fur<strong>the</strong>r orders are also expected for Pinaka Project. Your Companyis working on o<strong>the</strong>r applications of Material Handling Equipment required by<strong>the</strong> Indian Defense sector which has good potential in <strong>the</strong> future.With <strong>the</strong> objective of improving planned throughput and cost, <strong>the</strong> MHS divisionof your Company is continuing with <strong>the</strong> Accelerated Improvement Program(AIP) which involves all sections of employees with particular focus onparticipation from <strong>the</strong> shop floor workmen.During <strong>the</strong> year, your Company also launched <strong>the</strong> 75 MT capacity TruckMounted crane. Indigenously built, <strong>the</strong> crane reinforces <strong>the</strong> design excellenceof <strong>the</strong> Company’s in-house team and streng<strong>the</strong>ns <strong>the</strong> fuel-efficient, ruggedand reliable product portfolio in <strong>the</strong> TMS range. This high performance productoffering comes with impressive features like 5 axles including 3 steering axles,GVW of 49te, 4 section Trapezoidal full power boom, all of which form partof <strong>the</strong> designing process developed in-house. In addition, this entire projectstarting from Design to Dispatch of <strong>the</strong> machine was completed within anincredible time frame of 90 days.In <strong>the</strong> port equipment range, your Company introduced a new model of ReachStacker built with <strong>the</strong> technical collaboration of NMHG – Hyster with featurescomparable to <strong>the</strong> best in <strong>the</strong> world.Equipment & Project Solutions (EPS) - <strong>the</strong> vertical formed last year underMHS catering to ports, road construction sectors with products such asRTG cranes, Crushers & Screens, Hot Mix Asphalt Plants, has witnesseda year of major developments. The progress at <strong>the</strong> Kharagpur site hasbeen significant. Construction of <strong>the</strong> factory shed is in progress and yourCompany expects that <strong>the</strong> Plant can be commissioned in <strong>the</strong> middle of2011-12. Simultaneously, procurement of Plant & Machinery has been ontrack with most of <strong>the</strong>m arriving at site for installation during June 2011.In <strong>the</strong> market place, <strong>the</strong> seeding plan for Crushers & Screens has beensmooth with products being sold to aggregate and mining segments. This willfacilitate <strong>the</strong> sale of products offered by your Company in volumes when <strong>the</strong>manufacturing commences at <strong>the</strong> new plant. Similarly, various awareness/education programs have been conducted on <strong>the</strong> Hot Mix Plant and <strong>the</strong>use of Recycled Asphalt Pavement (RAP) which is a USP of <strong>the</strong>se plants.The National Highways Authority of India (NHAI) has given specific approvalfor use of Double Barrel Drum Mix which is a patented technology of Astecfor NHAI Projects. In its approval order dated 3rd March, 2010, NHAI hascommented that <strong>the</strong> entire process of such Drum Mix plants gives a veryhomogenous mix, also observing that such Double Barrel Drum Mix plantsare suitable for use of Recycled Asphalt Pavement, are cost and energyefficient and are environment friendly due to low emission of carbon gases.This is testimony to <strong>the</strong> fact that your Company has always delivered <strong>the</strong> best,not only in terms of technology but also in terms of energy conservation andenvironmental protection.The Company’s participation in various tenders for Rubber Tyred Gantrycranes has been quite high and this should help in finalization of orders during2011-12.Being a new vertical, building <strong>the</strong> organization with <strong>the</strong> right skills and qualityof people is of paramount importance and EPS has been able to induct solidprofessionals for running <strong>the</strong> business in <strong>the</strong> years to come. Overall, EPS ispoised to make a successful launch in 2011-12.Tractors India Private Limited (TIPL)The 100 per cent subsidiary of TIL formed in 2010 is engaged as a Dealer forCaterpillar Inc. for <strong>the</strong>ir construction, mining and power systems solutions andnew associations with SEM and SITECH. Construction & Mining Solutionsunder TIPL accounted for 72 per cent of TIPL’s revenue. The industry andeconomic conditions were generally on <strong>the</strong> recovery path during <strong>the</strong> latterpart of <strong>the</strong> year. In terms of unit sales, 1181 units were sold. Despite <strong>the</strong> factthat <strong>the</strong> overall industry looked towards turning around, <strong>the</strong>re were certainsegments with high Government planned investments, which continued tosuffer from <strong>the</strong>ir own inherent issues. The mining segment and <strong>the</strong> roads &highways sectors in particular were affected and as a consequence, projectswere delayed with cost and time overruns.The division under TIPL has s<strong>til</strong>l been able to achieve some prestigiousorders with major companies in <strong>the</strong> mining and roads & highways segment.There was a record sale for Wheel Loaders and Motor Graders and alsotwo new Maintenance & Repair Contracts (MARC) were signed with twoprominent mining Customers. Fur<strong>the</strong>rmore, two important MARC agreementswere renewed. The strategic initiative of segmenting <strong>the</strong> customers intoGovernment/State owned enterprises, Large Corporations, emerging nationalplayers and Global customers has helped <strong>the</strong> business in offering customizedand focused solutions, thus providing superior deliverables to <strong>the</strong> business.In <strong>the</strong> roads & highways segment <strong>the</strong> division made some breakthrough fora full equipment line-up of 19 machines valued at ` 35 crores for a primecustomer. With a <strong>view</strong> to streng<strong>the</strong>n <strong>the</strong> relationship with customers, a specialinitiative to train <strong>the</strong> operators was undertaken and received favorably by<strong>the</strong>m. Orders for work on <strong>the</strong> NH4 with some renowned subcontractors were
36also secured. With <strong>the</strong> Government and NHAI clearly focusing on accelerating<strong>the</strong> approval and execution process, your Company shall witness more ofsuch business opportunities fructifying in <strong>the</strong> future. The order book as on31st March, 2011 stood at ` 39 crores.Power Systems Solutions under TIPL accounted for 28 per cent ofTIPL’s revenue and in terms of units 611 Engines were sold during <strong>the</strong> yearincluding those sold in <strong>the</strong> petroleum segment. The business made some majorbreakthrough and <strong>the</strong> segments such as Agriculture, Plantation, Cement, RealEstate, Automotives and Construction helped us to achieve some landmarkorders.• 5 Units of 1,500 kVA sets for a Power project at Orissa amongst o<strong>the</strong>rprestigious orders• 3 Units of 1,010 kVA sets were sold to a Hatchery in RanchiAno<strong>the</strong>r significant achievement was <strong>the</strong> deployment of 30 Engines of320/500 kVA for a major construction house project on a rental basis. Withuseful business emanating from Integrated Power Projects, Roads, Oil andGas, <strong>the</strong> Rental business has grown 34 per cent in revenues over last year.In <strong>the</strong> Oil and Gas segment, we see some major changes happening with anupswing in City Gas Distribution – which would mean heightened activity inGas Compression. It has also been noticed that <strong>the</strong> majors in <strong>the</strong> industryare going in more for hiring of Rigs instead of buying of Rigs and this couldbe an opportunity for your Company in <strong>the</strong> future. The order book as on31st March, 2011 stood at ` 84 crores.Rentals & Used EquipmentAlthough s<strong>til</strong>l nascent, TIPL continues its emphasis on <strong>the</strong> Rental and UsedEquipment business due to its future growth potential. Investments in settingup six Rental Stores supported by rental selling outlets have been made inBhubaneswar, Asansol, Chandigarh, Lucknow, Sahibabad and Udaipur offeringcustomers to rent or buy used equipment as also Allied Products like MobileLighting Towers etc. Some breakthrough business of deploying a fleet ofBackhoe Loaders at <strong>the</strong> Tea gardens in North Bengal has yielded good results.Customized Rental Solutions to <strong>the</strong> Sikkim Airport Construction was also anew business initiative. Focus was on sale of used machines and a growth inprofits over last year was recorded.The Rental division under TIPL has made significant investments in RentalAssets, Infrastructural facilities, people and training and has established itselfas a preferred Rental Service Provider in <strong>the</strong> Industry. Rental continues to bea major focus area and TIPL is fully ready and can cater to customer demandsfor a wide range of reliable Cat machines, Cat DG Sets and Allied Products likeMobile Lighting Towers from <strong>the</strong> six Rental Stores. In addition, <strong>the</strong> Companyhas also introduced Allied Products and has created a new milestone with<strong>the</strong> launch of Mobile Lighting Towers and has plans to introduce o<strong>the</strong>r AlliedProduct Solutions progressively based on industry needs.In order to have a more cohesive and customer-centric organization, yourCompany has taken initiatives in areas of people development includingtechnical and operator trainings, focused on enhancing coverage through anincrease of branches and facilities across <strong>the</strong> four territories formed underTIPL, commissioning of Component Rebuild Center (CRC) for offering valueadded services to customers with <strong>the</strong> eventual aim of attaining customerloyalty and market leadership.OPPORTUNITIES & THREATSDuring <strong>the</strong> financial year 2010-11, investments made by <strong>the</strong> Governmentof India in <strong>the</strong> infrastructure sector had not happened as per expectation.There had been deferment in investments in certain projects whichshould get started in <strong>the</strong> financial year 2011-12. During <strong>the</strong> financial year2011-12, investments in <strong>the</strong> infrastructure sector will materialize and increasesignificantly with <strong>the</strong> finalization of <strong>the</strong> key projects including construction ofexpressways, flyovers, metro rail projects, SEZs, investments in major ports,privatization of mining and up gradation of major airports. The key sectorsthat will lead to increased investment in infrastructure space are likely to be –• Roads (USD 8 Billion cumulative demand)• Irrigation (USD 8 Billion cumulative demand)• Urban & Residential Construction (USD 5 Billion cumulative demand)• Mining (USD 5 Billion cumulative demand)The Company is geared to avail <strong>the</strong> emerging opportunities and <strong>the</strong>rebystreng<strong>the</strong>n <strong>the</strong> Company’s position. The Company continues to initiatevarious strategies through focus on products and range expansion, enhancemanufacturing capacity, focused organization structure, market penetration,operational excellence, IT & Systems Development and human resourcedevelopment.In addition to <strong>the</strong> aforesaid, various technical collaboration agreementswith world leaders in <strong>the</strong> Material Handling space will enable <strong>the</strong> Companyto enhance its business opportunities. The Company continues to remainfocused in its objective to pursue <strong>the</strong> path of profitability and sustainablegrowth, maximize operational efficiency and strategies to attain <strong>the</strong> higheststandard of quality, safety and productivity.There is significant dependence on imports arising out of imported materialrequirement for <strong>the</strong> manufacturing plant as well as imported capital goods.Adverse foreign exchange fluctuations will have an impact in <strong>the</strong> businessprocess. In addition to this, economic slowdown in terms of fur<strong>the</strong>r defermentof Government of India’s expenditure in <strong>the</strong> infrastructure sector and fur<strong>the</strong>rhike in steel prices will also have an impact on <strong>the</strong> business.Your Company has been facing competition both locally and internationallywhich could pose a threat in <strong>the</strong> growth of <strong>the</strong> business.RISKS & CONCERNSThe vital risk as perceived by <strong>the</strong> Management of your Company is <strong>the</strong> industryslowdown which could significantly affect <strong>the</strong> Company’s future performance.Any increase of prices will affect <strong>the</strong> cost of production <strong>the</strong>reby affecting<strong>the</strong> Company’s performance. With <strong>the</strong> opening up of <strong>the</strong> economy, <strong>the</strong>re is
Over<strong>view</strong> Performance Re<strong>view</strong>s Governance Financials37Annual Report 2010-11always <strong>the</strong> risk of increased competition from international players. YourCompany also has a major concentration risk as a significant portion of <strong>the</strong>revenues are generated by a cluster of customers which could have a materialimpact in <strong>the</strong> event of <strong>the</strong>ir attrition. Finally, <strong>the</strong> business also runs <strong>the</strong> risk ofpeople attrition which leads to loss of knowledge and experience. However,your Company has analyzed <strong>the</strong> various types of risks and has framed a RiskManagement policy which includes mitigation of such risks. The Board ofDirectors re<strong>view</strong> <strong>the</strong>se risks periodically. This re<strong>view</strong> is done with <strong>the</strong> intentionof mitigating <strong>the</strong> same in a structured manner with strategic interventions at<strong>the</strong> appropriate time.OUTLOOKThe Finance Ministry in its budget for 2011-12 mentioned about allocatingUSD 49 Billion for infrastructure investments which is an increase of23 per cent over 2010-11. The Planning Commission had already projectedan investment of USD 459 Billion for <strong>the</strong> 11th Plan which was more thantwice <strong>the</strong> investment during <strong>the</strong> 10th Plan. These figures clearly indicate <strong>the</strong>Government of India’s intention and emphasis on infrastructure developmentin India. India is all set to become <strong>the</strong> world’s fastest growing economyby 2013-15 according to a Report by Morgan Stanley. The GDP growthhas been estimated at 9-9.5 per cent in 2013-15. The major initiative in2011-12 budget is <strong>the</strong> proposal to create a Special Purpose Vehicle to attractforeign funds for infrastructure. Under this scenario, your Company remainsoptimistic about its long-term growth plan which will fur<strong>the</strong>r depend on <strong>the</strong>timing and speed at which <strong>the</strong> aggressive investments by Government takesplace in <strong>the</strong> infrastructure space.The overall outlook of <strong>the</strong> Company continues to be positive and <strong>the</strong>Management remains confident to meet <strong>the</strong> requirements of <strong>the</strong> infrastructuralsectors through its technology intensive product offerings in <strong>the</strong> areas ofmining, construction, earthmoving, material handling, coal handling, port, roadconstruction and power systems.The business opportunities in <strong>the</strong> next few years look very attractive and yourCompany is committed through adequate human resources at <strong>the</strong> appropriatelevels to capture every opportunity arising in this space.KNOWLEDGE RESOURCEYour Company recognizes <strong>the</strong> substantial benefits of <strong>the</strong> right Human Capitaland understands that <strong>the</strong> quality of workforce decides <strong>the</strong> effectiveness of abusiness. As a forward thinking organization, your Company constantly strivesto leverage knowledge of its workforce with an aim to create a stimulatingworkplace where every employee can achieve his optimum potential, <strong>the</strong>rebycontributing to your Company’s business performance.In congruence with <strong>the</strong> goals and objectives of your Company, <strong>the</strong> focus for<strong>the</strong> year under re<strong>view</strong> was on career progression and succession planning.Along with this, leadership development and enhancement of capability andskill levels for all employees remained a key objective. With a <strong>view</strong> to enrich<strong>the</strong> knowledge resource base of <strong>the</strong> organization, your Company initiated<strong>the</strong> Leadership Development Program titled ‘ASCENT’ focusing on enhancingessential managerial and leadership linked competencies.With <strong>the</strong> same vision, “Compensation Indexing” was conducted coupled withposition evaluation based on comparator basket in order to u<strong>til</strong>ize <strong>the</strong> samefor career development of employees through a series of career planningworkshops. Employee Opinion Survey was conducted for <strong>the</strong> year 2010-11and your Company also held various quality activities towards enhancingemployee engagement and motivation for creating an ideal work environment.As on 31st March, 2011, <strong>the</strong> employee strength of TIL and TIPL stood at 1898.INTERNAL CONTROLS & THEIR ADEQUACYThe Company has an adequate system of internal controls implemented by<strong>the</strong> Management towards operations, optimum u<strong>til</strong>ization of resources andeffective monitoring and compliance with all applicable rules. The InternalControl System is commensurate with <strong>the</strong> size and nature of operation. Afirm of Chartered Accountants conducts <strong>the</strong> internal audit in addition to yourCompany’s own Internal Audit Dept. The Company has an Audit Committeethat re<strong>view</strong>s Audit Reports submitted by <strong>the</strong> Internal Auditors. The Committeealso meets Company’s Statutory Auditors and <strong>the</strong> Internal Auditors to ascertain<strong>the</strong>ir <strong>view</strong>s on <strong>the</strong> adequacy of internal control systems and keeps <strong>the</strong> Boardof Directors informed of its major observations from time to time.DISCUSSION ON FINANCIAL PERFORMANCE WITH RESPECT TOOPERATIONAL PERFORMANCETotal income of TIL and TIPL for <strong>the</strong> year stands at ` 1148.44 croresvis-à-vis ` 887.94 crores in 2009-10. PBT for <strong>the</strong> year stands at ` 75.81crores compared to ` 75.48 crores in <strong>the</strong> previous year. EBIDTA for <strong>the</strong> year is` 114.21 crores (i.e. an increase of 5 per cent) vis-à-vis ` 108.38 crores in2009-10.On an activity basis, TIL and TIPL transacted ` 1287.5 crores in 2010-11vis-à-vis ` 1050.40 crores in 2009-10 registering an increase of 23 per cent.INDUSTRIAL RELATIONSThe industrial relation was harmonious and cordial with all workmen andunions.CAUTIONARY STATEMENTCertain statements made in <strong>the</strong> Management Analysis and Report relating toCompany’s objectives, projections, outlook, expectations, estimates, etc. mayconstitute ‘forward looking statements’ within <strong>the</strong> meaning of applicable lawsand regulations. Actual results may differ from such expectations, projections,etc. whe<strong>the</strong>r express or implied.Several factors could make a significant difference to <strong>the</strong> Company’soperations. These include economic conditions, political scenario, and paceof country’s infrastructure development, Government of India’s Regulationsand taxation, natural calamity, etc. over which <strong>the</strong> Company does not haveany control.
38Report onCorporateGovernanceCOMPANY’S PHILOSOPHY ON CODE OF GOVERNANCEThe Company adopts and adheres to <strong>the</strong> best recognized Corporate Governance Policies for ensuring transparency, professionalism and accountability in itsdealings with its customers, principals, employees, shareholders and with every individual who comes in contact with <strong>the</strong> Company.The Company’s philosophy on Corporate Governance is bounded upon a rich legacy of fair ethical governance practices, many of which were already in place evenbefore <strong>the</strong>y were mandated by adopting honesty, integrity and ethical behavior.As a good corporate citizen, <strong>the</strong> Company has established systems to encourage environmental and social initiatives that contribute to organizational sustainability,systematic training, conservation of energy and o<strong>the</strong>r scarce resources.The Company is in full compliance with <strong>the</strong> requirements of Corporate Governance under Clause 49 of <strong>the</strong> Listing Agreement entered into with <strong>the</strong> StockExchanges and in this regard, submits a report on <strong>the</strong> matters mentioned in <strong>the</strong> said clause. The Corporate Governance practices followed by <strong>the</strong> Company areas stated below:1. Composition of <strong>the</strong> Board of Directorsa) The Board consists of eight (8) Members out of which three (3) are Whole-time Directors and five (5) are Non-Executive Independent Directorsincluding a Director nominated by Life Insurance Corporation of India (LIC).
Over<strong>view</strong> Performance Re<strong>view</strong>s Governance Financials39Annual Report 2010-11Composition, Category, Directorships and Committee Memberships in o<strong>the</strong>r Companies as on 31st March, 2011.The Board of your Company consists of <strong>the</strong> following Directors:Name of Directors Category of Director Directorships held ino<strong>the</strong>r Indian PublicLimited CompaniesCommittee# Positions held in o<strong>the</strong>r IndianPublic Limited CompaniesAs Chairman As MemberMr. A. Mazumdar – Chairman and Executive - - -Wholetime DirectorMr. Sumit Mazumder –Executive 1 - -Vice Chairman & Managing DirectorMr. S. K. Bhatnagar -Executive 3 - -Director - MHS*Mr. R. L. Gaggar – Director Non-Executive Independent 10 - 8Mr. U. V. Rao – Director Non-Executive Independent 2 1 1Mr. K. B. Saha – DirectorNon-Executive Independent - - -(Nominee of LIC){+}Mr. G. Swarup - Director Non-Executive Independent 7 - 1Dr. T. Mukherjee – Director Non-Executive Independent 4 - -# Only Audit Committee and Shareholders’ Grievance Committee have been considered for this purpose.{+} LIC being an Equity Investor.* Appointed as Director with effect (w.e.f.) from 1st April, 2010b) During <strong>the</strong> year ended 31st March, 2011, six (6) meetings of <strong>the</strong> Board of Directors were held. The Company has held at least one Board Meeting inevery three months and <strong>the</strong> maximum time gap between any such two meetings was not more than four months. The details of <strong>the</strong> Board Meetingsare as under :Sl. Date Board Strength No. of Directors PresentNo1. 11th May 2010 8 72. 29th July 2010 8 73. 26th October 2010 8 74. 28th December 2010 8 75. 25th January 2011 8 76. 29th March 2011 8 5Attendance of Directors at <strong>the</strong> Board Meetings and Annual General Meeting (AGM) during <strong>the</strong> year ended 31st March, 2011 :Name of Director No. of Board Meetings Attendance at <strong>the</strong> last AGMHeld on 29th July, 2010HeldAttendedMr. A. Mazumdar 6 3 YesMr. Sumit Mazumder 6 6 YesMr. S. K. Bhatnagar 6 5 YesMr. R. L. Gaggar 6 6 YesMr. U. V. Rao 6 5 YesMr. K. B. Saha 6 4 NoMr. G. Swarup 6 6 YesDr. T. Mukherjee 6 5 YesPursuant to <strong>the</strong> declaration made in Form 24 AA under Section 299 of <strong>the</strong> Companies Act, 1956, none of <strong>the</strong> Non-Executive Independent Directorshas any pecuniary relationship and/or transaction with your Company o<strong>the</strong>r than receiving Sitting Fees, Commission and/or reimbursement ofexpenses, if any, incurred for attending meetings of <strong>the</strong> Board and/or Committee <strong>the</strong>reof.Resume and o<strong>the</strong>r information of <strong>the</strong> Directors getting appointed, as required under Clause 49 IV (G) of <strong>the</strong> Listing Agreement, are given in <strong>the</strong> Noticecalling <strong>the</strong> Annual General Meeting.
402. Audit Committeea) The Audit Committee of <strong>the</strong> Company was constituted on 31st October, 2000. The broad terms of reference and composition of <strong>the</strong> Audit Committeeare as per Clause 49 of <strong>the</strong> Listing Agreement and are in accordance with Section 292A of <strong>the</strong> Companies Act, 1956.b) The Audit Committee as at 31st March, 2011 comprises five Directors, all being Non-Executive Independent Directors namely, Mr. U. V. Rao,Mr. R. L. Gaggar, Mr. K. B. Saha, Mr. G. Swarup and Dr. T. Mukherjee. The Vice Chairman & Managing Director, <strong>the</strong> Chief Financial Officer, <strong>the</strong>President (Material Handling Solutions Business Segment), <strong>the</strong> Statutory Auditors and <strong>the</strong> Internal Auditors are invitees. The Company Secretary, Mr.Sekhar Bhattacharjee, is <strong>the</strong> Secretary to <strong>the</strong> Audit Committee.c) The Members of <strong>the</strong> Audit Committee are eminent persons in <strong>the</strong> Industry and have expertise in finance and accounting.d) Mr. U. V. Rao, Chairman of <strong>the</strong> Audit Committee attended <strong>the</strong> AGM held on 29th July, 2010.i. During <strong>the</strong> year ended 31st March, 2011 Audit Committee Meetings were held on 11th May 2010, 29th July 2010, 26th October 2010 and25th January, 2011.ii. The Annual Financial Statements for <strong>the</strong> financial year 2009-10 were re<strong>view</strong>ed by <strong>the</strong> Audit Committee at its meeting held on 11th May, 2010and were recommended to <strong>the</strong> Board for adoption.iii.The unaudited financial results for each quarter were re<strong>view</strong>ed and approved by <strong>the</strong> Audit Committee during <strong>the</strong> year before recommendationto <strong>the</strong> Board of Directors for adoption.e) Attendance of <strong>the</strong> members at <strong>the</strong> Audit Committee Meetings held during <strong>the</strong> year ended 31st March, 2011 :Name Status Meetings held Meetings attendedMr. U. V. Rao Chairman 4 4Mr. R. L. Gaggar Member 4 4Mr. K. B. Saha Member 4 2Mr. G. Swarup Member 4 4Dr. T. Mukherjee Member 4 43. Remuneration and Compensation CommitteeThe Remuneration Committee was constituted on 31st May, 1999. The broad terms of reference of <strong>the</strong> Remuneration Committee were:To consider and re<strong>view</strong> from time to time <strong>the</strong> terms and conditions and remuneration package payable to Whole-time Directors and Senior Executives of<strong>the</strong> Company and to recommend to <strong>the</strong> Board accordingly.The Remuneration Committee as at 31st March, 2011 comprises three Independent Non-Executive Directors namely, Mr. R. L. Gaggar (Chairman), Mr. U. V.Rao and Dr. T. Mukherjee (Members). Remuneration of Whole-time Directors of <strong>the</strong> Company largely consists of base remuneration, perquisites and specialpay/incentives/commission. The components of <strong>the</strong> total remuneration vary for different cadres and are governed by industry patterns, qualifications andexperience of <strong>the</strong> incumbent, responsibilities handled, individual performance, etc.
Over<strong>view</strong> Performance Re<strong>view</strong>s Governance Financials41Annual Report 2010-11During <strong>the</strong> year ended 31st March, 2011, no meeting of <strong>the</strong> Remuneration & Compensation Committee was held.Remuneration of Directors for <strong>the</strong> Year Ended 31st March, 2011:Name of <strong>the</strong> DirectorSalary[including SpecialPay / Incentives]Perquisites(computed under<strong>the</strong> Income TaxAct, 1961)Contribution toProvident ando<strong>the</strong>r FundsCommissionSitting feesBoard Meeting CommitteeMeetingMr. A. Mazumdar 6,600 4,400 702 7,728 - -Mr. Sumit Mazumder** - - - - - -Mr. S. K. Bhatnagar 2,826 3,766 408 5,767 - -Mr. R. L. Gaggar - - - 800 90 60Mr. U.V. Rao - - - 800 75 60Mr. K. B. Saha - - - 800 60 30Mr. G. Swarup - - - 800 90 60Dr. T. Mukherjee - - - 800 75 60**Mr S. Mazumder draws remuneration only from Tractors India Private Limited, a wholly owned subsidiary of TIL Limited w.e.f. 1st April, 2010.(` in ‘000)All <strong>the</strong> Directors of <strong>the</strong> Board, o<strong>the</strong>r than <strong>the</strong> Vice Chairman & Managing Director and <strong>the</strong> Nominee Director, are liable to retire by rotation. The terms ofappointment of Whole-time Directors are decided by <strong>the</strong> Board as per <strong>the</strong> recommendation of <strong>the</strong> ‘Remuneration and Compensation Committee’, subjectto <strong>the</strong> Shareholders’ approval.The Service Contracts with <strong>the</strong> Whole-time Directors are for a period of five years from <strong>the</strong> date of appointment. The Notice period for <strong>the</strong> terminationof Contract is three months. There is no Severance Fees payable by <strong>the</strong> Company to <strong>the</strong> Whole-time Directors. The Company, at present, has no StockOption Scheme.The Non-Executive Directors do not hold any shares in <strong>the</strong> Company. The Non-Executive Directors, in addition to sitting fees, are also paid commissionpursuant to approval by <strong>the</strong> Shareholders in <strong>the</strong> Annual General Meeting held on 24th July, 2007. The said approval authorized <strong>the</strong> Board to fix <strong>the</strong>commission within <strong>the</strong> overall limit of 1% of <strong>the</strong> profits.4.A. Shareholders’ / Investors’ Grievance Committeea) The Shareholders’ / Investors’ Grievance Committee of <strong>the</strong> Company was constituted on 31st October, 2000. The terms of reference of <strong>the</strong>Shareholders’/Investors’ Grievance Committee is to look into Shareholders’/Investors’ complaints relating to transfer/splitting/consolidation ofshares, non receipt of dividend/Annual Report, revalidation of dividend warrant, etc and redress <strong>the</strong> same expeditiously.b) The Shareholders’/Investors’ Grievance Committee comprises one Independent Non-Executive Director and two Whole-time Directors:NameMr. R. L. GaggarMr. A. MazumdarMr. Sumit MazumderStatusChairmanMemberMemberc) During <strong>the</strong> year ended 31st March, 2011 no meeting of Shareholders’/Investors’ Grievance Committee was held as no grievances have been receivedfrom any of <strong>the</strong> shareholders.
42d) During <strong>the</strong> year ended 31st March, 2011 no complaint was received from <strong>the</strong> Shareholders’/Investors’ and <strong>the</strong> Registrar of <strong>the</strong> Company, M/s. C. B.Management Services Pvt. Ltd., Kolkata, has certified <strong>the</strong> same.4.B. Share Transfer and Certificate CommitteeThe Board has delegated <strong>the</strong> powers of approving transfer of shares to Share Transfer and Certificate Committee. The Committee met eleven (11) timesduring <strong>the</strong> year ended 31st March, 2011 and approved <strong>the</strong> transfer of shares lodged with <strong>the</strong> Company. At <strong>the</strong> year-end, <strong>the</strong>re was no share pending fortransfer.5. General Body Meetingsa) Location and time of last three Annual General Meetings (AGM)Financial Year (31st March) Date Time Location2007-2008 29.07.2008 10.00 a.m. 1, Taratolla Road, Garden Reach, Kolkata 700 0242008-2009 28.07.2009 10.00 a.m. 1, Taratolla Road, Garden Reach, Kolkata 700 0242009-2010 29.07.2010 10.00 a.m. 1, Taratolla Road, Garden Reach, Kolkata 700 024b) Special Resolutions passed at <strong>the</strong> last three AGMsFinancial YearItem2007-2008 Nil2008-2009 Re-appointment of Mr. A. Mazumdar, Chairman and Wholetime Director for aperiod of five years w.e.f. 1st June, 2009 to 31st May, 2014.2009-2010 Nilc) Location and time of last Extraordinary General Meeting (EGM)Financial Year (31st March) Date Time Location2007-2008 28.11.2007 10.00 a.m. 1, Taratolla Road, Garden Reach,Kolkata 700 024d) Special Resolutions passed at <strong>the</strong> last EGMFinancial Year Item2007-2008 i) Alteration of Capital Clause of <strong>the</strong> Memorandum of Association and Article of Association of <strong>the</strong> Company.ii) To offer, issue and allot in one or more trenches, 29, 93,842 warrants of ` 10/- each at a premium of ` 316/-, to one ormore entities belonging to <strong>the</strong> Indian Promoter Group and o<strong>the</strong>rs on preferential basis. The said warrants are convertibleat <strong>the</strong> option of <strong>the</strong> holder into Equity Shares of ` 10/- each at <strong>the</strong> ratio of 1 Equity share for every warrant held.e) Court convened Meeting of ShareholdersPursuant to Section 391 read with 393 of <strong>the</strong> Companies Act, 1956, and in terms of <strong>the</strong> Order dated 15th March, 2010 of <strong>the</strong> Hon’ble High Courtat Calcutta, a Meeting of Shareholders was held on 12th April, 2010, to consider and approve <strong>the</strong> Scheme of Arrangement with its wholly ownedsubsidiary M/s. Tractors India Private Limited. Mr. Deb Mukherjee, Advocate was appointed as <strong>the</strong> Chairman of <strong>the</strong> said Meeting. The Scheme ofArrangement was approved and passed by shareholders by poll at <strong>the</strong> said Meeting.6. Disclosuresa) A statement in summary form of transactions with related parties in <strong>the</strong> ordinary course of business are placed periodically before <strong>the</strong> AuditCommittee. The pricing of all <strong>the</strong> transactions with <strong>the</strong> related parties were on arms length basis.b) The Company did not have any materially significant related party transactions, which may have potential conflict with <strong>the</strong> interest of <strong>the</strong> Company.c) While preparing <strong>the</strong> financial statements during <strong>the</strong> year under re<strong>view</strong>, no accounting treatment which was different from <strong>the</strong> prescribed AccountingStandard was followed.d) The Company has complied with <strong>the</strong> requirements of <strong>the</strong> regulatory authorities on capital markets and no penalties/strictures have been imposedagainst it, by Stock Exchanges or SEBI or any Statutory Authority, in <strong>the</strong> last three years.
Over<strong>view</strong> Performance Re<strong>view</strong>s Governance Financials43Annual Report 2010-11e) The policy of risk assessment is in place and <strong>the</strong> Management follows <strong>the</strong> procedures to inform <strong>the</strong> Board about <strong>the</strong> Risk Assessment. Theseprocedures are periodically re<strong>view</strong>ed to ensure that <strong>the</strong> Executive Management controls risk through properly defined framework, which is appliedto major activities and processes of <strong>the</strong> business and communicated throughout <strong>the</strong> organization.f) There were no material financial and commercial transactions where senior management of <strong>the</strong> Company had personal interest that may have apotential conflict with <strong>the</strong> interest of <strong>the</strong> Company at large.7. Subsidiary CompaniesThe Company has total four subsidiaries, which includes three foreign non-listed subsidiary companies namely, Myanmar Tractors Limited, Myanmar,TIL Overseas Pte. Limited, Singapore and Tractors Nepal Private Limited, Nepal and one Indian subsidiary namely, Tractors India Private Limited. TheManagement periodically brings to <strong>the</strong> attention of <strong>the</strong> Board of Directors all significant transactions and arrangements entered into by <strong>the</strong> subsidiarycompanies. The Audit Committee re<strong>view</strong>s <strong>the</strong> financial statements including <strong>the</strong> Investments made by <strong>the</strong>se subsidiary companies. The minutes of <strong>the</strong>Board Meetings of <strong>the</strong> subsidiary companies are also placed at <strong>the</strong> Board Meeting of <strong>the</strong> Company.8. Means of Communicationa) The Company had arranged to publish <strong>the</strong> quarterly results in <strong>the</strong> newspapers immediately after <strong>the</strong>y were taken on record by <strong>the</strong> Board ofDirectors and had <strong>the</strong> same displayed on its website www.<strong>til</strong><strong>india</strong>.in. The Company did not make any presentation to Institutional Investors orAnalysts. The Company’s financial results are normally published in prominent business dailies in English viz. Economic Times/Business Standardand a regional newspaper published in Bengali – Aajkal. Pursuant to amended Clause 52 of <strong>the</strong> Listing Agreement with <strong>the</strong> Stock Exchanges, <strong>the</strong>Company is also posting financial results and o<strong>the</strong>r shareholders’ related information in <strong>the</strong> Corporate Filing and Dissemination System (CFDS),viz., www.corpfiling.co.in.b) The Management Discussion and Analysis Report forms part of <strong>the</strong> Directors’ Report.9. General Shareholder Informationa) AGM: Date, time and venueForthcoming Annual General Meeting will be held on Tuesday, 26th July, 2011 at 10.00 AM at <strong>the</strong> Company’s Registered Office at 1, Taratolla Road,Garden Reach, Kolkata 700024.Financial Calendar (Tentative)Financial Reporting for <strong>the</strong> year ended 31st March, 2011 May, 2011Mailing of Annual Reports for 2010-2011 June, 2011Financial Reporting for <strong>the</strong> quarter ending 30th June, 2011 July, 2011Limited Re<strong>view</strong> Report for <strong>the</strong> quarter ending 30th June, 2011 July, 2011Financial Reporting for <strong>the</strong> quarter /half year ending 30th September, 2011. October, 2011Limited Re<strong>view</strong> Report for <strong>the</strong> half year ending 30th September, 2011 October, 2011Financial Reporting for <strong>the</strong> quarter ending 31st December, 2011 January, 2012Limited Re<strong>view</strong> Report for quarter ending 31st December, 2011 January, 2012Financial Reporting for <strong>the</strong> year ending 31st March, 2012 May, 2012b) Date of Book closureThe Share Transfer Books and Register of Members will remain closed from 19th July, 2011 to 26th July, 2011, both days inclusive.c) Dividend Payment date - On or about 2nd August, 2011.d) Listing on Stock ExchangesName of <strong>the</strong> Stock Exchange Address CodeThe Calcutta Stock Exchange Association Ltd. 7, Lyons Range, Kolkata-700 001 30148Bombay Stock Exchange Ltd. Phiroze Jeejeeboy Tower, Dalal Street, Fort, Mumbai-400 001 505196National Stock Exchange of India Ltd. Exchange Plaza, 5th Floor, Plot No.C/1, G-Block Bandra-Kurla Complex,Bandra (E), Mumbai 400 051.TIL-EQListing fees for <strong>the</strong> year 2011-12 have been paid to <strong>the</strong> Stock Exchanges.The International Security Identification Number (ISIN) is INE806C01018.
44e) Market Price DataMonths National Stock Exchange* Bombay Stock Exchange*High Low High LowApril 2010 445.00 333.10 445.00 330.00May 2010 506.90 375.00 507.80 392.00June 2010 534.40 455.00 534.00 458.00July 2010 579.90 502.50 579.90 491.00August 2010 604.00 530.10 604.80 532.00September 2010 675.00 555.00 663.80 553.50October 2010 748.00 565.00 748.90 565.00November 2010 754.00 610.00 750.05 606.00December 2010 734.00 625.00 735.00 625.10January 2011 735.00 540.00 737.90 544.95February 2011 586.80 491.15 584.00 500.00March 2011 564.80 475.00 565.25 473.00(`)* Where Equity Shares of <strong>the</strong> Company are regularly traded.Stock Performance of TIL Limited vs BSE and NSE Indices :Sensex Vs. Shareprice (April ‘10-March ‘11)Nifty Vs Shareprice (April ‘10-March ‘11)205162006419612191601870818256178041735216900Apr May Jun Jul Aug SepBSE SensexMonths776.00734.00692.00650.00608.00566.00524.00482.00440.00Oct Nov Dec Jan Feb MarPrice640060506100595058005650550053505200Apr May Jun Jul Aug SepNSC NiftyMonths760.00728.00696.00664.00632.00600.00568.00536.00504.00472.00440.00Oct Nov Dec Jan Feb MarPricef) Registrar and Share Transfer AgentsThe share management work, both physical and demat, is being handled by <strong>the</strong> Registrar and Share Transfer Agent of <strong>the</strong> Company whose nameand address are given below:C.B. Management Services (P) Ltd.,P-22, Bondel Road, Kolkata 700 019Telephone Numbers: 40116700, 40116711, 40116718, 40116723Fax Number: 033 2247 0263E-Mail: rta@cbmsl.comg) Share Transfer SystemShare Transfer requests, valid and complete in all respects are normally processed within 15 days from <strong>the</strong> date of receipt. The Board has delegated<strong>the</strong> powers to Share Transfer & Certificate Committee for expediting share transfer. Valid requests for demat/remat of shares are completedgenerally within 10 days from <strong>the</strong> date of demat/remat request. The Company’s shares are compulsorily traded in <strong>the</strong> dematerialized form.
Over<strong>view</strong> Performance Re<strong>view</strong>s Governance Financials45Annual Report 2010-11h) Shareholding Pattern as on 31st March, 2011Category of Shareholder Number of Shareholders Total Number of% PercentageShares HeldShareholding of Promoter and Promoter Group 23 5184603 51.69Mutual Funds/UTI 13 593767 5.92Financial Institutions/Banks 11 7553 0.07Insurance Companies 4 1638853 16.34Foreign Institutional Investors 4 164030 1.64Bodies Corporate 261 555118 5.53Non Resident Individuals 213 74038 0.74General Public 7213 1798747 17.94Trust 5 3130 0.03Clearing Member 51 10426 0.10Total 7798 10030265 100.00i) Distribution of shareholding as on 31st March, 2011Range / Category (Shares) No. of Shareholders % of Shareholders No. of Shares held % of Shares to totalshares1-500 7048 90.38 672264 6.70501-1000 370 4.74 287110 2.861001-2000 174 2.23 262157 2.612001-3000 76 0.98 190588 1.903001-4000 32 0.41 114820 1.154001-5000 14 0.18 66980 0.675001-10000 29 0.37 225120 2.2410001 & above 55 0.71 8211226 81.87Total 7798 100.00 10030265 100.00j) Dematerialisation of shares and liquidityThe Company has entered into agreements with NSDL and CDSL whereby shareholders have an option to dematerialize <strong>the</strong> shares with ei<strong>the</strong>r of<strong>the</strong> Depositories.Status as on 31st March, 2011 :Particulars No. of shares No. of shareholders % of CapitalNSDL 6942726 4414 69.22CDSL 498747 1861 4.97Physical 2588792 1523 25.81Total 10030265 7798 100.00k) Plant LocationsKamarhatty – 517, B.T. Road, Kolkata 700 058, West Bengal.Sahibabad – Plot No.11, Site-4, Sahibabad Industrial Area, Ghaziabad 201 010, Uttar Pradesh.
46l) Address for correspondenceRegistered Office:1, Taratolla Road, Garden Reach, Kolkata 700 024Phone Nos. (033) 2469-3732/36 (5 lines)Fax Nos. (033) 2469-2143/2469-3731Email – secretarial.department@<strong>til</strong><strong>india</strong>.comWebsite: www.<strong>til</strong><strong>india</strong>.in10. Code of ConductA Code of Conduct for <strong>the</strong> Board of Directors and Senior Managers has been formulated and adopted by <strong>the</strong> Board of Directors in <strong>the</strong> Meeting held on15th March, 2005. The Code of Conduct, as approved by <strong>the</strong> Board, is also posted on <strong>the</strong> Website of <strong>the</strong> Company. A declaration by <strong>the</strong> Vice Chairman &Managing Director (CEO) stating that all Board Members and Senior Management Personnel have complied with <strong>the</strong> Code of Conduct for <strong>the</strong> FinancialYear ended 31st March, 2011 forms part of <strong>the</strong> Annual Report.11. Risk Mitigation PlanThe Company has in place mechanisms to inform <strong>the</strong> Board Members about <strong>the</strong> risk assessment and minimization procedures and periodical re<strong>view</strong> by<strong>the</strong> Board is being done to ensure that management controls risk through means of a properly defined framework.12. CEO and CFO CertificationAs per Clause 49(V) of <strong>the</strong> Listing Agreement, a certificate duly signed by <strong>the</strong> Vice Chairman & Managing Director and <strong>the</strong> CFO, in respect of <strong>the</strong> financialyear ended 31st March, 2011 has been placed before <strong>the</strong> Board in <strong>the</strong> Meeting held on 17th May, 2011.13. Non-Mandatory Requirementsa) Office of Non Executive Chairman and tenure of office of Non Executive DirectorsThe Chairman of <strong>the</strong> Company being a Whole-time Director, <strong>the</strong> requirement relating to maintenance of Non-Executive Chairman’s office is notapplicable. Mr. R. L. Gaggar and Mr. U. V. Rao, all being Non-Executive Independent Directors, are holding office for a term exceeding ten years from<strong>the</strong> date of initial appointment. Mr. G. Swarup, Non Executive Independent Director was appointed w.e.f. 26th March, 2008 and Dr. T Mukherjee wasappointed w.e.f. 4th June, 2009.b) Remuneration and Compensation CommitteeThe Company has a ‘Remuneration and Compensation Committee’ in place. For details regarding composition and scope of RemunerationCommittee, please refer to Item No. 3 of this Report.c) Shareholder’s Rights – Furnishing of Half yearly ResultsAs <strong>the</strong> Company’s Half-yearly Results are published in newspapers and also posted on its Website viz. www.<strong>til</strong><strong>india</strong>.in and <strong>the</strong> corporate filing anddissemination system (CFDS), viz., www.corpfiling.co.in, <strong>the</strong> same are not mailed to <strong>the</strong> shareholders.d) Audit QualificationsThe Company does not have any audit qualification pertaining to <strong>the</strong> financial statements, for <strong>the</strong> period under re<strong>view</strong>.
Over<strong>view</strong> Performance Re<strong>view</strong>s Governance Financials47Annual Report 2010-11e) Training of Board MembersThe Company, at present, does not have any facility for <strong>the</strong> training of Board members in <strong>the</strong> Business model of <strong>the</strong> Company as well as in <strong>the</strong> riskprofile of <strong>the</strong> business parameters of <strong>the</strong> Company and in <strong>the</strong>ir responsibilities as Directors and <strong>the</strong> best ways to discharge <strong>the</strong>m.f) Mechanism for evaluating Non-Executive Board MembersThe Company, at present, does not have any mechanism for evaluating <strong>the</strong> performance of Non-Executive Directors by a peer group.g) Whistle Blower PolicyThe Company, at present, does not have any Whistle Blower Policy.Pursuant to Clause 49 of <strong>the</strong> Listing Agreement with <strong>the</strong> Stock Exchanges on Code of Corporate Governance, certificate from <strong>the</strong> StatutoryAuditors regarding compliance of Corporate Governance by <strong>the</strong> Company is annexed. The Auditors’ certificate will be sent to <strong>the</strong> Stock Exchangeswhere <strong>the</strong> Company’s shares are listed.For and on behalf of Board of DirectorsPlace : KolkataDate : 17th May, 2011.A. MazumdarChairman
48Certificate of Compliance of <strong>the</strong> Code of Conduct of <strong>the</strong> CompanyThis is to confirm that a Code of Conduct for <strong>the</strong> Board Members and Senior Management Personnel of <strong>the</strong> Company has been adopted by <strong>the</strong> Company. The Codeof Conduct as adopted by <strong>the</strong> Board was also circulated and posted on <strong>the</strong> Website of <strong>the</strong> Company. The Company received declarations affirming complianceof <strong>the</strong> Code from <strong>the</strong> Directors and Senior Managers of <strong>the</strong> Company for <strong>the</strong> Financial Year ended 31st March, 2011. The same has also been noted by <strong>the</strong> Boardin its Meeting held on 17th May, 2011.TIL LIMITEDS. MAZUMDERVICE CHAIRMAN & MANAGING DIRECTORPlace: KolkataDate: 17th May, 2011
Over<strong>view</strong> Performance Re<strong>view</strong>s Governance Financials49Annual Report 2010-11Auditors’ Certificate regarding compliance of conditions of Corporate GovernanceTo <strong>the</strong> Members of TIL LIMITEDWe have examined <strong>the</strong> compliance of conditions of Corporate Governance by TIL Limited, for <strong>the</strong> year ended 31st March, 2011, as stipulated in Clause 49 of <strong>the</strong>Listing Agreement of <strong>the</strong> said Company with stock exchanges in India.The compliance of conditions of Corporate Governance is <strong>the</strong> responsibility of <strong>the</strong> Company’s management. Our examination was carried out in accordancewith <strong>the</strong> Guidance Note on Certification of Corporate Governance (as stipulated in Clause 49 of <strong>the</strong> Listing Agreement), issued by <strong>the</strong> Institute of CharteredAccountants of India and was limited to procedures and implementation <strong>the</strong>reof, adopted by <strong>the</strong> Company for ensuring <strong>the</strong> compliance of <strong>the</strong> conditions ofCorporate Governance. It is nei<strong>the</strong>r an audit nor an expression of opinion of <strong>the</strong> financial statements of <strong>the</strong> Company.In our opinion and to <strong>the</strong> best of our information and according to <strong>the</strong> explanations given to us, we certify that <strong>the</strong> Company has complied with <strong>the</strong> conditions ofCorporate Governance as stipulated in <strong>the</strong> above mentioned Listing Agreement.We state that such compliance is nei<strong>the</strong>r an assurance as to <strong>the</strong> future viability of <strong>the</strong> Company nor <strong>the</strong> efficiency or effectiveness with which <strong>the</strong> managementhas conducted <strong>the</strong> affairs of <strong>the</strong> Company.For Price WaterhouseFirm Registration Number - 301112EChartered AccountantsP. LawPlace: KolkataPartnerDate: 17th May, 2011 Membership Number – 51790
50Ten Years Financial Highlights(` in ‘000)2010-11 2009-10 2008-09 2007-08 2006-07 2005-06 2004-05 2003-04 2002-03 2001-02 2000-011 Share Capital 100,303 100,303 100,303 100,303 97,301 122,211 137,306 137,306 97,301 97,236 97,2362 Share Warrant - - 87,815 87,815 - - - - - - -3 Reserves & Surplus 2,123,137 1,882,668 1,397,943 1,123,720 754,929 629,501 547,768 500,270 518,876 517,350 514,4934 Net Worth 2,223,440 * 1,982,971 * 1,586,061 * 1,311,838 * 852,230 * 751,712 * 685,074 * 637,576 * 616,177 * 614,586 * 611,7295 Borrowings 440,925 1,093,818 1,134,290 787,561 846,020 1,241,288 1,165,053 1,038,908 1,044,076 1,093,858 959,2026 Funds Employed 2,664,365 3,076,789 2,720,351 2,099,399 1,698,250 1,993,000 1,850,127 1,676,484 1,660,253 1,708,444 1,570,9317 Gross Block 1,438,828 1,912,860 1,609,642 1,411,669 1,233,473 1,244,038 1,150,192 818,842 799,248 691,938 657,2608 Depreciation 519,342 822,817 688,940 578,655 502,996 459,573 383,040 303,200 299,582 234,771 205,3659 Net Block 919,486 1,090,043 920,702 833,014 730,477 784,465 767,152 515,642 499,666 457,167 451,89510 Investments 1,038,567 74,972 74,866 74,866 74,866 44,906 54,042 54,042 54,042 54,042 51,48111 Sales 2,161,442 8,245,861 8,327,483 7,175,289 5,686,866 4,544,037 3,214,343 2,739,745 2,682,644 2,473,134 2,324,78312 O<strong>the</strong>r Income 211,895 633,481 430,433 379,595 283,862 270,569 291,298 248,268 106,630 79,883 76,47713 Expenses 558,193 1,523,996 1,513,501 1,083,886 919,126 798,157 757,221 733,812 695,686 554,153 549,37214 Depreciation 41,608 168,928 143,203 114,045 112,181 119,626 81,237 49,773 23,702 21,461 18,22015 Profit Before Tax 420,078 754,860 505,704 502,533 286,313 188,480 100,372 83,872 20,349 40,384 22,05616 Taxation- Current Tax 142,009 257,500 176,500 155,850 104,000 67,500 29,500 15,780 1,384 5,000 1,803- Deferred Tax (33,890) 28,728 (2,504) 16,950 (7,383) (7,183) 3,100 12,320 3,411 10,160 -- Fringe Benefit Tax 9,000 7,300 6,000 9,650 - - - - -17 Profit After Tax 311,959 468,632 322,708 322,433 183,696 118,513 67,772 55,772 15,554 25,224 20,25318 Dividend 60,182 60,182 40,121 40,121 29,277 21,909 15,163 8,967 - - 9,724* Including Revaluation Reserve, Intangible Assets but exclulding Deffered Tax credit
Over<strong>view</strong> Performance Re<strong>view</strong>s Governance Financials51Annual Report 2010-11Auditors’ Report to <strong>the</strong> Members of TIL Limited1. We have audited <strong>the</strong> attached Balance Sheet of TIL Limited (<strong>the</strong> ‘Company’)as at 31st March, 2011, and <strong>the</strong> related Profit and Loss Account and <strong>the</strong> CashFlow Statement for <strong>the</strong> year ended on that date annexed <strong>the</strong>reto, which we have signed under reference to this report. These financial statements are <strong>the</strong>responsibility of <strong>the</strong> Company’s management. Our responsibility is to express an opinion on <strong>the</strong>se financial statements based on our audit.2. We conducted our audit in accordance with auditing standards generally accepted in India. Those Standards require that we plan and perform <strong>the</strong>audit to obtain reasonable assurance about whe<strong>the</strong>r <strong>the</strong> financial statements are free of material misstatement. An audit includes, examining on a testbasis, evidence supporting <strong>the</strong> amounts and disclosures in <strong>the</strong> financial statements. An audit also includes assessing <strong>the</strong> accounting principles usedand significant estimates made by management, as well as evaluating <strong>the</strong> overall financial statement presentation. We believe that our audit providesreasonable basis for our opinion.3. As required by <strong>the</strong> Companies (Auditor’s Report) Order, 2003, as amended by <strong>the</strong> Companies (Auditor’s Report) (Amendment) Order,2004 (toge<strong>the</strong>r <strong>the</strong>‘Order’), issued by <strong>the</strong> Central Government of India in terms of sub-section (4A) of Section 227 of ‘The Companies Act, 1956’ of India (<strong>the</strong> ‘Act’) and on <strong>the</strong>basis of such checks of <strong>the</strong> books and records of <strong>the</strong> Company as we considered appropriate and according to <strong>the</strong> information and explanations given tous, we give in <strong>the</strong> Annexure a statement on <strong>the</strong> matters specified in paragraphs 4 and 5 of <strong>the</strong> Order.4. Fur<strong>the</strong>r to our comments in <strong>the</strong> Annexure referred to in paragraph 3 above, we report that:a) We have obtained all <strong>the</strong> information and explanations which, to <strong>the</strong> best of our knowledge and belief, were necessary for <strong>the</strong> purposes of our audit;b) In our opinion, proper books of account as required by law have been kept by <strong>the</strong> Company so far as appears from our examination of those books;c) The Balance Sheet, <strong>the</strong> Profit and Loss Account and <strong>the</strong> Cash Flow Statement dealt with by this report are in agreement with <strong>the</strong> books of account;d) In our opinion, <strong>the</strong> Balance Sheet, <strong>the</strong> Profit and Loss Account and <strong>the</strong> Cash Flow Statement dealt with by this report comply with <strong>the</strong> applicableaccounting standards referred to in sub-section (3C) of Section 211 of <strong>the</strong> Act;e) On <strong>the</strong> basis of written representations received from <strong>the</strong> directors , as on 31st March, 2011, and taken on record by <strong>the</strong> Board of Directors, none of<strong>the</strong> directors is disqualified as on 31st March, 2011 from being appointed as a director in terms of clause (g) of sub – section (1) of Section 274 of<strong>the</strong> Act;f) In our opinion and to <strong>the</strong> best of our information and according to <strong>the</strong> explanations given to us, <strong>the</strong> said financial statements toge<strong>the</strong>r with <strong>the</strong> notes<strong>the</strong>reon and attached <strong>the</strong>reto give, in <strong>the</strong> prescribed manner, <strong>the</strong> information required by <strong>the</strong> Act, and give a true and fair <strong>view</strong> in conformity with<strong>the</strong> accounting principles generally accepted in India :i) in <strong>the</strong> case of <strong>the</strong> Balance Sheet, of <strong>the</strong> state of affairs of <strong>the</strong> Company as at 31st March, 2011;ii)iii)in <strong>the</strong> case of <strong>the</strong> Profit and Loss Account, of <strong>the</strong> profit for <strong>the</strong> year ended on that date; andin <strong>the</strong> case of Cash Flow Statement, of <strong>the</strong> cash flows for <strong>the</strong> year ended on that date.For Price WaterhouseFirm Registration Number - 301112EChartered AccountantsP. LawPlace: KolkataPartnerDate: 17th May, 2011 Membership Number – 51790
52Annexure To Auditors’ ReportReferred to in Paragraph 3 of <strong>the</strong> Auditors’ Report of even date to <strong>the</strong> Members of TIL Limited on <strong>the</strong> Financial Statements for <strong>the</strong>year ended 31st March, 2011.1. (a) The Company has maintained proper records showing full particulars, including quantitative details and situation, of fixed assets.(b)(c)The fixed assets of <strong>the</strong> Company are physically verified by <strong>the</strong> management according to a phased programme designed to cover all <strong>the</strong> items overa period of three years, which in our opinion, is reasonable having regard to <strong>the</strong> size of <strong>the</strong> Company and <strong>the</strong> nature of its assets. Pursuant to <strong>the</strong>programme, a portion of <strong>the</strong> fixed assets has been physically verified by <strong>the</strong> management during <strong>the</strong> year and no material discrepancies between <strong>the</strong>book records and <strong>the</strong> physical inventory have been noticed.During <strong>the</strong> year, <strong>the</strong> Company has transferred a substantial part of its fixed assets forming part of <strong>the</strong> undertaking pertaining to <strong>the</strong> dealership businessof caterpillar pursuant to a Scheme of Arrangement as indcated in Note 13 on Schedule ‘O’ to <strong>the</strong> accounts. On <strong>the</strong> basis of our examination of <strong>the</strong> booksand records of <strong>the</strong> Company, and according to <strong>the</strong> explanations given to us, in our opinion, <strong>the</strong> transfer of <strong>the</strong> said fixed assets has not affected <strong>the</strong> goingconcern status of <strong>the</strong> Company.2. (a) The inventory of <strong>the</strong> Company (o<strong>the</strong>r than stocks with third parties) has been physically verified by <strong>the</strong> management during <strong>the</strong> year. In respect ofinventory lying with third parties, <strong>the</strong>se have substantially been confirmed by <strong>the</strong>m. In our opinion, <strong>the</strong> frequency of verification is reasonable.(b)(c)In our opinion, <strong>the</strong> procedures of physical verification of inventory followed by <strong>the</strong> management are reasonable and adequate in relation to <strong>the</strong> size of <strong>the</strong>Company and <strong>the</strong> nature of its business.On <strong>the</strong> basis of our examination of <strong>the</strong> inventory records, in our opinion, <strong>the</strong> Company has maintained proper records of inventory. The discrepanciesnoticed on physical verification of inventory as compared to book records were not material.3. (a) The Company has not granted any loans, secured or unsecured, to companies, firms or o<strong>the</strong>r parties covered in <strong>the</strong> register maintained under Section 301of <strong>the</strong> Act.(b)The Company has not taken any loans, secured or unsecured, from companies, firms or o<strong>the</strong>r parties covered in <strong>the</strong> register maintained under Section301 of <strong>the</strong> Act.4. In our opinion and according to <strong>the</strong> information and explanations given to us, <strong>the</strong>re is an adequate internal control system commensurate with <strong>the</strong> size of <strong>the</strong>Company and <strong>the</strong> nature of its business, for <strong>the</strong> purchase of inventory, fixed assets and for <strong>the</strong> sale of goods and services. Fur<strong>the</strong>r, on <strong>the</strong> basis of our examination
Over<strong>view</strong> Performance Re<strong>view</strong>s Governance Financials53Annual Report 2010-11of <strong>the</strong> books and records of <strong>the</strong> Company, and according to <strong>the</strong> information and explanations given to us, we have nei<strong>the</strong>r come across nor have been informedof any continuing failure to correct major weaknesses in <strong>the</strong> aforesaid internal control system.5. According to <strong>the</strong> information and explanations given to us, <strong>the</strong>re have been no contracts or arrangements referred to in Section 301 of <strong>the</strong> Act during <strong>the</strong> yearto be entered in <strong>the</strong> register required to be maintained under that Section. Accordingly, <strong>the</strong> question of commenting on transactions made in pursuance of suchcontracts or arrangements does not arise.6. In our opinion and according to <strong>the</strong> information and explanations given to us, <strong>the</strong> Company has complied with <strong>the</strong> provisions of Sections 58A and 58AA or anyo<strong>the</strong>r relevant provisions of <strong>the</strong> Act and <strong>the</strong> Companies (Acceptance of Deposits) Rules, 1975, as applicable, with regard to deposits accepted from <strong>the</strong> public.According to <strong>the</strong> information and explanations given to us, no order under <strong>the</strong> aforesaid sections has been passed by <strong>the</strong> Company Law Board or NationalCompany Law Tribunal or Reserve Bank of India or any Court or any o<strong>the</strong>r Tribunal on <strong>the</strong> Company in respect of <strong>the</strong> aforesaid deposits.7. In our opinion, <strong>the</strong> Company has an internal audit system commensurate with its size and nature of its business.8. The Central Government of India has not prescribed <strong>the</strong> maintenance of cost records under clause (d) of sub-section (1) of Section 209 of <strong>the</strong> Act, for any of<strong>the</strong> products of <strong>the</strong> Company.9 (a) According to <strong>the</strong> information and explanations given to us and records of <strong>the</strong> Company examined by us, in our opinion, <strong>the</strong> Company is regular indepositing during <strong>the</strong> year <strong>the</strong> undisputed statutory dues including Provident Fund, Investor Education and Protection Fund, Employees’ State Insurance,Income Tax, Sales Tax, Wealth Tax, Service Tax, Customs Duty, Excise Duty, Cess and o<strong>the</strong>r material statutory dues, as applicable, with <strong>the</strong> appropriateauthorities.(b)According to <strong>the</strong> information and explanations given to us and <strong>the</strong> records of <strong>the</strong> Company examined by us, <strong>the</strong> particulars of dues of Income Tax, Sales Tax,Wealth Tax, Service Tax, Customs Duty, Excise Duty and Cess as at 31st March, 2011 as applicable, which have not been deposited on account of a dispute,are as follows :
54Name of <strong>the</strong> Statute Nature of Dues Amount (` in Forum where dispute is pendinglacs) [net ofpayments]The Central Sales Tax Act, 1956 Sales Tax dues for <strong>the</strong> Period 1996-98 1.65 The Commercial Taxes Tribunal ,GhaziabadThe Central Sales Tax Act, 1956 Sales Tax dues for <strong>the</strong> Period 2007-08 73.93 The Additional Commissioner (Appeals)Commercial Taxes, KolkataThe West Bengal Value Added Tax Act,2003Sales Tax dues for <strong>the</strong> Period 2007-08278.34 The Additional Commissioner (Appeals)Commercial Taxes, KolkataThe Uttar Pradesh Trade Tax Act, 1948 Entry Tax dues for <strong>the</strong> year 2004-05 6.48 The Commercial Taxes Tribunal ,GhaziabadThe Uttar Pradesh Trade Tax Act, 1948 Sales Tax dues for <strong>the</strong> year 2007-08 2.58 The Additional Commissioner (Appeals),Ghaziabad, Uttar PradeshThe Income tax Act, 1961 Income tax dues for <strong>the</strong> assessment year 2004-05 10.00 Commissioner of Income-tax (Appeals)The Income tax Act, 1961 Income tax dues for <strong>the</strong> assessment year 2006-07 1.35 Commissioner of Income-tax (Appeals)The Income tax Act, 1961 Income tax dues for <strong>the</strong> assessment year 2007-08 6.74 Commissioner of Income-tax (Appeals)The Income tax Act, 1961 Income tax dues for <strong>the</strong> assessment year 2008-09 109.81 Commissioner of Income-tax (Appeals)The Central Excise Act, 1944Dispute regarding Duty Exemption Certificate19.46 Commissioner of Central Excise (Appeals)produced by Ministry of Defence for <strong>the</strong> year2007-08The Central Excise Act, 1944Dispute Regarding eligibility of exemption benefit23.69 Commissioner of Central Excise (Appeals)for <strong>the</strong> year 2010-11Finance Act, 1944Dispute regarding applicability of Service Tax on69.28 Commissioner of Central Excise (Appeals)payment of Royalty and Technical Know how feesfor <strong>the</strong> period 2005-08Finance Act, 1994Dispute regarding service tax on commissionreceived for <strong>the</strong> year 2007-0823.56 Commissioner of Central Excise (Appeals)
Over<strong>view</strong> Performance Re<strong>view</strong>s Governance Financials55Annual Report 2010-1110. The Company has no accumulated losses as at 31st March, 2011, and it has not incurred any cash losses in <strong>the</strong> financial year ended on that date or in <strong>the</strong>immediately preceding financial year.11. According to <strong>the</strong> records of <strong>the</strong> Company examined by us and <strong>the</strong> information and explanations given to us, <strong>the</strong> Company has not defaulted in repaymentof dues to any financial institution or bank or debenture holders as at <strong>the</strong> Balance Sheet date.12. The Company has not granted any loans and advances on <strong>the</strong> basis of security by way of pledge of shares, debentures and o<strong>the</strong>r securities.13. Provisions of any special statute applicable to chit fund/ nidhi/ mutual benefit fund/ societies are not applicable to <strong>the</strong> Company.14. In our opinion, <strong>the</strong> Company is not a dealer or trader in shares, securities, debentures and o<strong>the</strong>r investments.15. In our opinion, and according to <strong>the</strong> information and explanations given to us, <strong>the</strong> terms and conditions of <strong>the</strong> guarantees given by <strong>the</strong> Company, for loanstaken by o<strong>the</strong>rs from banks or financial institutions, are not prejudicial to <strong>the</strong> interest of <strong>the</strong> Company.16. In our opinion, and according to <strong>the</strong> information and explanations given to us, on an overall basis, <strong>the</strong> term loans have been applied for <strong>the</strong> purposes forwhich <strong>the</strong>y were obtained.17. On <strong>the</strong> basis of an overall examination of <strong>the</strong> Balance Sheet of <strong>the</strong> Company, in our opinion and according to <strong>the</strong> information and explanations given to us,<strong>the</strong>re are no funds raised on short term basis which have been used for long term investment.18. The Company has not made any preferential allotment of shares to parties and companies covered in <strong>the</strong> register maintained under Section 301 of <strong>the</strong> Actduring <strong>the</strong> year.19. The Company had nei<strong>the</strong>r any outstanding debenture at <strong>the</strong> beginning of <strong>the</strong> year nor has it issued any debenture during <strong>the</strong> year and accordingly, <strong>the</strong>question of creation of security or charges in this respect does not arise.20. The Company has not raised any money by public issue during <strong>the</strong> year.21. During <strong>the</strong> course of our examination of <strong>the</strong> books and records of <strong>the</strong> Company, carried out in accordance with <strong>the</strong> generally accepted auditing practicesin India, and according to <strong>the</strong> information and explanations given to us, we have nei<strong>the</strong>r come across any instance of fraud on or by <strong>the</strong> Company, noticedor reported during <strong>the</strong> year, nor have we been informed of such case by <strong>the</strong> management.22. The o<strong>the</strong>r clauses, (iii)(b), (iii)(c), (iii)(d), (iii)(f), (iii)(g) and (v)(b) of paragraph 4 of <strong>the</strong> Companies (Auditor’s Report) Order 2003 as amended by <strong>the</strong>Companies (Auditor’s Report) (Amendment) Order, 2004, are not applicable in <strong>the</strong> case of <strong>the</strong> Company for <strong>the</strong> current year, since in our opinion <strong>the</strong>re isno matter which arises to be reported in <strong>the</strong> aforesaid order.For Price WaterhouseFirm Registration Number - 301112EChartered AccountantsP. LawPlace : KolkataPartnerDate : 17th May, 2011 Membership Number – 51790
56Balance Sheet as at 31st March, 2011(` in ‘000)Schedule As at 31.03.2011 As at 31.03.2010SOURCES OF FUNDS1. Shareholders’ Funds(a) Capital A 100,303 100,303(b) Reserves and Surplus B 2,123,137 1,882,6682,223,440 1,982,9712. Loan Funds C(a) Secured Loans 440,925 499,000(b) Unsecured Loans - 594,818440,925 1,093,8183. Deferred Tax Liability (Net) (Note 17 of Schedule ‘O’) 25,784 59,674Total 2,690,149 3,136,463APPLICATIONS OF FUNDS1. Fixed Assets E(a) Gross Block 1,438,828 1,912,860(b) Less : Depreciation 519,342 822,817(c) Net Block 919,486 1,090,043(d) Capital Work-in-Progress 86,447 195,3641,005,933 1,285,4072. Investments F 1,038,567 74,9723. Current Assets,Loans and Advances(a) Inventories G 599,007 1,465,139(b) Sundry Debtors H 463,854 1,533,793(c) Cash and Bank Balances I 2,426 1,826(d) O<strong>the</strong>r Current Assets J 61,388 121,425(e) Loans and Advances K 1,049,968 934,0482,176,643 4,056,231Less : Current Liabilities and ProvisionsD(a) Liabilities 458,398 1,344,089(b) Provisions 1,072,596 936,0581,530,994 2,280,147Net Current Assets 645,649 1,776,084Total 2,690,149 3,136,463NotesOThe Schedules referred to above form an integral part of <strong>the</strong> Balance Sheet.This is <strong>the</strong> Balance Sheet referred to in our report of even date.For PRICE WATERHOUSEFirm Registration No. 301112EChartered AccountantsP.LawPartnerMembership Number 51790Kolkata17th May, 2011For and on behalf of Board of DirectorsA. MazumdarChairmanSumit MazumderVice Chairman & Managing DirectorSekhar BhattacharjeeCompany Secretary
Over<strong>view</strong> Performance Re<strong>view</strong>s Governance Financials57Annual Report 2010-11Profit & Loss Account for <strong>the</strong> year ended 31st March, 2011(` in ‘000)Schedule Year Ended 31.03.2011 Year Ended 31.03.2010INCOMESales and Services (Net) 2,033,556 8,107,502Selling Commission Earned 23,260 219,589Rental from Machinery - 188,735O<strong>the</strong>r Income L 188,635 225,1572,245,451 8,740,983EXPENDITURECost of Materials and Direct Manufacturing Expenses M 1,225,572 6,293,199Expenses N 534,274 1,364,0461,759,846 7,657,245Interest on :Fixed Loans 2,026 32,390O<strong>the</strong>rs 21,893 127,56023,919 159,950Depreciation and Amortisation 43,153 170,473Less : Transfer from Revaluation Reserve 1,545 1,545(Note 3 on Schedule ‘O’) 41,608 168,928Sales and Services (Gross) ( Note 14.1 on Schedule ‘O’ )Less : Excise Duty ( Note 14.2 on Schedule ‘O’ )2,161,442127,8868,245,861138,359Total Profit Before Taxation 420,078 754,860Profit from continuing operations before tax 420,078 420,602Less : Provision for Taxation :Current Tax 142,009 143,485Deferred Tax Charge/(Credit) (33,890) 15,993108,119 159,478Profit from continuing operations after tax 311,959 261,124Profit from discontinuing operations before tax - 334,258Less : Provision for Taxation :Current Tax - 114,015Deferred Tax Charge/(Credit) - 12,735- 126,750Profit from discontinuing operations after tax - 207,508Total Profit After Taxation 311,959 468,632Add : Balance of Profit and Loss Accountbrought forward from previous year 1,275,078 923,486Balance Available For Appropriations 1,587,037 1,392,118APPROPRIATIONSGeneral Reserve 31,196 46,863Proposed Dividend :Equity Shares 60,182 60,182Tax on Dividend 9,763 9,995Balance Carried Forward 1,485,896 1,275,0781,587,037 1,392,118Earnings Per Share - (Note 5 on Schedule ‘O’)Basic (`) 31.10 46.72Diluted (`) 31.10 46.72NotesOThe Schedules referred to above form an integral part of <strong>the</strong> Profit and Loss Account.This is <strong>the</strong> Profit and Loss Account referred to in our report of even date.For PRICE WATERHOUSEFirm Registration No. 301112EChartered AccountantsP.LawPartnerMembership Number 51790Kolkata17th May, 2011For and on behalf of Board of DirectorsA. MazumdarChairmanSumit MazumderVice Chairman & Managing DirectorSekhar BhattacharjeeCompany Secretary
58Schedule forming part of <strong>the</strong> Balance Sheet(` in ‘000)As at 31.03.2011 As at 31.03.2010SCHEDULE ‘A’Share CapitalAuthorised20,000,000 Equity Shares of ` 10/- each 200,000 200,000200,000 200,000Issued, Subscribed and Paid up10,030,265 Equity Shares of ` 10/- each fully paid up (Note below) 100,303 100,303Total 100,303 100,303Note: Of <strong>the</strong> above Equity Shares, 1,992,078 Shares were allotted as fully paid up, pursuant to a scheme of amalgamation in October,1984, without paymentbeing received in cash.(` in ‘000)As at 31.03.2010 Additions Deductions As at 31.03.2011SCHEDULE ‘B’Reserves and SurplusCapital Reserve 87,834 - - 87,834Capital Redemption Reserve 40,005 - - 40,005Securities Premium Account 193,377 - - 193,377Revaluation Reserve 70,445 - 1,545 68,900(Note 3 on Schedule ‘O’)Amalgamation Reserve 2,045 - - 2,045Development Rebate Reserve 84 - - 84General Reserve 213,800 31,196 - 244,996607,590 31,196 1,545 637,241Profit and Loss Account 1,275,078 210,818 - 1,485,896Total 1,882,668 242,014 1,545 2,123,137(` in ‘000)As at 31.03.2011 As at 31.03.2010SCHEDULE ‘C’Loan Funds(a) Secured LoansCash Credit/ Working Capital Demand LoansFrom Banks387,850 214,856[Secured by a first pari passu charge on all <strong>the</strong> current assets of <strong>the</strong> Company (namely Stocks,Bills Receivable and Book Debts) and a second pari passu charge on all movables (excludingsuch movables as may be agreed by Consortium Bankers from time to time) fixed assets of <strong>the</strong>Company, both present and future and on certain immovable properties of <strong>the</strong> Company undera joint deed of hypo<strong>the</strong>cation between <strong>the</strong> Company and its Consortium Bankers.]Interest accrued and due 217 2,086Term LoansFrom BanksIn Indian Rupee (Repayable within one year ` 10,000 thousand) 45,000 59,560
Over<strong>view</strong> Performance Re<strong>view</strong>s Governance Financials59Annual Report 2010-11Schedule forming part of <strong>the</strong> Balance SheetSCHEDULE ‘C’ (CONTD.)(` in ‘000)As at 31.03.2011 As at 31.03.2010In Foreign Currency - 221,117[Term Loans are secured by equitable mortgage on certain immovable properties of <strong>the</strong>Company and by first pari passu charge on all movable properties of <strong>the</strong> Company, bothpresent and future, and second pari passu charge on <strong>the</strong> current assets of <strong>the</strong> Company, bothpresent and future.]Interest accrued and due on term loans 470 1,381Vehicle LoansFrom Non Banking Financial Company 7,388 -(Repayable within one year ` 3,270 thousand) [Vehicle loans are secured by hypo<strong>the</strong>cation of<strong>the</strong> vehicles financed.]Total 440,925 499,000(b) Unsecured Loans (Short Term)From BanksIn Indian Rupee - 200,000In Foreign Currency - 394,718From O<strong>the</strong>rs - 100Total - 594,818(` in ‘000)As at 31.03.2011 As at 31.03.2010SCHEDULE ‘D’Current Liabilities and ProvisionsCurrent Liabilities :Sundry Creditors (Note 11 on Schedule ‘O’ ) 335,077 941,675Advance from Customers and o<strong>the</strong>rs 35,402 166,458Investor Education and Protection Fund (<strong>the</strong> Fund)shall be credited by <strong>the</strong> following amount :Unclaimed/Unpaid Dividends @ 1,709 1,216Unclaimed/Unpaid Matured Deposits @ 10 10Security Deposit from Customers 77 23,611O<strong>the</strong>r Liabilities 86,060 208,449Interest accrued but not due on Loans 63 2,670458,398 1,344,089Provisions for :Accrued Leave Encashment Benefit for employees 24,482 29,721Provision for Taxation 978,169 836,160Proposed Dividend :On Equity Shares 60,182 60,182Tax on Dividend 9,763 9,9951,072,596 936,058Total 1,530,994 2,280,147@ No amount is due at <strong>the</strong> period end for credit to <strong>the</strong> Fund.
60Schedule forming part of <strong>the</strong> Balance SheetSCHEDULE ‘E’Fixed Assets Gross Block Depreciation Net BlockCost /Valuationas at31.03.2010Transferred to TIPLvide Scheme of ofArrangement(Note 13 onSchedule ‘O’)Additions/Adjustmentduring <strong>the</strong>yearSales/Adjustmentduring <strong>the</strong>yearCost /Valuationas at31.03.2011As at31.03.2010Transferred toTIPL vide Schemeof Arrangement(Note 13 onSchedule ‘O’)For <strong>the</strong>yearOn Sales/Adjustmentduring <strong>the</strong>yearAs at31.03.2011As at31.03.2011(` in ‘000)Tangible AssetsFreehold Land 39,543 - 152,219 - 191,762 - - - - - 191,762 39,543Leasehold Land 45,112 2,503 288,200 - 330,809 6,049 356 1,599 - 7,292 323,517 39,063Buildings :Leasehold 132,010 76,163 2,048 - 57,895 22,950 2,835 1,057 - 21,172 36,723 109,060Freehold 106,379 - 96,375 - 202,754 44,217 - 2,045 - 46,262 156,492 62,162Plant and Machinery 1,315,382 891,946 8,030 5,469 425,997 577,668 317,155 25,160 5,474 280,199 145,798 737,714Furniture and Equipment 128,723 36,103 5,553 4,749 93,424 63,405 8,590 8,429 4,726 58,518 34,906 65,318Motor Vehicles and Motor Cycle 41,742 22,585 10,357 677 28,837 15,174 7,012 1,840 480 9,522 19,315 26,568Sub Total 1,808,891 1,029,300 562,782 10,895 1,331,478 729,463 335,948 40,130 10,680 422,965 908,513 1,079,428Intangible Assets(acquired items)Technical Know-how93,506 - 3,844 - 97,350 83,354 - 3,023 - 86,377 10,973 10,152[Note 12 on Schedule ‘O’]Software 10,463 - - 463 10,000 10,000 - - - 10,000 - 463Sub Total 103,969 - 3,844 463 107,350 93,354 - 3,023 - 96,377 10,973 10,615Total 1,912,860 1,029,300 566,626 11,358 1,438,828 822,817 335,948 43,153 10,680 519,342 919,486 1,090,043Capital Work-in-Progress 31,025 86,447* 195,364**Grand Total 1,912,860 1,060,325 566,626 11,358 1,438,828 822,817 335,948 43,153 10,680 519,342 1,005,933 1,285,407Previous year 1,609,642 - 387,622 84,404 1,912,860 688,940 - 170,473 36,596 822,817As at31.03.2010* Represents expenditure on New Project** Includes ` 163,664 thousand on New ProjectRefer Note 3 on Schedule ‘O’
Over<strong>view</strong> Performance Re<strong>view</strong>s Governance Financials61Annual Report 2010-11Schedule forming part of <strong>the</strong> Balance SheetSCHEDULE ‘F’Investments - Long Term - At CostTrade - Unquoted :Subsidiary :Myanmar Tractors LimitedTractors Nepal Private LimitedShares of Kyats 1000/- each fully paid (equivalent toUS$ 168.55 each)Shares of Nepalese Rupees 100/- each fully paid(83,200 Shares subscribed during <strong>the</strong> year)(` in ‘000)As at 31.03.2011 As at 31.03.2010Number Value Number Value19,714 41,625 19,714 41,625120,000 7,500 36,800 2,300TIL Overseas Pte Limited Shares of Singapore $10 each fully paid 107,577 30,222 107,577 30,222Tractors India Private Ltd.Shares of ` 10/- each fully paid [4,489,430 Shares 4,500,000 958,501 10,570 106acquired during <strong>the</strong> year pursuant to Scheme ofArrangement(Note 13 on Schedule ‘O’)]O<strong>the</strong>r than Trade :Quoted :Eveready IndustriesShares of ` 5/- each fully paid 1,266 180 1,266 180India LimitedMcleod Russel India Limited Shares of ` 5/- each fully paid 1,266 181 1,266 181Bank of India Shares of ` 10/- each fully paid 7,900 356 7,900 356Unquoted :Woodlands Multispeciality Hospital Limited 1/2 % Debentures of ` 100/-20 2 20 2each fully paidGulshan Villa Premises Co-operative Shares of ` 50/- each fully paid10 10Society Limited(` 500/-)Total 1,038,567 74,972Aggregate book value of investmentsQuoted 717 717Unquoted 1,037,850 74,255Total 1,038,567 74,972Aggregate market value of quotedinvestments3,332 3,106(` in ‘000)As at 31.03.2011 As at 31.03.2010SCHEDULE ‘G’Inventories (Note 2.5 On Schedule ‘O’)Stores 6,414 5,335Loose tools - 11,808Raw Materials [including in Transit ` 10,233 thousand (Previous year ` 5,109 thousand)] 327,050 250,402Stock-in-Trade 149,479 1,038,693Work-in-Progress 116,064 158,901Total 599,007 1,465,139
62Schedule forming part of <strong>the</strong> Balance Sheet(` in ‘000)As at 31.03.2011 As at 31.03.2010SCHEDULE ‘H’Sundry Debtors (Unsecured-Considered Good)Debts outstanding for more than Six Months 60,540 94,356O<strong>the</strong>r Debts 403,314 1,439,437Total 463,854 1,533,793(` in ‘000)As at 31.03.2011 As at 31.03.2010SCHEDULE ‘I’Cash and Bank BalancesCash in hand 188 316Balance with Scheduled BanksOn Current Accounts 519 284On Dividend Accounts 1,709 1,216On Fixed Deposit 10 10Total 2,426 1,826(` in ‘000)As at 31.03.2011 As at 31.03.2010SCHEDULE ‘J’O<strong>the</strong>r Current Assets (Unsecured-Considered Good)Claims Receivable 29,119 78,065[including ` 6,477 thousand ( Previous year ` 1,073 thousand ) with Custom, Excise, Port TrustAuthorities]Accrued duty benefits pertaining to Exports/ Deemed Exports 11,577 6,934Deposits[including ` 251 thousand ( Previous year ` 390 thousand ) with Custom, Excise, Port TrustAuthorities ]20,692 36,426Total 61,388 121,425SCHEDULE ‘K’Loans and Advances (Unsecured-Considered Good)Advances recoverable in cash or in kind or for value to be received[Includes ` 1,875 thousand (Previous year ` 1,461 thousand) receivable from Subsidiary Company](` in ‘000)As at 31.03.2011 As at 31.03.201078,508 81,575Advance Income Tax ( Including Tax deducted at source ) 971,460 852,473Total 1,049,968 934,048
Over<strong>view</strong> Performance Re<strong>view</strong>s Governance Financials63Annual Report 2010-11Schedule forming Part of <strong>the</strong> Profit and Loss Account(` in ‘000)Year Ended 31.03.2011 Year Ended 31.03.2010SCHEDULE ‘L’O<strong>the</strong>r IncomeTechnical and O<strong>the</strong>r Fees from Subsidiary Companies 162,982 164,013Sale of Scraps 8,304 8,119Income from Long Term Investments - Dividends :- From subsidiary companies (Trade Investments) 1,875 1,150- O<strong>the</strong>rs 61 66Profit/(Loss) on Sale of Fixed Assets (Net) (19) 10,471Interest :- On Income Tax Refunds 2,337 -- On deposit with Banks and O<strong>the</strong>rs 268 439Bad Debts Recovery - 3,261Liabilities no longer required written back 2,500 25,076Discounts 73 4,759Miscellaneous Income 10,254 7,803Total 188,635 225,157(` in ‘000)Year Ended 31.03.2011 Year Ended 31.03.2010SCHEDULE ‘M’Cost of Materials and Direct Manufacturing ExpensesOpening StockRaw Materials -in Hand 245,293 367,208in Transit 5,109 7,785Stock in Trade 1,038,693 960,2671,289,095 1,335,260Less : Transferred vide Scheme of Arrangement (Note 13 on Schedule ‘O’)Raw Materials -in Hand 14,015 -in Transit - -Stock in Trade 977,884 -Add : Purchases [Note 15 on Schedule ‘O’ ] 1,315,999* 6,245,333*1,613,195 7,580,593Less : Closing StockRaw Materials -in Hand 323,231 245,293in Transit 10,233 5,109Stock in Trade 149,479 1,038,693482,943 1,289,0951,130,252 6,291,498Add : Opening Work-in-Progress 158,901 99,348Less : Transferred vide Scheme of Arrangement (Note 13 on Schedule ‘O’) 43,888 -
64Schedule forming Part of <strong>the</strong> Profit and Loss Account(` in ‘000)Year Ended 31.03.2011 Year Ended 31.03.2010SCHEDULE ‘M’ (CONTD.)Less : Closing Work-in-Progress 116,064 158,9011,129,201 6,231,945Less : Capitalised - 24,3471,129,201 6,207,598Direct Wages 15,558 13,656Incentive Payments 15,311 11,380Consumption of Stores 42,346 34,924Carriage Inward 23,156 25,641Total 1,225,572 6,293,199* Purchases are net of ` 1,210 thousand (Previous year Nil) on account of accrued duty benefit pertaining to Exports/ Deemed Exports.(` in ‘000)Year Ended 31.03.2011 Year Ended 31.03.2010SCHEDULE ‘N’ExpensesSalaries , Wages , Bonus etc * 228,326 653,593Contribution to Provident and o<strong>the</strong>r Funds * 27,737 92,788Staff Welfare Expenses * 7,738 20,535Rent 13,617 28,186Rates and Taxes 3,142 7,621Bank Charges 17,288 31,785Insurance 8,722 18,750Repairs and Maintenance :Buildings 12,957 12,634Plant and Machinery 10,961 30,349O<strong>the</strong>rs 7,482 24,44731,400 67,430Travelling Expenses 41,474 106,524Stationery and Printing 7,456 9,789Postage, Telephone and o<strong>the</strong>r Communication Expenses 11,529 18,855Advertising 4,964 3,714Gas and Electricity 20,682 21,181Commission 13,693 22,808Miscellaneous Expenses (Note 16.1 on Schedule ‘O’) 43,539 113,340Forwarding Charges 92 39,345Royalties 17,155 15,000Medical Expenses * 4,959 12,791Professional Fees (Note 16.2 on Schedule ‘O’) 20,136 20,403Motor Car and Van Expenses 2,546 8,861Service Support Expenses - 43,124Debts/Advances/Claims written off 8,079 7,623Total 534,274 1,364,046* Net off reimbursements [ Also refer Note 20 (B) (l) (f) of Schedule ‘O’]
Over<strong>view</strong> Performance Re<strong>view</strong>s Governance Financials65Annual Report 2010-11Schedule forming part of <strong>the</strong> Accounts for <strong>the</strong> year ended 31st March, 2011SCHEDULE ‘O’Notes1. The Financial Statements are prepared to comply in all material aspects with all <strong>the</strong> applicable accounting principles in India, <strong>the</strong> applicable AccountingStandards notified under section 211(3C) of <strong>the</strong> Companies Act, 1956 and <strong>the</strong> relevant provisions of <strong>the</strong> Companies Act, 1956.2. Significant Accounting Policies2.1 SalesRevenue from sales/services (exclusive of Sales Tax/ Value Added Tax) is being recognised on accrual basis in keeping with related arrangementswith customers and is net of credit notes on account of returns and allowances.2.2 Fixed AssetsFixed Assets (comprising both tangible and intangible items) are stated at cost except in case of certain items of Land , Buildings and Plant andMachinery which are stated on <strong>the</strong> basis of revaluation (with corresponding credit to <strong>the</strong> Revaluation Reserve Account), being inclusive of resultantwrite ups.Software are capitalised where it is expected to provide future enduring economic benefit. Capitalisation costs includes license fees and cost ofimplementation/system integration services. The costs are capitalised in <strong>the</strong> year in which <strong>the</strong> relevant software is implemented for use.Impairment loss, if any, is recognised wherever <strong>the</strong> carrying amount of fixed assets of a cash generating unit exceeds its recoverable amount i.e. netselling price or value in use, whichever is higher.2.3 DepreciationDepreciation (including amortisation) is calculated in <strong>the</strong> following manner :(a)(b)(c)(d)(e)Leasehold land is amortised over <strong>the</strong> period of lease.Depreciation on revalued assets o<strong>the</strong>r than land is calculated on <strong>the</strong>ir respective revalued amounts at rates considered applicable by <strong>the</strong>valuers on <strong>the</strong> straight line method. (Also refer Note 3 below)In respect of o<strong>the</strong>r assets, at rates prescribed in Schedule XIV to <strong>the</strong> Companies Act, 1956 on ‘Straight Line Method’ except Plant andMachinery given under operating leases which are depreciated over a period of 3 to 6 years, being <strong>the</strong> useful life as estimated by <strong>the</strong>management.Technical Know-how fees are amortised under straight line method over total useful lives ( currently 5 to 10 years), as estimated by <strong>the</strong>Management.Software capitalised, are amortised within a period of three years from <strong>the</strong> date of capitalisation.2.4 InvestmentsLong term Investments are stated at cost less provision, if any, for permanent diminution in value .2.5 InventoriesInventories, o<strong>the</strong>r than Stores are valued at lower of weighted average cost/actual cost (inclusive of conversion expenses and applicable overheadsfor manufacturing activities) and net realisable value. Stores are valued at weighted average cost less write offs.Loose Tools acquired prior to 1st September, 2008 are written off over a period up to 5 years, after retaining 10% residual value. Loose Tools acquiredon or after 1st September,2008 are fully charged off.2.6 TaxationCurrent Tax in respect of taxable income is provided for <strong>the</strong> year based on applicable tax rates and laws. Deferred Tax is recognised subject to <strong>the</strong>consideration of prudence in respect of deferred tax assets, on timing differences, being <strong>the</strong> difference between taxable income and accounting incomethat originate in one period and are capable of reversal in one or more subsequent periods and is measured using tax rates and laws that have beenenacted or substantively enacted by <strong>the</strong> Balance Sheet date. Deferred tax assets are re<strong>view</strong>ed at each Balance Sheet date to re-assess realisation.
66Schedule forming part of <strong>the</strong> Accounts for <strong>the</strong> year ended 31st March, 2011SCHEDULE ‘O’ (Contd.)2.7 Employee Benefits2.7.1 Short-term Employee benefits (i.e. benefits payable within one year) are recognised in <strong>the</strong> period in which <strong>the</strong> employee services are rendered.2.7.2 Contributions towards provident funds are recognised as expense. Provident fund contributions in respect of employees are made to commontrust-‘Tractors India Employees Provident Fund’ ( being administered by <strong>the</strong> trustees of <strong>the</strong> said fund for <strong>the</strong> benefit of employees of <strong>the</strong>company and its subsidary company i.e. Tractors India Private Limited) and such Trust invest funds following a pattern of investmentprescribed by <strong>the</strong> Government. The interest rate payable to <strong>the</strong> members of <strong>the</strong> Trusts is not lower than <strong>the</strong> rate of interest declared annuallyby <strong>the</strong> Central Government under <strong>the</strong> Employees’ Provident Funds and Miscellaneous Provisions Act,1952 and shortfall, if any, on account ofinterest, is made good by <strong>the</strong> Company. (Also refer note 18.2 below)Contributions under Employees’ Pension Scheme is made as per statutory requirements and charged as expenses for <strong>the</strong> year.2.7.3 The Company also contributes to <strong>the</strong> Central Government administered Employees’ State Insurance Scheme for its eligible employees, whichis a defined contribution plan.2.7.4 Provisions for Gratuity for eligible employees is (being a defined benefit plan) made on <strong>the</strong> basis of year-end actuarial valuation usingProjected unit credit method.2.7.5 In respect of certain eligible employees who have attained 45 years of age as on 1st April 2009, provision for Superannuation under definedbenefit plan is made on <strong>the</strong> basis of year end actuarial valuation (Note 18.3 below) using Projected unit credit method.In respect of certain eligible employees who have not attained 45 years of age as on 1st April 2009 provision for Superannuation is made :-under defined contribution scheme in respect of services rendered with effect from 1st April 2009.under defined benefit scheme in respect of services rendered up to 31st March 2009, based on frozen pensionable salary as on 31stMarch 2009 (refer Note 18.3 below) using Projected unit credit method.2.7.6 Actuarial gains/ losses arising in Defined Benefit Plans are recognised in <strong>the</strong> Profit and Loss Account as income or expenses in <strong>the</strong> year inwhich <strong>the</strong>y occur.2.7.7 Accrued liability towards Leave Encashment benefits, covering eligible employees, evaluated on <strong>the</strong> basis of year-end actuarial valuation, usingProjected unit credit method, is recognised as a charge.2.8 Foreign Currency TransactionsMonetary assets and liabilities related to foreign currency transactions remaining unsettled at <strong>the</strong> year end are translated at year end rates or atcontract rates, where covered by forward exchange contracts. The difference in transactions of monetary assets and liabilities and realised gainsand losses on foreign exchange transactions are recognised in <strong>the</strong> Profit and Loss Account. In respect of transactions covered by forward exchangecontracts, <strong>the</strong> difference between <strong>the</strong> contract rate and <strong>the</strong> spot rate on <strong>the</strong> date of transaction is charged to <strong>the</strong> Profit and Loss Account over <strong>the</strong>period of <strong>the</strong> contract. Profit/(Loss) on cancellation of forward contracts are recognised as income or as expenses for <strong>the</strong> year. Foreign currencynon-monetary items carried in terms of historical cost are reported using <strong>the</strong> exchange rate at <strong>the</strong> date of transactions.2.9 Borrowing CostBorrowing Cost, if any, that are attributable to <strong>the</strong> acquisition, construction or production of ‘Qualifying Assets’ are capitalised as part of cost ofsuch assets. A ‘Qualifying Asset’ is an asset that necessarily requires a substantial period of time to get ready for its intended use or sale. All o<strong>the</strong>rborrowing costs are recognised as expenses in <strong>the</strong> period in which <strong>the</strong>y are incurred.2.10 LeasesFor assets acquired under Operating Lease, rentals payable are charged to Profit and Loss Account. Assets acquired under Finance Lease arecapitalised at lower of <strong>the</strong> Fair Value and Present Value of Minimum Lease Payments. Assets leased out under operating leases are capitalised. Rentalincome is recognised on accrual basis over <strong>the</strong> lease term.
Over<strong>view</strong> Performance Re<strong>view</strong>s Governance Financials67Annual Report 2010-11Schedule forming part of <strong>the</strong> Accounts for <strong>the</strong> year ended 31st March, 2011SCHEDULE ‘O’ (Contd.)3. Based on <strong>the</strong> valuation report submitted by <strong>the</strong> valuers appointed for <strong>the</strong> purpose, certain items of <strong>the</strong> Company’s fixed assets (viz. Freehold and LeaseholdLand, Freehold and Leasehold Buildings and Plant and Machinery) were revalued on 31st March,1993 after considering <strong>the</strong> following factors :-The <strong>the</strong>n estimated current market value pertaining to Leasehold Land and Freehold Land and Buildings <strong>the</strong>reon.Value of Plant and Machinery based on <strong>the</strong>ir <strong>the</strong> <strong>the</strong>n current cost of replacement.Adjustments for <strong>the</strong> <strong>the</strong>n condition, <strong>the</strong> standard of maintenance, depreciation up to valuation date etc.The resultant revaluation surplus of ` 247,234 thousand, arising from <strong>the</strong> aforesaid revaluation, were transferred to Revaluation Reserve as reflected in <strong>the</strong>Company’s annual accounts for 1992-93.Depreciation on <strong>the</strong>se revalued assets as calculated in <strong>the</strong> manner indicated in Note 2.3(b) above includes an additional charge of ` 1,545 thousand (PreviousYear ` 1,545 thousand)and an amount equivalent to <strong>the</strong> additional charge has been transferred to <strong>the</strong> Profit and Loss Account from Revaluation Reserve; suchtransfer, according to an authoritative professional <strong>view</strong> being acceptable for <strong>the</strong> purpose of <strong>the</strong> Company’s annual accounts. In consequence, <strong>the</strong> effectivedepreciation rates (o<strong>the</strong>r than leasehold land) are as per Schedule XIV to <strong>the</strong> Companies Act, 1956.4. Ownership of a flat (cost ` 3,937 thousand) belonging to <strong>the</strong> Company in a Co-operative Housing Society is registered in <strong>the</strong> name of <strong>the</strong> Managing Directorof erstwhile Spundish Engineering Ltd.5. Earnings Per Share (EPS) - The numerators and denominators used to calculate Basic and Diluted EPS:Year Ended 31.03.2011 Year Ended 31.03.2010Profit after Tax attributable to <strong>the</strong> Equity Shareholders (` ‘000 ) A 311,959 468,6325.1 Basici. Number of Equity Shares at <strong>the</strong> beginning of <strong>the</strong> year 10,030,265 10,030,265ii. Number of Equity Shares issued during <strong>the</strong> year - -iii. Number of Equity Shares at <strong>the</strong> end of <strong>the</strong> year 10,030,265 10,030,265iv. Weighted average number of Equity Shares outstanding during <strong>the</strong> year B 10,030,265 10,030,265v. Nominal Value of each Equity Share (`) 10/- 10/-Basic Earnings per Share (`) A/B 31.10 46.725.2 Dilutedi. Number of Potential Equity Shares at <strong>the</strong> beginning of <strong>the</strong> year - 2,693,707ii. Number of Potential Equity Shares issued during <strong>the</strong> year - -iii. Number of Potential Equity Shares Converted/Forfeited during <strong>the</strong> year - (2,693,707)iv. Number of Potential Equity Shares at <strong>the</strong> end of <strong>the</strong> year - -Diluted Earnings per Share (`) 31.10 46.726. Contingent Liabilities in respect of -6.1 Sales Tax Matters under dispute[Net of payments ` 645 thousand (Previous year ` 3,243 thousand)]6.2 Income Tax Matters under dispute[Excludes disputed Income Tax matters, in <strong>view</strong> of favourable Tribunal decision in similar case.]6.3 Service Tax matters under dispute [Net of payments ` 1,463 thousand (Previous year` 20,208 thousand)]6.4 Excise Duty matters under dispute[Net of payments ` 2,918 thousand (Previous year ` 1,648 thousand)](` in ‘000)As at 31.03.2011 As at 31.03.201036,298 6,54612,790 1,8099,284 96,2614,315 5,329
68Schedule forming part of <strong>the</strong> Accounts for <strong>the</strong> year ended 31st March, 2011SCHEDULE ‘O’ (Contd.)(` in ‘000)As at 31.03.2011 As at 31.03.20107. Guarantees7.1 Bank Guarantees outstanding 243,103 337,8167.2 Corporate Guarantee given on behalf of Subsidiaries :- LimitTractors India Private Limited 4,000,600 NilMyanmar Tractors Limited 89,740 90,600TIL Overseas Pte. Ltd. 67,305 67,950- Amount outstanding at year-endTractors India Private Limited 2,200,400 NilMyanmar Tractors Limited Nil NilTIL Overseas Pte. Ltd. Nil Nil8. Capital Commitment [Net of advance ` 30,381 thousand (Previous year ` 22,237 thousand)] 566,071 18,5669.1 Based on legal proceedings initiated by <strong>the</strong> Employees’ Union/ Association and <strong>the</strong> interim order of <strong>the</strong> Hon’ble Calcutta High Court dated 22ndDecember,2006 and 18th April,2007 restraining <strong>the</strong> Company from making any contribution/ deduction towards Employees’ State Insurance in respectof its Kamarhatty ( with effect from October,2006 ) and Taratolla ( with effect from March, 2007) units, in respect of employees whose monthly salaries(i.e.basic,dearness allowance and overtime ) are between ` 7,501 and ` 10,000, no contributions/ deductions have been made and deposited with <strong>the</strong>appropriate authorities. The related amounts involved as on 31st March, 2011 being (Employer’s) ` 679 thousand (Previous Year ` 669 thousand) and(Employees’) ` 250 thousand (Previous Year ` 246 thousand).9.2 Consequent to enhancement of Employees’ State Insurance benefit ceiling for ‘Employee Wages’ from ` 10,000 to ` 15,000 per month with effect from1st May 2010, legal proceedings have been initiated by <strong>the</strong> Employees’ Union/ Association of <strong>the</strong> Company and an interim order dated 13th August, 2010has been issued by <strong>the</strong> Hon’ble Calcutta High Court in this regard, restraining <strong>the</strong> Company from making contribution/ deduction towards Employees’ StateInsurance in respect of employees whose monthly salaries (i.e. basic, dearness allowance and overtime ) are between ` 10,001 and ` 15,000. In <strong>view</strong> of<strong>the</strong> said Order, <strong>the</strong> Company has nei<strong>the</strong>r deducted from <strong>the</strong> certain concerned employees nor contributed its own share to <strong>the</strong> Employees State InsuranceScheme with effect from 1st August, 2010, <strong>the</strong> related amounts involved as on 31st March, 2011 being (Employer’s) ` 87 thousand (Previous Year NIL)and ( Employees’) ` 32 thousand (Previous Year NIL).10. The Company has various residential/ commercial premises taken under cancellable operating lease. Leases range for periods between 3 to 5 years. Termsof <strong>the</strong> lease include operating term for renewal, increase in rent for future periods, terms of cancellation etc. The operating lease payments for <strong>the</strong> yearamount to ` 10,773 thousand (Previous Year ` 18,572 thousand).11. There are no outstanding dues for Micro and Small Enterprises based on information available with <strong>the</strong> Company.12. Technical Know-how [ shown under Intangible Assets - Schedule ‘E’ ] represents technical drawings, designs etc. relating to manufacture of <strong>the</strong> Company’sproducts acquired pursuant to various agreements conferring <strong>the</strong> right to manufacture and usage only.13. Pusuant to <strong>the</strong> Scheme of Arrangement (<strong>the</strong> ‘Scheme’) under Section 391 to 394 of <strong>the</strong> Companies Act between <strong>the</strong> Company i.e. TIL Limited (<strong>the</strong> transferorCompany) and its wholly owned subsidiary Tractors India Private Limited (TIPL) ( <strong>the</strong> transferee company), as sanctioned by <strong>the</strong> Hon’ble High Court atCalcutta vide order dated 12th July, 2010, <strong>the</strong> undertaking of <strong>the</strong> Company pertaining to dealership business of Caterpillar (comprising Construction andMining Solutions and Power Systems Solutions) has been transferred to and vested in TIPL on a going concern basis with effect from <strong>the</strong> appointed date of1st April, 2010, in consideration of 4489430 number of Equity Shares of TIPL at ` 10/- each at a premium of ` 203.48 per share fully paid up, amounting to` 958,396 thousand, on a slump sale basis.
Over<strong>view</strong> Performance Re<strong>view</strong>s Governance Financials69Annual Report 2010-11Schedule forming part of <strong>the</strong> Accounts for <strong>the</strong> year ended 31st March, 2011SCHEDULE ‘O’ (Contd.)The said Scheme has been given effect to in <strong>the</strong>se accounts in accordance with <strong>the</strong> said High Court order.In pursuance of <strong>the</strong> Scheme <strong>the</strong> following assets and liabilities pertaining to <strong>the</strong> aforesaid undertaking were transferred to and vested in TIPL with effect from1st April, 2010 at <strong>the</strong>ir respective book values:-(` in ‘000)Net Fixed Assets 724,377Current Assets, Loans and Advances 2,319,691Total Assets 3,044,068Less: Current Liabilities and Provisions and Borrowings 2,085,672Net Assets 958,396The undertaking of <strong>the</strong> Company pertaining to delearship business of Caterpillar (comprising Construction and Mining Solutions and Power SystemsSolutions) was treated as a discontinuing business for <strong>the</strong> year 2009-2010 with following disclosure :(` in ‘000)Year Ended 31.03.2010a) Revenue and Expenses in respect of <strong>the</strong> Total Revenue : 6,848,882ordinary activities attributable to <strong>the</strong>Discontinuing Operations (after allocation of Total Expenses : 6,514,624interest on borrowings and corporateexpenses as estimated by management)b) Pre-Tax profit/(loss) attributable to <strong>the</strong> Pre tax Profit : 334,258Discontinuing Operations and Income Tax Income taxexpense related <strong>the</strong>reto Expense : 126,750c) Amount of cash flows attributable to Cash flows attributable to :Operating, Investing and Financial activities of Operating Activities : 331,763<strong>the</strong> Discontinuing Operations Investing Activities : (260,502)Financing Activities : (72,594)14.1 Sales-o<strong>the</strong>rs [Note 22.2(i) below] represents Service Income ` 25,080 thousand (Previous Year ` 236,933 thousand).14.2 Excise Duty is net of ` 4,506 thousand (Previous Year - Nil) on account of accrued duty benefit for <strong>the</strong> year pertaining to Export/Deemed Exports.(` in ‘000)Year Ended 31.03.2011 Year Ended 31.03.201015. Purchases include :a) Marine Insurance Charges 961 3,243b) Raw materials purchased 1,082,185 1,115,669Exclude : Items being recoverable by way of reimbursement o<strong>the</strong>r than through Sales - 93,73516.1. Miscellaneous expenses include, charge/(credit) on account of :a) Discounting Charges - 1,133b) Loss/(Gain) on Foreign Exchange (net) (9,796) (2,747)16.2. Professional fees include :Amount paid /payable to Auditors*As Auditors- Audit Fees 625 1,250- Tax Audit Fees 150 300- Limited Re<strong>view</strong>s 750 750- O<strong>the</strong>rs (Certificates, etc.) 550 600- Expenses reimbursed 49 26* Excluding Service Tax ` 202 thousand (Previous Year ` 301 thousand)
70Schedule forming part of <strong>the</strong> Accounts for <strong>the</strong> year ended 31st March, 2011SCHEDULE ‘O’ (Contd.)17. Year-end Deferred Tax balance comprises <strong>the</strong> following :(` in ‘000)As at 31.03.2011 As at 31.03.2010Timing Difference resulting in liabilities /(assets) on account of :Difference between net book value of depreciable Capital Asset as per books vis-à-vis written44,510 78,400down value as per Income Tax.Disallowances allowable for tax purpose on payments (18,726) (18,726)Deferred Tax Liability (Net) 25,784 59,67418. Employee Benefits18.1 The Company has recognised, in <strong>the</strong> Profit and Loss Account for <strong>the</strong> year ended 31st March, 2011 an amount of ` 8,454 thousand (Previous year` 16,250 thousand) as expenses under defined contribution plans as detailed below:(` in ‘000)For <strong>the</strong> yearBenefit (Contribution to) 2010-11 2009-10Employees Pension Scheme 4,318 8,490Employees State Insurance 444 445Superannuation Fund 3,692 7,315Total 8,454 16,25018.2 Provident Fund :-In terms of <strong>the</strong> Guidance on implementing Accounting Standard(AS) 15 on Employee Benefits issued by <strong>the</strong> Accounting Standards Board of <strong>the</strong> Institute ofChartered Accountants of India, a provident fund set up by <strong>the</strong> Company is treated as a defined benefit plan since <strong>the</strong> Company is obligated to meet interestshortfall, if any. However, at <strong>the</strong> year end, no shortfall remains unprovided for. The Actuary has expressed his inability to provide an actuarial valuation of<strong>the</strong> provident fund liability as at <strong>the</strong> year end in <strong>the</strong> absence of any guidance from <strong>the</strong> Actuarial Society of India. Accordingly, complete information requiredto be considered as per AS 15 in this regard are not available and <strong>the</strong> same could not be disclosed. During <strong>the</strong> year, <strong>the</strong> Company has contributed ` 11,798thousand (Previous year ` 17,974 thousand) to <strong>the</strong> Provident Funds.18.3 A) Superannuation Fund :-(i) Certain eligible employees of <strong>the</strong> Company who had attained at least 45 years of age as on 1st April, 2009 are entitled to Superannuationbenefit under <strong>the</strong> Superannuation scheme (a funded Defined Benefit Plan under a common Trust- ‘Tractors India Limited SuperannuatiionFund Scheme’, being administered by <strong>the</strong> trustees of <strong>the</strong> said fund for <strong>the</strong> benefit of employees of <strong>the</strong> Company and its subsidiary companyi.e. Tractors India Private Limited). Under <strong>the</strong> aforesaid benefit scheme <strong>the</strong> Company makes periodic contribution to <strong>the</strong> Superannuation FundScheme and a predetermined percentage of salary is paid as pension on retirement. The quantum of pension depends on <strong>the</strong> average basicsalary of eligible employee during <strong>the</strong> last 36 months before retirement. The benefit vests to employees with 12 years of continious serviceand attainment of 48 years of age on retirement/death/termination. The most recent actuarial valuation of Plan Assets and Present Value of<strong>the</strong> Defined Benefit Obligation of Superannuation Fund was carried out as on 31st March,2011.(ii)Employees who did not attain 45 years of age as on 1st April,2009 are under <strong>the</strong> pur<strong>view</strong> of ‘Defined Contribution Scheme’ in respect of servicerendered from 1st April, 2009. The benefit of services rendered by <strong>the</strong>se employees upto 31st March, 2009 come under <strong>the</strong> pur<strong>view</strong> of ‘DefinedBenefit Scheme’ as indicated in Note 18.3 (i) above, which is frozen as on 31st March, 2009. Hence for this category of employees, <strong>the</strong> benefitof cessation of service will be:a) amount accumulated by annual contribution of 15% of Basic Salary andb) amount frozen as on 31st March, 2009.
Over<strong>view</strong> Performance Re<strong>view</strong>s Governance Financials71Annual Report 2010-11Schedule forming part of <strong>the</strong> Accounts for <strong>the</strong> year ended 31st March, 2011SCHEDULE ‘O’ (Contd.)B) Gratuity Fund :-The Company makes periodic contributions to <strong>the</strong> Tractors India Limited Staff Gratuity Fund, a funded defined benefit-plan for qualifying employeesadministrated under a common Trust by <strong>the</strong> trustees of <strong>the</strong> said fund for <strong>the</strong> benefit of <strong>the</strong> employees of <strong>the</strong> Company and its subsidiary companyi.e. Tractors India Private Limited.Under <strong>the</strong> Gratuity plan, every employee is entitled to gratuity, being higher of <strong>the</strong> amount, calculated under <strong>the</strong> Company’s plan (based on averagesalary of last 36 months and number of years of service, restricted to a maxmimum of 40 years) or calculations as laid down under <strong>the</strong> Payment ofGratuity Act, 1972. Gratuity is payable on death/ retirement/ termination and <strong>the</strong> benefit vests after 5 year of continuous service.The most recent actuarial valuation of plan assets and <strong>the</strong> present value of <strong>the</strong> defined benefit obligation was carried out as at 31st March, 2011.18.4 Particulars in respect of post retirement defined benefit plans of <strong>the</strong> Company are as follows :-(` in ‘000)Superannuation Fund (Funded)Gratuity Fund (Funded)2010-11 2009-10 2008-09 2007-08 2006-07 2010-11 2009-10 2008-09 2007-08 2006-071. Reconciliation of <strong>the</strong> Openingand Closing balances of <strong>the</strong>Present Value of Obligationa. Present Value of Obligation at <strong>the</strong> 190,516 188,976 141,204 121,103 111,543 64,187 53,945 54,762 55,674 50,111Beginning of <strong>the</strong> Yearb. Present Value of Obligation (73,957) - - - - (20,451) - - - -transferred to Tractors IndiaPrivate Limited pursuant toScheme of Arrangement(Note 13 above )c. Current Service Cost 5,031 7,560 7,417 14,386 6,321 2,694 4,323 4,025 4,711 3,264d. Interest Cost 8,676 12,957 11,546 9,507 8,276 3,281 4,026 4,333 4,247 3,669e. Curtailment Cost/(Credit) - - (17,109) - - - - - - -f. Actuarial (gain)/loss 9,670 35,039 56,646 3,678 3,086 14,576 9,139 (1,594) (3,006) 3,554g. Benefits paid (24,058) (54,016) (10,728) (7,470) (8,123) (8,406) (7,246) (7,581) (6,864) (4,924)h. Present Value of Obligation at <strong>the</strong> 115,878 190,516 188,976 141,204 121,103 55,881 64,187 53,945 54,762 55,674end of <strong>the</strong> Year2. Reconciliation of <strong>the</strong> Openingand Closing balances of <strong>the</strong>Fair Value of Plan Assets :a. Fair value of Plan Assets at <strong>the</strong> 190,624 154,162 125,015 103,326 86,900 56,355 57,770 53,793 50,167 43,916Beginning of <strong>the</strong> Yearb. Fair value of Plan Assets (73,999) - - - - (17,956) - - - -transferred to Tractors IndiaPrivate Limited pursuant toScheme of Arrangement (Note13 above )c. Adjustment to (a) above,on- - - (8,026) - - - - (2,000) -restatement by new actuaryd. Expected return on Plan Assets 9,200 13,182 11,382 7,600 6,752 3,587 4,579 4,565 3,983 3,675e. Actuarial gain/(loss) 308 2,058 (7) - - (474) (4,920) (407) - -f. Contributions by <strong>the</strong> Employer 12,499 75,238 28,500 29,585 17,797 18,046 6,172 7,400 8,507 7,500g. Benefits paid (24,058) (54,016) (10,728) (7,470) (8,123) (8,406) (7,246) (7,581) (6,864) (4,924)h. Fair value of Plan Assets at <strong>the</strong>end of <strong>the</strong> Year114,574 190,624 154,162 125,015 103,326 51,152 56,355 57,770 53,793 50,167
72Schedule forming part of <strong>the</strong> Accounts for <strong>the</strong> year ended 31st March, 2011SCHEDULE ‘O’ (Contd.)18.4 Particulars in respect of post retirement defined benefit plans of <strong>the</strong> Company are as follows :- (Contd.)(` in ‘000)Superannuation Fund (Funded)Gratuity Fund (Funded)2010-11 2009-10 2008-09 2007-08 2006-07 2010-11 2009-10 2008-09 2007-08 2006-073. Reconciliation of <strong>the</strong> PresentValue of Obligation and FairValue of <strong>the</strong> Plan Assets :a. Fair value of Plan Assets at <strong>the</strong>end of <strong>the</strong> Yearb. Present Value of Obligation at <strong>the</strong>end of <strong>the</strong> Yearc. (Asset)/Liabilities recognised in114,574 190,624 154,162 125,015 103,326 51,152 56,355 57,770 53,793 50,167115,878 190,516 188,976 141,204 121,103 55,881 64,187 53,945 54,762 55,6741,304 (108) 34,814 16,189 17,777 4,729 7,832 (3,825) 969 5,507<strong>the</strong> Balance Sheet4. Expenses recognised during<strong>the</strong> year :a. Current Service cost 5,031 7,560 7,417 14,386 6,321 2,694 4,323 4,025 4,711 3,264b. Interest cost 8,676 12,957 11,546 9,507 8,276 3,281 4,026 4,333 4,247 3,669c. Expected return on Plan Assets (9,200) (13,182) (11,382) (7,600) (6,752) (3,587) (4,579) (4,565) (3,983) (3,675)d. Curtailment Cost/(Credit) - - (17,109) - - - - - - -e. Actuarial (Gain)/ Loss 9,362 32,981 56,653 3,678 3,086 15,050 14,059 (1,187) (3,006) 3,554f. Expense recognised during <strong>the</strong> year 13,869 40,316 47,125 19,971 10,931 17,438 17,829 2,606 1,969 6,8125. Experience Adjustments onPlan Obligation and Assetsa. Experience Adjustments on PlanObligation [(Gain)/Loss]b. Experience Adjustments on PlanAssets [(Gain)/Loss]10,690 25,583 51,488 12,306 25,220 15,111 6,974 4,169 (1,682) 6,174308 2,058 (7) - - (474) (4,920) (407) - -The expense for <strong>the</strong> Defined Benefits (referred to in para 18.2 and 18.3 above) are included in <strong>the</strong> line item under ‘Contribution to Provident and o<strong>the</strong>rFunds’ on Schedule ‘N’ .Particulars in respect of post retirement defined benefit plans of <strong>the</strong> Company are as follows :-Description Superannuation Fund Gratuity Fund% Invested % Invested31.03.2011 31.03.2010 31.03.2009 31.03.2008 31.03.2007 31.03.2011 31.03.2010 31.03.2009 31.03.2008 31.03.20076. Investment Details of PlanAssets as ata. Govt of India Securities 20.53 19.63 17.87 15.29 12.45 20.79 14.97 15.05 13.29 12.31b. Public Sector ( PSU ) 47.16 42.47 46.69 39.79 46.68 30.54 27.18 26.42 24.58 28.85Bondsc. State/ Central Govt16.82 17.30 11.82 17.62 3.95 18.70 16.58 17.32 17.18 7.27Securitiesd. Special Deposit Scheme 14.99 16.30 21.12 25.97 33.24 29.81 40.87 41.09 44.34 48.18e. O<strong>the</strong>r including Bank0.50 4.30 2.50 1.33 3.68 0.16 0.40 0.12 0.61 3.39BalanceTotal 100.00 100.00 100.00 100.00 100.00 100.00 100.00 100.00 100.00 100.007. Assumptionsa. Discount rate per annum 8.50 8.30 8.00 8.50 8.10 8.50 8.30 8.00 8.50 8.13b. Salary escalation rate per 4.00 4.00 3.00 3.00 3.00 4.00 4.00 3.00 5.00 3.00annumc. Expected rate of return on 8.00 8.00 8.50 8.10 7.15 8.00 8.00 8.50 8.13 8.13Plan Assets per annumd. Method used Projected Unit Credit Method Projected Unit Credit Method8. Actual Return on Plan 7.64% 7.61% 7.38% 7.09% 7.36% 6.53% 7.89% 7.20% 7.64% 7.70%Assets
Over<strong>view</strong> Performance Re<strong>view</strong>s Governance Financials73Annual Report 2010-11Schedule forming part of <strong>the</strong> Accounts for <strong>the</strong> year ended 31st March, 2011SCHEDULE ‘O’ (Contd.)18.5 The basis used to determine overall expected rate of return on assets and <strong>the</strong> effect on major categories of Plan Assets is as follows :The major portions of <strong>the</strong> Assets are invested in PSU Bonds and Special Deposits. Based on <strong>the</strong> asset allocation and prevailing yield rates on <strong>the</strong>se assetclasses, <strong>the</strong> long term estimate of <strong>the</strong> expected rate of return on <strong>the</strong> fund assets have been arrived at. Assumed rate of return on assets is expected to varyfrom year to year reflecting <strong>the</strong> returns on matching Government Bonds.18.6 The estimate of future salary increases takes into account inflation, seniority, promotion and o<strong>the</strong>r relevant reasons.18.7 In respect of <strong>the</strong> Company’s Defined Benefit plans pertaining to Gratuity and Superannuation benefit schemes for employees transferred to TIPL in termsof <strong>the</strong> Scheme of Arrangement, as indicated in Note 13 above, <strong>the</strong> present value of obligation as on 1st April, 2010 have been worked out by an independentactuary based on relevant information related to each such employees.The fair value of plan assets pertaining to <strong>the</strong> Company as on 1st April, 2010 in respect of Gratuity and Superannuation benefit scheme funds, beingmaintained by Tractors India Limited Staff Gratuity Fund and Tractors India Limited Superannuation Fund respectively have been bifurcated by <strong>the</strong> Trusteesof <strong>the</strong> related funds in proportion to <strong>the</strong> present value of <strong>the</strong> obligation as determined by <strong>the</strong> independent actuary as referred above.19. In terms of Accounting Standard (AS) 17 on ‘Segment Reporting’ notified in <strong>the</strong> Companies Act, 1956, Segment information has been presented in <strong>the</strong>Consolidated Financial Statement [prepared persuant to Accounting Standard (AS) 21 on ‘Consolidated Financial Statement’ notified in <strong>the</strong> CompaniesAct, 1956] included in <strong>the</strong> annual report for <strong>the</strong> year.20. Related Party Disclosure in keeping with Accounting Standard 18 on “Related Party Disclosures”.A) List of Related PartiesSubsidiariesMyanmar Tractors LimitedTractors Nepal Private LimitedTIL Overseas Pte. LimitedTractors India Private LimitedKey Management PersonnelMr. A. Mazumdar( Chairman and Whole time Director)Mr. S. Mazumder( Vice Chairman & Managing Director)Mr. S K Bhatnagar( Whole time Director - Appointed w.e.f. 1st April, 2010)B) Particulars of transactions during <strong>the</strong> year ended 31st March, 2011 :(` in ‘000)Particulars Year Ended 31.03.2011 Year Ended 31.03.2010I) Subsidiary Companiesa) Income from Technical and O<strong>the</strong>r FeesTIL Overseas Pte. Limited 98,932 125,821Myanmar Tractors Limited 64,050 38,192b) Income from Asset UsageTractors India Private Limited 9,339 -c) Dividend IncomeTractors Nepal Private Limited 1,875 1,150d) Stock transferTractors Nepal Private Limited - 201e) InvestmentTractors India Private Limited (Note 13 above) 958,396 106Tractors Nepal Private Limited 5,200 -f) Reimbursement of Expenses fromTractors India Private Limited 102,357 -
74Schedule forming part of <strong>the</strong> Accounts for <strong>the</strong> year ended 31st March, 2011SCHEDULE ‘O’ (Contd.)B) Particulars of transactions during <strong>the</strong> year ended 31st March, 2011 (Contd.):(` in ‘000)Particulars Year Ended 31.03.2011 Year Ended 31.03.2010g) Year-end Balancesi) ReceivablesTractors Nepal Private Limited 1,875 1,461TIL Overseas Pte. Limited 22,759 2,759ii) Corporate Guarantee Refer Note 7.2 above Refer Note 7.2 aboveiii) InvestmentsMyanmar Tractors Limited 41,625 41,625Tractors Nepal Private Limited 7,500 2,300TIL Overseas Pte. Limited 30,222 30,222Tractors India Private Limited 958,501 106iv) PayablesTractors India Private Limited - 48II) Key Management Personnela) RemunerationMr. A. Mazumdar 19,430 23,554Mr. S. Mazumder - 23,631Mr. S K Bhatnagar 12,767 -b) Year end BalanceCommission PayableMr. A. Mazumdar 7,728 16,344Mr. S. Mazumder - 16,356Mr. S K Bhatnagar 5,767 -(` in ‘000)Year Ended 31.03.2011 Year Ended 31.03.201021.1 Managerial Remunerationa) Executive Directorsi) Salaries and Allowances 9,426 7,600ii) Contribution to Funds :Provident Fund 922 550Superannuation Fund - 1,295Gratuity Fund 188 1071,110 1,952iii) Estimated value of benefits computed where necessary under Income Tax Rules. 8,166 4,933iv) Commission 13,495 32,700b) Non Executive Directorsi) Sitting Fees 660 705ii) Commission 4,000 3,86036,857 51,750
Over<strong>view</strong> Performance Re<strong>view</strong>s Governance Financials75Annual Report 2010-11Schedule forming part of <strong>the</strong> Accounts for <strong>the</strong> year ended 31st March, 2011SCHEDULE ‘O’ (Contd.)21.2 Computation of Net Profits under Sections 198 and 349 of <strong>the</strong> Companies Act, 1956 (` in ‘000)Year Ended 31.03.2011 Year Ended 31.03.2010Profit before Taxation as per Profit & Loss Account 420,078 754,860Add : Directors’ Remuneration :Sitting Fees 660 705Salaries. Commission and estimated value ofo<strong>the</strong>r benefits 36,197 51,04536,857 51,750Depreciation and Amortization charged to Accounts 41,608 168,928498,543 975,538Deduct : Depreciation under Section 350 of <strong>the</strong> Companies Act, 1956. 37,127 82,542Adjusted Profit in accordance with Section 198 of <strong>the</strong> Companies Act, 1956. 461,416 892,99610% <strong>the</strong>re of, being <strong>the</strong> maximum permissible limit under section 198 of <strong>the</strong> Companies46,142 89,300Act,1956.Executive Directors Commission restricted (As per service agreement) to; 13,495 32,7001% <strong>the</strong>reof, being <strong>the</strong> maximum permissible limit under section 198 of <strong>the</strong> Companies4,614 8,930Act,1956.O<strong>the</strong>r Directors’ Commission restricted to 4,000 3,860Year Ended 31.03.2011 Year Ended 31.03.201022.1 Particulars of Goods Manufactureda) Diesel-Hydraulic/ Electric Cranes /Carrier Units (Trucks) --Licensed Capacity 1,414 Nos 1,414 NosInstalled Capacity * 220 Nos 220 NosActual Production 111 Nos 84 Nosb) Diesel Generating Sets --Licensed Capacity 500 Nos 500 NosInstalled Capacity * 400 Nos 400 NosActual Production - Nos 325 Nosc) Self-Propelled Rubber Tyred ContainerHandling Mobile Crane --Licensed Capacity Not Applicable Not ApplicableInstalled Capacity * 30 Nos 30 NosActual Production 17 Nos 9 Nos* As certified by <strong>the</strong> Management
76Schedule forming part of <strong>the</strong> Accounts for <strong>the</strong> year ended 31st March, 2011SCHEDULE ‘O’ (Contd.)22.2 Particulars of Cranes and o<strong>the</strong>r classes of Goods Dealt in Stock, Purchases (Trading) and SalesClass of Goodsa) Diesel Hydraulic/ ElectricCranes/ Tower Cranes/ CarrierUnits (Trucks)Opening Stock Transferred to TIPL*** Purchases Sales(Gross) Closing StockUnitof Qty.Qty. Value` ‘000Qty. Value` ‘000Qty. Value` ‘000Qty. Value` ‘000Qty. Value` ‘000Nos. - - - - 1 5,766 106* 1,314,761 8 73,2482 21,320 - - - - 88 1,143,972 - -b) Construction Equipment, etc. Nos. - - - - 3 21,560 3 22,622 - -- - - - - - - - - -c) Earthmoving Equipment, etc. Nos. 52 139,321 52 139,321 - - - - - -116 344,409 - - 800 2,519,380 864 2,673,544 52 139,321d) Diesel Generating Set Nos. - - - - - - - - - -- - - - - - 325 602,563 - -e) Packaged Diesel Generating Set Nos. 14 371,121 14 371,121 - - - - - -38 129,115 - - 132 686,024 156 701,795 14 371,121f) Self-Propelled Rubber Tyred Nos. - - - - - - 18** 300,668 - -Container Handling MobileCrane2 30,242 - - - - 11 193,184 - -g) Forklift etc. Nos. - - - - 3 8,856 3 10,704 - -- - - - - - - - - -h) Goods, Components and Sparesfor Earthmoving and Construction /Material Handling Equipment528,251 467,442 197,632 487,607 76,231435,181 - 1,899,913 2,693,870 528,251i) O<strong>the</strong>rs (Note 14.1) - - - 25,080 -- - - 236,933 -Total 1,038,693 977,884 233,814 2,161,442 149,479Previous year 960,267 - 5,105,317 8,245,861 1,038,693Figures in bold type relate to <strong>the</strong> Current Year* includes nil ( Previous Year 2 ) despatches made from sales return of earlier year.** includes 1 ( Previous Year nil ) despatches made from sales return of earlier year.*** Stock transfer to TIPL as on 1st April,2010 vide Scheme of Arrangement (Refer Note 13 above).With <strong>the</strong> exception of Cranes/ Carrier Units ( Trucks), Earthmoving Equipment,Diesel Generating Sets and Self-Propelled Rubber Tyred Container Handling MobileCrane mentioned above ,none of <strong>the</strong> items included in <strong>the</strong> above classes of goods exceeded individually 10% of <strong>the</strong> total value of Purchases, Stock or Turnoverand accordingly quantitative information has not been provided for.
Over<strong>view</strong> Performance Re<strong>view</strong>s Governance Financials77Annual Report 2010-11Schedule forming part of <strong>the</strong> Accounts for <strong>the</strong> year ended 31st March, 2011SCHEDULE ‘O’ (Contd.)22.3 Details of Raw Materials (Including Components) consumed:Particulars Unit Quantity Value (` in’ 000) PercentageIndigenous :Iron and Steel Tonnes 599 30,842415 19,355Valves (for Cranes) Nos 1,790 14,4991,078 8,985Engine Nos 69 28,660358 303,379Ballast/Tail Weight (for Cranes) Nos 299 17,767273 15,872Acoustic Enclosure (for D G Set) Nos - -301 63,343Tyres,Tubes and Flaps (for Cranes) Set 600 19,292264 10,061Chassis(for Cranes) Nos 42 64,71633 49,279Hydraulic Ram and Cylinder Nos 1,740 83,2721,334 62,535Alternator (for DG Sets) Nos - -299 61,712Miscellaneous * - 225,543- 197,827A 484,591 49.19792,348 63.89Imported :Iron and Steel Tonnes 1,753 119,9601,352 107,844Transmission Nos 118 61,77493 47,736Axle Nos 137 99,233106 83,684Miscellaneous * - 219,550- 208,648B 500,517 50.81447,912 36.11Total A+B 985,108 100.001,240,260 100.00* As none of <strong>the</strong> Miscellaneous items exceeded individually 10% of <strong>the</strong> total value of consumption quantitative information has not been provided for.Figures in bold type relate to <strong>the</strong> Current year.
78Schedule forming part of <strong>the</strong> Accounts for <strong>the</strong> year ended 31st March, 2011SCHEDULE ‘O’ (Contd.)(` in ‘000)Year Ended 31.03.2011 Year Ended 31.03.201022.4 Value of Imported and Indigenous Consumption of StoresValue % Value %Imported 6,529 15 8,251 24Indigenous 35,817 85 26,673 7642,346 100 34,924 10023. C.I.F. Value of Imports :(a) Raw Materials with Components 500,264 364,698(b) Spare Parts (excluding items in transit at year-end) 3,156 1,182,561(c) Machines ( Trading Items ) 21,560 1,330,41124. Expenditure in Foreign Currency :(on payment basis)Travelling 995 2,390Technical Know-How Fees(net of tax) 24,099 2,245Royalty (net of tax) 11,525 12,76825. Earnings in Foreign Exchange :(Remittance received) on account of(a) Export of goods calculated on FOB basis 16,153 62,756(b) Selling Commission (including Dealer’s profit) 8,044 340,756(c) Technical Fees 142,981 173,96426. Remittance in Foreign Currency on account of Dividend to Non-Resident ShareholdersYear Ended 31.03.2011 Year Ended 31.03.2010On Equity Shares :-(a) Amount Remitted (` in ‘000) 11,640 7,760(b) Number of Non - Resident Shareholders (Nos.) 2 2(c) Number of Shares held by <strong>the</strong>m (Nos.) 1,939,931 1,939,931(d) Dividend for <strong>the</strong> year 2009-10 2008-0927. The figures for <strong>the</strong> current year are not comparable with those of <strong>the</strong> previous year (which have been rearranged/regrouped wherever necessary),as <strong>the</strong> figuresfor <strong>the</strong> previous year include transactions relating to <strong>the</strong> transferred undertaking pertaining to dealership business of Caterpillar, as referred to in Note 13.Signatures to Schedules ‘A’ to ‘O’For and on behalf of Board of DirectorsFor PRICE WATERHOUSEFirm Registration No. 301112EChartered AccountantsP.LawPartnerMembership Number 51790Kolkata17th May, 2011A. MazumdarChairmanSumit MazumderVice Chairman & Managing DirectorSekhar BhattacharjeeCompany Secretary
Over<strong>view</strong> Performance Re<strong>view</strong>s Governance Financials79Annual Report 2010-11Cash Flow Statement for <strong>the</strong> year ended 31st March, 2011(` in ‘000)Year ended 31.03.2011 Year ended 31.03.2010A. CASH FLOW FROM OPERATING ACTIVITIESNet Profit Before Tax 420,078 754,860Adjustments for :Depreciation and Amortisation 41,608 168,928Bad Debts/Advances etc Written off 8,079 7,623(Profit)/Loss on Sale of Fixed Assets (Net) 19 (10,471)Interest Expenses (Net) 21,314 159,511Dividend Income (1,936) (1,216)Unrealised Foreign Exchange (Gain)/Loss (Net) (2,050) (7,323)67,034 317,052Operating Profit before Working Capital Changes 487,112 1,071,912Adjustments for :Trade and O<strong>the</strong>r Receivables (119,204) (469,964)Inventories (181,464) (2,967)Loans and Advances and O<strong>the</strong>r Current Assets (27,927) 25,123Trade Payables 248,491 246,358(80,104) (201,450)Cash Generated from Operations 407,008 870,462Direct Taxes Paid (118,987) (285,072)Net Cash (Used in)/from Operating Activities 288,021 585,390B. CASH FLOW FROM INVESTING ACTIVITIESPurchase of Fixed Assets (488,733) (395,652)Proceeds from Sale of Fixed Assets 659 58,276Investment in a Subsidiary Company (5,200) (106)Interest Received 2,605 439Dividend Received 1,936 1,216Net Cash (Used in)/from Investing Activities (488,733) (335,827)C. CASH FLOW FROM FINANCING ACTIVITIESInterest Paid (29,306) (160,422)Proceeds from Long Term Borrowings 38,619 -Repayment of Long Term borrowings (11,311) (63,534)Increase in Cash Credit and o<strong>the</strong>r short term borrowings (Net) 272,994 19,838Dividend Paid (69,684) (46,573)Net Cash (Used in)/from Financing Activities 201,312 (250,691)Net Increase/ (Decrease) In Cash and Cash Equivalents (A+B+C) 600 (1,128)Cash and Cash Equivalents as at <strong>the</strong> beginning of <strong>the</strong> year (Schedule 'I' ) 1,826 2,954Cash and Cash Equivalents as at <strong>the</strong> close of <strong>the</strong> year (Schedule ‘I’ ) 2,426 1,826Notes :1) The above Cash Flow Statement has been prepared under <strong>the</strong> ‘ Indirect Method ‘ as set out in <strong>the</strong> Accounting Standard - 3 on ‘Cash Flow Statements’.2) The above Cash Flow Statement does not reflect transfer of Assets and Liabilities amounting to ` 3,044,068 thousand and ` 2,085,672 thousand respectively toTractors India Pvt Ltd (TIPL) pursuant to <strong>the</strong> Scheme of Arrangement indicated in Note 13 on Schedule ‘O’ being non cash in nature.3) The Schedules referred to above forms an integral part of <strong>the</strong> Cash Flow Statement .4) The figures for <strong>the</strong> current year are not comparable with those of <strong>the</strong> previous year (which have been rearranged/regrouped wherever necessary), as <strong>the</strong> figures for<strong>the</strong> previous year include transactions relating to <strong>the</strong> transferred undertaking pertaining to dealership business of Caterpillar, referred to in Note 13 on Schedule ‘O’.This is <strong>the</strong> Cash Flow Statement referred to in our report of even date.For PRICE WATERHOUSEFirm Registration No. 301112EChartered AccountantsP.LawPartnerMembership Number 51790Kolkata17th May, 2011For and on behalf of Board of DirectorsA. MazumdarChairmanSumit MazumderVice Chairman & Managing DirectorSekhar BhattacharjeeCompany Secretary
80Balance Sheet Abstract and Company’s General Business ProfileI. Registration DetailsRegistration No. 2 1 - 0 4 1 7 2 5 State Code 2 1Balance Sheet Date 3 1 . 0 3 . 2 0 1 1II. Capital Raised during <strong>the</strong> Year (All Figures in ` ‘000)Public Issue - Rights Issue -Bonus Issue - Private Placement -III. Position of Mobilisation and Deployment of Funds (All Figures in ` ‘000)Total Liabilities (Including Owner’s Fund) 4 2 2 1 1 4 3 Total Assets 4 2 2 1 1 4 3Sources of FundsPaid-up Capital 1 0 0 3 0 3 Reserves & Surplus 2 1 2 2 9 0 3Secured Loans 4 4 0 9 2 5 Unsecured Loans -Application of FundsNet Fixed Assets (Including Capital Work In Progress) 1 0 0 5 9 3 3 Investments 1 0 3 8 5 6 7Net Current Assets 6 4 5 6 4 9 Misc Expenditure -Accumulated Losses -IV. Performance of Company (All Figures in ` ‘000)Turnover (excluding O<strong>the</strong>r Income 188,635) 2 1 8 4 7 0 2 Total Expenditure (Incld. Excise Duty) 1 9 5 3 2 5 9Profit/(Loss) Before Tax 4 2 0 0 7 8 Profit/(Loss) after Tax 3 1 1 9 5 9Earnings Per Share (Figure in `) 3 1 . 1 0 Dividend Rate % 6 0V. Generic Names of Principal Product/Services of Company (as per monetary terms)Item Code No. (ITC Code) 8 4 2 6Product DescriptionC R A N E SFor and on behalf of Board of DirectorsA. MazumdarChairmanSumit MazumderVice Chairman & Managing DirectorKolkata17th May, 2011Sekhar BhattacharjeeCompany Secretary
Over<strong>view</strong> Performance Re<strong>view</strong>s Governance Financials81Annual Report 2010-11Auditors Report On <strong>the</strong> Consolidated Financial Statements of TIL LimitedTo The Board of Directors of TIL LIMITED1. We have audited <strong>the</strong> attached Consolidated Balance Sheet of TIL Limited (<strong>the</strong> ‘Company’) and its subsidiaries, hereinafter referred to as <strong>the</strong> ‘Group’ (referNote 2 on Schedule ‘O’ to <strong>the</strong> attached Consolidated Financial Statements) as at 31st March, 2011, <strong>the</strong> related Consolidated Profit and Loss Accountand <strong>the</strong> Consolidated Cash Flow Statement for <strong>the</strong> year ended on that date annexed <strong>the</strong>reto, which we have signed under reference to this report.These Consolidated Financial Statements are <strong>the</strong> responsibility of Company’s Management. Our responsibility is to express an opinion on <strong>the</strong>se FinancialStatements based on our audit.2. We conducted our audit in accordance with auditing standards generally accepted in India. Those Standards require that we plan and perform <strong>the</strong>audit to obtain reasonable assurance about whe<strong>the</strong>r <strong>the</strong> financial statements are free of material misstatement. An audit includes examining, on a testbasis, evidence supporting <strong>the</strong> amounts and disclosures in <strong>the</strong> financial statements. An audit also includes assessing <strong>the</strong> accounting principles usedand significant estimates made by management, as well as evaluating <strong>the</strong> overall financial statement presentation. We believe that our audit provides areasonable basis for our opinion.3. We did not audit <strong>the</strong> financial statements of three subsidiaries included in <strong>the</strong> Consolidated Financial Statements, which constitute total assets of` (in ‘000) 1,458,792 and net assets of ` (in ‘000) 970,205 as at 31st March, 2011, total revenue of ` (in ‘000) 2,717,940, net profit of ` (in ‘000) 267,392and net cash flows amounting to ` (in ‘000) 122,241 for <strong>the</strong> year <strong>the</strong>n ended.These financial statements and o<strong>the</strong>r financial information have been auditedby o<strong>the</strong>r auditors whose reports have been furnished to us, and our opinion on <strong>the</strong> Consolidated Financial statements to <strong>the</strong> extent <strong>the</strong>y have been derivedfrom such financial statements is based solely on <strong>the</strong> report of such o<strong>the</strong>r auditors.4. We report that <strong>the</strong> Consolidated Financial Statements have been prepared by <strong>the</strong> Company’s Management in accordance with <strong>the</strong> requirements ofAccounting Standard (AS) 21 - Consolidated Financial Statements, notified under sub-section 3C of Section 211 of <strong>the</strong> Companies Act, 1956.5. Based on our audit and on consideration of reports of o<strong>the</strong>r auditors on separate financial statements and on <strong>the</strong> o<strong>the</strong>r financial information of <strong>the</strong>components of <strong>the</strong> Group as referred to above, and to <strong>the</strong> best of our information and according to <strong>the</strong> explanations given to us, in our opinion, <strong>the</strong> attachedConsolidated Financial Statements give a true and fair <strong>view</strong> in conformity with <strong>the</strong> accounting principles generally accepted in India:(a) in <strong>the</strong> case of <strong>the</strong> Consolidated Balance Sheet, of <strong>the</strong> state of affairs of <strong>the</strong> Group as at 31st March, 2011;(b)(c)in <strong>the</strong> case of <strong>the</strong> Consolidated Profit and Loss Account, of <strong>the</strong> profit of <strong>the</strong> Group for <strong>the</strong> year ended on that date; andin <strong>the</strong> case of <strong>the</strong> Consolidated Cash Flow Statement, of <strong>the</strong> cash flows of <strong>the</strong> Group for <strong>the</strong> year ended on that date.For PRICE WATERHOUSEFirm Registration No. 301112EChartered AccountantsP. LawPlace: KolkataPartnerDate: 17th May, 2011 Membership Number 51790
82Consolidated Balance Sheet as at 31st March, 2011(` in ‘000)Schedule As at 31.03.2011 As at 31.03.2010SOURCES OF FUNDS1. Shareholders’ Funds(a) Capital A 100,303 100,303(b) Reserves and Surplus B 3,179,918 2,659,7543,280,221 2,760,0572. Loan Funds C(a) Secured Loans 1,784,903 499,000(b) Unsecured Loans 560,480 594,8332,345,383 1,093,8333. Deferred Tax Liability (Net) [Note 9 on Schedule ‘O’] 68,440 59,674Total 5,694,044 3,913,564APPLICATIONS OF FUNDS1. Fixed Assets E(a) Gross Block 2,868,215 2,109,029(b) Less : Depreciation 1,069,439 951,745(c) Net Block 1,798,776 1,157,284(d) Capital Work-in-Progress 114,457 199,0061,913,233 1,356,2902. Investments F 719 7193. Current Assets,Loans and Advances(a) Inventories G 3,384,176 1,930,359(b) Sundry Debtors H 1,923,428 1,678,441(c) Cash and Bank Balances I 554,227 430,772(d) O<strong>the</strong>r Current Assets J 321,994 183,255(e) Loans and Advances K 1,244,856 956,6367,428,681 5,179,463Less : Current Liabilities and ProvisionsD(a) Liabilities 2,423,821 1,655,636(b) Provisions 1,224,768 967,2723,648,589 2,622,908Net Current Assets 3,780,092 2,556,555Total 5,694,044 3,913,564NotesOThe Schedules referred to above form an integral part of <strong>the</strong> Balance Sheet.This is <strong>the</strong> Consolidated Balance Sheet referred to in our report of even date.For and on behalf of Board of DirectorsFor PRICE WATERHOUSEA. MazumdarFirm Registration No. 301112EChairmanChartered AccountantsSumit MazumderP. Law Vice Chairman & Managing DirectorPartnerMembership Number 51790Kolkata17th May, 2011Sekhar BhattacharjeeCompany Secretary
Over<strong>view</strong> Performance Re<strong>view</strong>s Governance Financials83Annual Report 2010-11Consolidated Profit & Loss Account for <strong>the</strong> year ended 31st March, 2011(` in ‘000)Schedule Year Ended 31.03.2011 Year Ended 31.03.2010INCOMESales and Services (Gross) 13,490,565 10,212,562Less : Excise Duty 189,274 138,359Sales and Services (Net) 13,301,291 10,074,203Selling Commission Earned 229,910 231,066Rental from Machinery 220,086 240,356O<strong>the</strong>r Income L 87,471 114,90013,838,758 10,660,525EXPENDITURECost of Materials and Direct Manufacturing Expenses M 10,600,971 7,848,644Expenses N 1,929,192 1,544,77812,530,163 9,393,422Interest on :Fixed Loans 16,888 32,390O<strong>the</strong>rs 184,184 127,618201,072 160,008Depreciation and Amortisation 208,487 195,061Less : Transfer from Revaluation Reserve 1,545 1,545206,942 193,516Profit Before Taxation 900,581 913,579Less : Provision for Taxation :Current Tax 289,867 289,590Deferred Tax Charged 8,766 28,728298,633 318,318Profit After Taxation 601,948 595,261Add : Balance of Profit and Loss Accountbrought forward from previous year 1,791,054 1,312,833Balance Available For Appropriations 2,393,002 1,908,094APPROPRIATIONSGeneral Reserve 31,196 46,863Proposed Dividend :Equity Shares 60,182 60,182Tax on Dividend 9,763 9,995Balance Carried Forward 2,291,861 1,791,0542,393,002 1,908,094Earnings Per Share (`) [Note 8 on Schedule ‘O’]Basic (`) 60.01 59.35Diluted (`) 60.01 59.35NotesOThe Schedules referred to above form an integral part of <strong>the</strong> Profit and Loss Account.This is <strong>the</strong> Consolidated Profit and Loss Account referred to in our report of even date.For and on behalf of Board of DirectorsFor PRICE WATERHOUSEA. MazumdarFirm Registration No. 301112EChairmanChartered AccountantsSumit MazumderP. Law Vice Chairman & Managing DirectorPartnerMembership Number 51790Kolkata17th May, 2011Sekhar BhattacharjeeCompany Secretary
84Schedule forming part of <strong>the</strong> Consolidated Balance Sheet(` in ‘000)As at 31.03.2011 As at 31.03.2010SCHEDULE ‘A’Share CapitalAuthorised20,000,000 Equity Shares of ` 10/- each 200,000 200,000200,000 200,000Issued,Subscribed and Paid up10,030,265 Equity Shares of ` 10/- each fully paid up (Note below) 100,303 100,303Total 100,303 100,303Note : Of <strong>the</strong> above Equity Shares, 1,992,078 Shares were allotted as fully paid up, pursuant to a scheme of amalgamation in October,1984, without paymentbeing received in cash.(` in ‘000)As per last Account Additions Deductions As at 31.03.2011SCHEDULE ‘B’Reserves and SurplusCapital Reserve 87,834 - - 87,834Foreign Currency Translation Reserve(Net) 61,113 - 10,294 50,819Revaluation Reserve 70,445 - 1,545 68,900Securities Premium Account 193,377 - - 193,377Amalgamation Reserve 2,045 - - 2,045Development Rebate Reserve 84 - - 84General Reserve 413,797 31,196 - 444,993Capital Redemption Reserve 40,005 - - 40,005868,700 31,196 11,839 888,057Profit and Loss Account 1,791,054 500,807 - 2,291,861Total 2,659,754 532,003 11,839 3,179,918
Over<strong>view</strong> Performance Re<strong>view</strong>s Governance Financials85Annual Report 2010-11Schedule forming part of <strong>the</strong> Consolidated Balance Sheet(` in ‘000)As at 31.03.2011 As at 31.03.2010SCHEDULE ‘C’Loan Funds(a) Secured LoansCash Credit / Working Capital Demand LoansFrom Banks 1,555,478 214,856[Secured by a first pari passu charge on all <strong>the</strong> current assets of <strong>the</strong> ParentCompany and its subsidiary-TIPL(namely Stocks, Bills Receivable and Book Debts) and asecond pari passu charge on all movables(excluding such movables as may be agreed byConsortium Bankers from time to time),fixed assets of <strong>the</strong> Parent Company and its subsidiary-TIPL, both present and future and certain immovable properties of <strong>the</strong> Parent Company, undera joint deed of hypo<strong>the</strong>cation between <strong>the</strong> Parent Company and its Consortium Bankers.Fur<strong>the</strong>r <strong>the</strong> Parent Company has provided a Corporate Guarantee for <strong>the</strong> credit/loan facilitiesavailed of by its subsidiary-TIPL.]Interest accrued and due 6,598 2,086Term LoansFrom BanksIn Indian Rupee 205,298 59,560(Repayable within one year ` 64,000 thousand)In Foreign Currency - 221,117[Term Loans are secured by equitable mortgage on certain immovable properties of <strong>the</strong>Parent Company and by first pari passu charge on all movable properties of <strong>the</strong> ParentCompany and its subsidiary TIPL both present and future and second pari passu charge on<strong>the</strong> current assets of <strong>the</strong> Parent Company and its subsidiary-TIPL, both present and future.Fur<strong>the</strong>r <strong>the</strong> Parent Company has provided a Corporate Guarantee for <strong>the</strong> credit/loan facilitiesavailed of by its subsidiary-TIPL.]Interest accrued and due on term loans 2,144 1,381Vehicle LoansFrom Banks 7,997 -From Non Banking Financial Company 7,388 -(Repayable within one year ` 6,971 thousand)[Vehicle loans are secured by hypo<strong>the</strong>cation of <strong>the</strong> vehicles financed.]Total 1,784,903 499,000(b) Unsecured Loans (Short Term)From BanksIn Indian Rupee 560,480 200,015In Foreign Currency - 394,718From O<strong>the</strong>rs - 100Total 560,480 594,833
86Schedule forming part of <strong>the</strong> Consolidated Balance Sheet(` in ‘000)As at 31.03.2011 As at 31.03.2010SCHEDULE ‘D’Current Liabilities and ProvisionsCurrent Liabilities :Acceptances 58,803 -Sundry Creditors 1,714,552 1,160,310Advance from Customers and o<strong>the</strong>rs 387,798 189,628Investor Education and Protection Fund ( <strong>the</strong> Fund ) shall be credited by <strong>the</strong> following amount :Unclaimed/Unpaid Dividends @ 1,709 1,216Unclaimed/Unpaid Matured Deposits @ 10 10Security Deposit from Customers 19,285 23,611O<strong>the</strong>r Liabilities 235,935 278,191Interest accrued but not due on Loans 5,729 2,6702,423,821 1,655,636Provisions for :Accrued Leave Encashment Benefit for employees 42,178 29,721Provision for Taxation 1,112,645 867,374Proposed Dividend :On Equity Shares 60,182 60,182Tax on Dividend 9,763 9,9951,224,768 967,272Total 3,648,589 2,622,908@ No amount is due at <strong>the</strong> year end for credit to <strong>the</strong> Fund.
Over<strong>view</strong> Performance Re<strong>view</strong>s Governance Financials87Annual Report 2010-11Schedule forming part of <strong>the</strong> Consolidated Balance Sheet(` in ‘000 )SCHEDULE ‘E’Fixed Assets GROSS BLOCK DEPRECIATION NET BLOCKCost/Valuation asat 31.03.2010Additions/Adjustmentduring <strong>the</strong>yearSales/Adjustmentetc during <strong>the</strong>yearCost /Valuation asat 31.03.2011As At31.03.2010For <strong>the</strong> year Sales/Adjustmentetc during <strong>the</strong>yearTangible AssetsFreehold Land 39,543 152,219 - 191,762 - - - - 191,762 39,543Leasehold Land 45,112 288,200 - 333,312 6,049 1,637 - 7,686 325,626 39,063Buildings :Leasehold 159,991 19,159 - 179,150 37,845 4,624 - 42,469 136,681 122,146Freehold 103,123 96,375 - 199,498 43,119 2,045 - 45,164 154,334 60,004Plant and Machinery 1,415,399 296,019 145,217 1,566,201 628,413 175,893 84,620 719,686 846,515 786,986Furniture and Equipment 163,473 22,972 5,059 181,386 95,287 13,314 4,994 103,607 77,779 68,186Cycle and Motor Vehicles 74,651 32,716 1,502 105,865 43,900 7,951 1,048 50,803 55,062 30,751Sub Total 2,001,292 907,660 151,778 2,757,174 854,613 205,464 90,662 969,415 1,787,759 1,146,679Intangible Assets(acquired items)Technical Know-how 93,624 3,844 - 97,468 83,329 3,023 - 86,352 11,116 10,295Goodwill arising onconsolidationAs At31.03.2011As at31.03.2011As at31.03.201035 - - 35 - - - - 35 35Software 14,078 54 594 13,538 13,803 - 131 13,672 (134) 275Sub Total 107,737 3,898 594 111,041 97,132 3,023 131 100,024 11,017 10,605Total 2,109,029 911,558 152,372 2,868,215 951,745 208,487 90,793 1,069,439 1,798,776 1,157,284Capital Work-in-Progress 114,457* 199,006*Grand Total 2,109,029 911,558 152,372 2,868,215 951,745 208,487 90,793 1,069,439 1,913,233 1,356,290Previous year 1,818,715 397,830 107,516 2,109,029 814,821 195,061 58,137 951,745* Includes expenditure on New Project of <strong>the</strong> Parent Company ` 86,447 thousand (Previous Year ` 163,664 thousand).Refer Note 5 on Schedule ‘O’
88Schedule forming part of <strong>the</strong> Consolidated Balance Sheet(` in ‘000)As at 31.03.2011 As at 31.03.2010Number Value Number ValueSCHEDULE ‘F’Investments - Long Term - At CostO<strong>the</strong>r than TradeQuoted :Eveready Industries India Limited Shares of ` 5/- each fully paid 1,266 180 1,266 180Mcleod Russel India Limited Shares of ` 5/- each fully paid 1,266 181 1,266 181Bank of India Shares of ` 10/- each fully paid 7,900 356 7,900 356Unquoted :Woodlands Multispeciality Hospital Limited 1/2 % Debentures of ` 100/- each fully paid 20 2 20 2Gulshan Villa Premises Co-operative Society Limited Shares of ` 50/- each fully paid ( ` 500/- ) 10 10Total 719 719Aggregate book value of investmentsQuoted 717 717Unquoted 2 2Total 719 719Aggregate market value of quoted investments 3,332 3,106(` in ‘000)As at 31.03.2011 As at 31.03.2010SCHEDULE ‘G’InventoriesStores - at or under cost 6,414 5,335Loose tools - at or under cost 21,484 22,504Raw Materials -at lower of cost and net realisable value 491,784 250,402[including in Transit ` 10,233 thousand (Previous year ` 5,109 thousand)]Stock-in-Trade-at lower of cost and net realisable value 2,688,844 1,478,705Work-in-Progress-at lower of cost and net realisable value 175,650 173,413Total 3,384,176 1,930,359(` in ‘000)As at 31.03.2011 As at 31.03.2010SCHEDULE ‘H’Sundry Debtors (Unsecured -Considered Good)Debts outstanding for more than six months 155,495 95,750O<strong>the</strong>r Debts 1,767,933 1,582,691Total 1,923,428 1,678,441
Over<strong>view</strong> Performance Re<strong>view</strong>s Governance Financials89Annual Report 2010-11Schedule forming part of <strong>the</strong> Consolidated Balance Sheet(` in ‘000)As at 31.03.2011 As at 31.03.2010SCHEDULE ‘I’Cash and Bank BalancesCash in hand 22,371 19,072Balance with BanksOn Current Accounts 351,977 107,922On Dividend Accounts 1,709 1,216On Fixed Deposit 178,170 302,562Total 554,227 430,772(` in ‘000)As at 31.03.2011 As at 31.03.2010SCHEDULE ‘J’O<strong>the</strong>r Current Assets (Unsecured-Considered Good)Interest accrued on Fixed Deposits 430 3,441Claims Receivable 248,584 114,843Accrued duty benefits pertaining to Exports/Deemed Exports 13,368 6,934Deposits 59,612 58,037Total 321,994 183,255(` in ‘000)As at 31.03.2011 As at 31.03.2010SCHEDULE ‘K’Loans and Advances (Unsecured-Considered Good)Advances recoverable in cash or in kind or forvalue to be received 139,626 97,017Advance Income Tax (Including Tax deducted at source) 1,105,230 859,619Total 1,244,856 956,636
90Schedule forming part of <strong>the</strong> Consolidated Profit and Loss Account(` in ‘000)Year Ended 31.03.2011 Year Ended 31.03.2010SCHEDULE ‘L’O<strong>the</strong>r IncomeSale of Scraps 9,697 8,119Income from Long Term Investments - Dividend 61 66Profit on Sale of Fixed Assets (Net) 20,388 19,523Interest :- On Income Tax Refunds 2,337 -- On deposit with Banks and O<strong>the</strong>rs 30,604 17,611Bad Debts Recovery - 3,261Liabilites no longer required written back 6,230 25,076Discounts 767 4,759Miscellaneous Income 17,387 36,485Total 87,471 114,900(` in ‘000)Year Ended 31.03.2011 Year Ended 31.03.2010SCHEDULE ‘M’Cost of Materials and Direct Manufacturing ExpensesOpening StockRaw Materials -in Hand 245,293 367,208in Transit 5,109 7,785Stock in Trade 1,478,705 1,318,5641,729,107 1,693,557Add : Purchases 11,862,042* 7,765,351*13,591,149 9,458,908Less : Closing StockRaw Materials -in Hand 487,965 245,293in Transit 10,233 5,109Stock in Trade 2,688,844 1,478,7053,187,042 1,729,10710,404,107 7,729,801Add : Opening Work-in-Progress 173,413 102,45310,577,520 7,832,254Less : Closing Work-in-Progress 175,650 173,41310,401,870 7,658,841Less : Capitalised 16,881 24,34710,384,989 7,634,494Direct Wages 15,590 13,656Incentive Payments 15,311 11,540Consumption of Stores 42,346 34,924Carriage Inward 142,735 154,030Total 10,600,971 7,848,644* Purchases are net of ` 1,210 thousand (Previous year Nil) on account of accrued duty benefit pertaining to Exports/ Deemed Exports.
Over<strong>view</strong> Performance Re<strong>view</strong>s Governance Financials91Annual Report 2010-11Schedule forming part of <strong>the</strong> Consolidated Profit and Loss Account(` in ‘000)Year Ended 31.03.2011 Year Ended 31.03.2010SCHEDULE ‘N’ExpensesSalaries , Wages , Bonus etc. 864,732 753,495Contribution to Provident and o<strong>the</strong>r Funds 97,090 93,668Staff Welfare Expenses 31,323 26,660Rent 43,753 37,934Rates and Taxes 18,853 22,669Bank Charges 44,141 35,616Insurance 25,673 21,747Repairs and Maintenance :Buildings 27,989 16,557Plant and Machinery 43,348 39,492O<strong>the</strong>rs 15,096 25,62386,433 81,672Travelling Expenses 207,681 123,363Stationery and Printing 15,494 10,770Postage,Telephones and o<strong>the</strong>r Communication Expenses 34,713 23,669Advertising 14,318 7,760Gas and Electricity 32,890 26,083Commission 40,345 20,827Miscellaneous Expenses 143,457 127,404Forwarding Charges (Net) 40,509 39,345Royalties 17,155 15,000Medical Expenses 19,465 14,912Professional Fees 48,318 8,540Motor Car and Van Expenses 22,442 16,229Service Support Expenses 50,893 27,522Debts/Advances/Claims written off 29,514 9,893Total 1,929,192 1,544,778
92Schedule forming part of <strong>the</strong> Consolidated Financial Statements for <strong>the</strong> year ended 31st March, 2011SCHEDULE ‘O’Notes1. The Consolidated Financial Statements are prepared to comply in all material aspects with all <strong>the</strong> applicable accounting principles in India, <strong>the</strong> applicableAccounting Standards notified under section 211(3C) of <strong>the</strong> Companies Act, 1956 and <strong>the</strong> relevant provisions of <strong>the</strong> Companies Act, 1956.2. The Consolidated Financial Statements represent consolidation of Financial Statements of TIL Limited (TIL) (Parent Company) with its subsidiaries( toge<strong>the</strong>r referred to as ‘ <strong>the</strong> Group’ ) as detailed below :Name of <strong>the</strong> Subsidiary Country of Incorporation Proportion ofAccounting YearOwnership InterestMyanmar Tractors Limited. (MTL) Myanmar 81% 1st April to 31st MarchTIL Overseas Pte. Limited. (TILO) Singapore 100% 1st April to 31st MarchTractors Nepal Private Limited. (TNPL) Nepal 100% 1st April to 31st MarchTractors India Private Limited. (TIPL) India 100% 1st April to 31st March3. The Consolidated Financial Statements have been prepared on <strong>the</strong> following basis:The Financial Statements of <strong>the</strong> Parent Company and its subsidiaries (indicated above) have been combined on a line-by-line basis by addingtoge<strong>the</strong>r <strong>the</strong> book values of like items of assets, liabilities, income and expenses after fully adjusting/ eliminating intra-Group balances and intra- Grouptransactions and resulting unrealised profits. Unrealised losses resulting from intra-Group transactions are eliminated unless cost cannot berealised.The Consolidated Financial Statements are prepared by adopting uniform accounting policies for like transactions and o<strong>the</strong>r events in similarcircumstances and are presented to <strong>the</strong> extent possible (with appropriate regrouping realignment), except as indicated in Note 4 below, in <strong>the</strong> samemanner as <strong>the</strong> Parent Company’s separate Financial Statements.The translation of <strong>the</strong> functional currencies into Indian Rupees (reporting currency) is performed for equity in <strong>the</strong> foreign subsidiary, assetsand liabilities using <strong>the</strong> closing exchange rate at <strong>the</strong> Balance Sheet date, and for income and expenses using average exchange rate prevailingduring <strong>the</strong> year. The resultant exchange difference arising out of such transactions is recognised as part of equity ( Foreign Currency TranslationReserve ) by <strong>the</strong> Parent Company un<strong>til</strong> <strong>the</strong> disposal of investment.The excess of cost to <strong>the</strong> Parent Company of its investment in <strong>the</strong> subsidiaries over parent’s portion of equity of subsidiaries at <strong>the</strong> dates <strong>the</strong>y becomesubsidiaries is recognised in <strong>the</strong> consolidated Financial Statements as Goodwill. Goodwill arising on consolidation is initially recognised as an assetat cost and is subsequently measured at cost less any accumulated impairment loss.4. Accounting policies for <strong>the</strong> Group are same as followed by <strong>the</strong> Parent Company (TIL Limited) as indicated in Note 2 on Schedule ‘O’ of TIL Limited’sAccounts for <strong>the</strong> year ended 31st March, 2011, except as follows :Loose Tools of MTL are written off over a period of 4 years.Fixed Assets of <strong>the</strong> subsidiaries have not been revalued.Fixed Assets of MTL and TILO are depreciated under <strong>the</strong> Straight Line Method over <strong>the</strong>ir estimated useful lives (being lower than <strong>the</strong> useful livesprescribed under Schedule XIV to <strong>the</strong> Companies Act, 1956 of India) as indicated below -Category of AssetsUseful lives (in years)Buildings 5Motor Vehicles and Motor Cycles 5Office Equipment 5Furniture and Fittings 5Computer Hardware 4-6Computer Software 5Machineries 5Rental Machines 5
Over<strong>view</strong> Performance Re<strong>view</strong>s Governance Financials93Annual Report 2010-11Schedule forming part of <strong>the</strong> Consolidated Financial Statements for <strong>the</strong> year ended 31st March, 2011SCHEDULE ‘O’ (Contd.)Depreciation charge for <strong>the</strong> year and year-end Accumulated Depreciation includes ` 23,460 thousand (previous year ` 24,488 thousand) and` 137,407 thousand (previous year ` 128,378 thousand) respectively computed by certain subsidiaries applying different depreciation method/rates. Had <strong>the</strong> depreciation method/rates of <strong>the</strong> Parent Company been followed by such subsidiaries, <strong>the</strong> impact <strong>the</strong>reof on depreciation charge for<strong>the</strong> year and year-end accumulated depreciation is not readily ascertainable.Retirement Benefits(i) TIL Limited and its subsidiary ie TIPL have <strong>the</strong> following retirement benefit schemes for its employees:(a) Contributions towards provident funds are recognised as expense. Provident fund contributions in respect of employees are madeto common trust- ‘Tractors India Employees Provident Fund’ (being administered by <strong>the</strong> trustees of <strong>the</strong> said fund for <strong>the</strong> benefit ofemployees of TIL Limited and TIPL) and such Trust invest funds following a pattern of investment prescribed by <strong>the</strong> Government. Theinterest rate payable to <strong>the</strong> members of <strong>the</strong> Trusts is not lower than <strong>the</strong> rate of interest declared annually by <strong>the</strong> Central Governmentunder <strong>the</strong> Employees’ Provident Funds and Miscellaneous Provisions Act,1952 and shortfall, if any, on account of interest, is made goodby <strong>the</strong> respective Companies.Contributions under Employees’ Pension Scheme is made as per statutory requirements and charged as expenses for <strong>the</strong> year.(b) TIL Limited and TIPL also contributes to <strong>the</strong> Central Government administered Employees’ State Insurance Scheme for its eligibleemployees, which is a defined contribution plan.(c) Provisions for Gratuity for eligible employees is ( being a defined benefit plan ) made on <strong>the</strong> basis of year-end actuarial valuation.(d) In respect of certain eligible employees who have attained 45 years of age as on 1st April 2009, provision for Superannuation underdefined benefit plan is made on <strong>the</strong> basis of year end actuarial valuation.In respect of certain eligible employees who have not attained 45 years of age as on 1st April 2009 provision for Superannuationis made :-- under defined contribution scheme in respect of services rendered with effect from 1st April 2009.- under defined benefit scheme in respect of services rendered up to 31st March 2009, based on frozen pensionable salary as on31st March 2009.(e) Actuarial gains / losses arising in Defined Benefit Plans are recognised in <strong>the</strong> Profit and Loss Account as income or expenses in <strong>the</strong> yearin which <strong>the</strong>y occur.(f) Accrued liability towards Leave Encashment benefits, covering eligible employees, evaluated on <strong>the</strong> basis of year-end actuarialvaluation, is recognised as a charge.(ii) The foreign subsidiaries MTL, TILO and TNPL do not have any Defined Benefit Retirement Schemes for its employees.5. Based on <strong>the</strong> valuation report submitted by <strong>the</strong> valuers appointed for <strong>the</strong> purpose, certain items of <strong>the</strong> Parent company’s fixed assets(viz. Freehold and Leasehold Land, Freehold and Leasehold Buildings and Plant and Machinery) were revalued on 31st March,1993 after considering <strong>the</strong>following factors :-- The <strong>the</strong>n estimated current market value pertaining to Leasehold Land and Freehold Land and Buildings <strong>the</strong>reon.- Value of Plant and Machinery based on <strong>the</strong>ir <strong>the</strong> <strong>the</strong>n current cost of replacement.- Adjustments for <strong>the</strong> <strong>the</strong>n condition, <strong>the</strong> standard of maintenance, depreciation up to valuation date etc.The resultant revaluation surplus of ` 247,234 thousand, arising from <strong>the</strong> aforesaid revaluation, were transferred to Revaluation Reserve as reflected in <strong>the</strong>Parent Company’s annual accounts for 1992-93.Depreciation on <strong>the</strong>se revalued assets o<strong>the</strong>r than land (calculated on <strong>the</strong>ir respective revalued amounts at rates considered applicable by <strong>the</strong> valuers on<strong>the</strong> straight line method ) includes an additional charge of ` 1,545 thousand (Previous Year ` 1,545 thousand) and an amount equivalent to <strong>the</strong> additionalcharge has been transferred to <strong>the</strong> Profit and Loss Account from Revaluation Reserve; such transfer, according to an authoritative professional <strong>view</strong> beingacceptable for <strong>the</strong> purpose of <strong>the</strong> Parent company’s annual accounts. In consequence, <strong>the</strong> effective depreciation rates (o<strong>the</strong>r than leasehold land) are asper Schedule XIV to <strong>the</strong> Companies Act, 1956.
94Schedule forming part of <strong>the</strong> Consolidated Financial Statements for <strong>the</strong> year ended 31st March, 2011SCHEDULE ‘O’ (Contd.)6.1 (a) Particulars pertaining to <strong>the</strong> post retirement defined benefit plans in respect of TIL LIMITED and its Subsidiary-Tractors India Private Limitedare as follows :-(` in ‘000)DescriptionSuperannuation Fund (Funded)Gratuity Fund (Funded)2010-11 2009-10 2008-09 2007-08 2006-07 2010-11 2009-10 2008-09 2007-08 2006-071. Reconciliation of <strong>the</strong> Opening and Closing balances of <strong>the</strong> PresentValue of Obligationa. Present Value of Obligation at <strong>the</strong> Beginning of <strong>the</strong> Year 190,516 188,976 141,204 121,103 111,543 64,187 53,945 54,762 55,674 50,111b. Current Service Cost 8,288 7,560 7,417 14,386 6,321 5,327 4,323 4,025 4,711 3,264c. Interest Cost 14,622 12,957 11,546 9,507 8,276 4,875 4,026 4,333 4,247 3,669d. Curtailment Cost/(Credit) - - (17,109) - - - - - - -e. Actuarial (gain)/loss 14,785 35,039 56,646 3,678 3,086 22,458 9,139 (1,594) (3,006) 3,554f. Benefits paid (28,694) (54,016) (10,728) (7,470) (8,123) (10,912) (7,246) (7,581) (6,864) (4,924)g. Present Value of Obligation at <strong>the</strong> end of <strong>the</strong> Year 199,517 190,516 188,976 141,204 121,103 85,935 64,187 53,945 54,762 55,6742. Reconciliation of <strong>the</strong> Opening and Closing balances of <strong>the</strong> Fair Valueof Plan Assets :a. Fair value of Plan Assets at <strong>the</strong> Beginning of <strong>the</strong> Year 190,624 154,162 125,015 103,326 86,900 56,355 57,770 53,793 50,167 43,916b. Adjustment to (a) above,on restatement by new actuary - - - (8,026) - - - - (2,000) -c. Expected return on Plan Assets 15,524 13,182 11,382 7,600 6,752 5,376 4,579 4,565 3,983 3,675d. Actuarial gain/(loss) 519 2,058 (7) - - (710) (4,920) (407) - -e. Contributions by <strong>the</strong> Employer 21,520 75,238 28,500 29,585 17,797 27,752 6,172 7,400 8,507 7,500f. Benefits paid (28,694) (54,016) (10,728) (7,470) (8,123) (10,912) (7,246) (7,581) (6,864) (4,924)g. Fair value of Plan Assets at <strong>the</strong> end of <strong>the</strong> Year 199,493 190,624 154,162 125,015 103,326 77,861 56,355 57,770 53,793 50,1673. Reconciliation of <strong>the</strong> Present Value of Obligation and Fair Value of<strong>the</strong> Plan Assets :a. Fair value of Plan Assets at <strong>the</strong> end of <strong>the</strong> Year 199,493 190,624 154,162 125,015 103,326 77,861 56,355 57,770 53,793 50,167b. Present Value of Obligation at <strong>the</strong> end of <strong>the</strong> Year 199,517 190,516 188,976 141,204 121,103 85,935 64,187 53,945 54,762 55,674c. (Asset)/Liabilities recognised in <strong>the</strong> Balance Sheet 24 (108) 34,814 16,189 17,777 8,074 7,832 (3,825) 969 5,5074. Expenses recognised during <strong>the</strong> year :a. Current Service cost 8,288 7,560 7,417 14,386 6,321 5,327 4,323 4,025 4,711 3,264b. Interest cost 14,622 12,957 11,546 9,507 8,276 4,875 4,026 4,333 4,247 3,669c. Expected return on Plan Assets (15,524) (13,182) (11,382) (7,600) (6,752) (5,376) (4,579) (4,565) (3,983) (3,675)d. Curtailment Cost/(Credit) - - (17,109) - - - - - - -e. Actuarial (Gain) / Loss 14,266 32,981 56,653 3,678 3,086 23,168 14,059 (1,187) (3,006) 3,554f. Expense recognised during <strong>the</strong> year 21,652 40,316 47,125 19,971 10,931 27,994 17,829 2,606 1,969 6,8125. Experience Adjustments on Plan Obligation and Assetsa. Experience Adjustments on Plan Obligation [(Gain)/Loss] 16,837 25,583 51,488 12,306 25,220 23,483 6,974 4,169 (1,682) 6,174b. Experience Adjustments on Plan Assets [(Gain)/Loss] 519 2058 (7) - - (710) (4920) (407) - -Description Superannuation Fund % Invested Gratuity Fund % Invested31.03.11 31.03.10 31.03.09 31.03.08 31.03.07 31.03.11 31.03.10 31.03.09 31.03.08 31.03.076. Investment Details of Plan Assets as ata. Govt of India Securities 20.53 19.63 17.87 15.29 12.45 20.79 14.97 15.05 13.29 12.31b. Public Sector ( PSU )Bonds 47.16 42.47 46.69 39.79 46.68 30.54 27.18 26.42 24.58 28.85c. State / Central Govt Securities 16.82 17.30 11.82 17.62 3.95 18.70 16.58 17.32 17.18 7.27d. Special Deposit Scheme 14.99 16.30 21.12 25.97 33.24 29.81 40.87 41.09 44.34 48.18e. O<strong>the</strong>r including Bank Balance 0.50 4.30 2.50 1.33 3.68 0.16 0.40 0.12 0.61 3.39Total 100.00 100.00 100.00 100.00 100.00 100.00 100.00 100.00 100.00 100.007. Assumptionsa. Discount rate per annum 8.50 8.30 8.00 8.50 8.10 8.50 8.30 8.00 8.50 8.13b. Salary escalation rate per annum 4.00 4.00 3.00 3.00 3.00 4.00 4.00 3.00 5.00 3.00c. Expected rate of return on Plan Assets per annum 8.00 8.00 8.50 8.10 7.15 8.00 8.00 8.50 8.13 8.13d. Method used Projected Unit Credit Method Projected Unit Credit Method8. Actual Return on Plan Assets 7.64% 7.61% 7.38% 7.09% 7.36% 6.53% 7.89% 7.20% 7.64% 7.70%
Over<strong>view</strong> Performance Re<strong>view</strong>s Governance Financials95Annual Report 2010-11Schedule forming part of <strong>the</strong> Consolidated Financial Statements for <strong>the</strong> year ended 31st March, 2011SCHEDULE ‘O’ (Contd.)6.1 (b) The basis used to determine overall expected rate of return on assets and <strong>the</strong> effect on major categories of Plan Assets is as follows :The major portions of <strong>the</strong> Assets are invested in PSU Bonds and Special Deposits. Based on <strong>the</strong> asset allocation and prevailing yield rates on <strong>the</strong>seasset classes, <strong>the</strong> long term estimate of <strong>the</strong> expected rate of return on <strong>the</strong> fund assets have been arrived at. Assumed rate of return on assets isexpected to vary from year to year reflecting <strong>the</strong> returns on matching Government Bonds.6.1 (c) The estimate of future salary increases take into account inflation, seniority, promotion and o<strong>the</strong>r relevant reasons.6.1 (d) In terms of <strong>the</strong> Guidance on implementing Accounting Standard(AS) 15 on Employee Benefits issued by <strong>the</strong> Accounting Standards Board of <strong>the</strong>Institute of Chartered Accountants of India, a provident fund set up by <strong>the</strong> Parent Company and its subsidiary i.e. TIPL is treated as a defined benefitplan since <strong>the</strong> Companies are obligated to meet interest shortfall, if any. However, at <strong>the</strong> year end, no shortfall remains unprovided for. The Actuaryhas expressed his inability to provide an actuarial valuation of <strong>the</strong> provident fund liability as at <strong>the</strong> year end in <strong>the</strong> absence of any guidance from <strong>the</strong>Actuarial Society of India. Accordingly, complete information required to be considered as per AS 15 in this regard are not available and <strong>the</strong> samecould not be disclosed. During <strong>the</strong> year, <strong>the</strong> said companies have contributed ` 25,421 thousand (Previous year ` 17,974 thousand) to <strong>the</strong> ProvidentFunds.6.2 The Group recognised in <strong>the</strong> Profit and Loss account for <strong>the</strong> year ended 31st March, 2011 an amount of ` 21,468 thousand (Previous year ` 16,492thousand) as charge under defined contribution plans and ` 75,067 thousand (Previous year ` 76,119 thousand) as charged under defined plans, whichis included in <strong>the</strong> line item under ‘Contribution to Provident and O<strong>the</strong>r Funds’ on Schedule ‘N’7 Ownership of a flat (cost ` 3,937 thousand) belonging to <strong>the</strong> Parent Company in a Co-operative Housing Society is registered in <strong>the</strong> name of <strong>the</strong>Managing Director of erstwhile Spundish Engineering Ltd.8. Earnings Per Share (EPS) - The numerators and denominators used to calculate Basic and Diluted EPS:Year Ended 31.03.2011 Year Ended 31.03.2010Profit after Tax attributable to <strong>the</strong> Equity Shareholders (` ‘000) A 601,948 595,2618.1. Basici. Number of Equity Shares at <strong>the</strong> beginning of <strong>the</strong> year 10,030,265 10,030,265ii. Number of Equity Shares issued during <strong>the</strong> year - -iii. Number of Equity Shares at <strong>the</strong> end of <strong>the</strong> year 10,030,265 10,030,265iv. Weighted average number of Equity Shares outstanding during <strong>the</strong> year B 10,030,265 10,030,265Nominal Value of each Equity Share (`) 10 10Basic Earnings per Share (`) A/B 60.01 59.358.2. Dilutedi. Number of Potential Equity Shares at <strong>the</strong> beginning of <strong>the</strong> year - 2,693,707ii. Number of Potential Equity Shares issued during <strong>the</strong> year - -iii. Number of Potential Equity Shares converted/forfeited during <strong>the</strong> year - (2,693,707)iv. Number of Potential Equity Shares at <strong>the</strong> end of <strong>the</strong> year - -Diluted Earnings per Share (`) 60.01 59.35(` in ‘000)Year Ended 31.03.2011 Year Ended 31.03.20109 Year-end Deferred Tax balance comprises <strong>the</strong> following :Timing Difference resulting in liabilities / (assets) on account of :Difference between net book value of depreciable Capital Asset as per books87,166 78,400vis-à-vis written down value as per Income Tax.Disallowances allowable for tax purpose on payments (18,726) (18,726)Deferred Tax Liability (Net) 68,440 59,674
96Schedule forming part of <strong>the</strong> Consolidated Financial Statements for <strong>the</strong> year ended 31st March, 2011SCHEDULE ‘O’ (Contd.)10. Contingent Liabilities in respect of -10.1 Sales Tax Matters under dispute [Net of payments ` 1,145 thousand (Previousyear ` 3,243 thousand)]10.2 Income Tax matters under dispute[Excludes disputed Income Tax matters, in <strong>view</strong> of favourable Tribunaldecision in similar case](` in ‘000)Year Ended 31.03.2011 Year Ended 31.03.201037,274 6,54612,790 1,80910.3 Service Tax matters under dispute [Net of payments ` 21,671 thousand109,692 96,261(Previous year ` 20,208 thousand)]10.4 Excise Duty matters under dispute [Net of payments ` 3,918 thousand6,172 5,329(Previous year ` 1,648 thousand)]10.5 O<strong>the</strong>rs 2,672 57511. Guarantees:-11.1 Bank Guarantees outstanding 479,554 346,59311.2 Corporate Guarantee given by Parent Company on behalf of Subsidiaries :- LimitTractors India Private Limited 4,000,600 NilMyanmar Tractors Limited 89,740 90,600TIL Overseas Pte. Ltd. 67,305 67,950- Amount outstanding at year-endTractors India Private Limited 2,200,400 NilMyanmar Tractors Limited Nil NilTIL Overseas Pte. Ltd. Nil Nil12. Capital Commitment [Net of advance ` 30,712 thousand (Previous year` 22,237 thousand)]567,722 18,566
Over<strong>view</strong> Performance Re<strong>view</strong>s Governance Financials97Annual Report 2010-11Schedule forming part of <strong>the</strong> Consolidated Financial Statements for <strong>the</strong> year ended 31st March, 2011SCHEDULE ‘O’ (Contd.)13. Technical Know-how [ shown under Intangible Assets - Schedule ‘E’ ] represents technical drawings, designs etc. relating to manufacture of <strong>the</strong> ParentCompany’s products acquired pursuant to various agreements conferring <strong>the</strong> right to manufacture and usage only.14. During <strong>the</strong> year TIPL’s long term composite maintenance contract with a customer, which entailed, inter-alia, supply of parts, was completed. The liabilityaccumulated in respect of earlier years amounting to ` 145,394 thousand [arising from payments received in advance as per <strong>the</strong> billing/payment schedule,which was time phased] has been appropriately adjusted, as in earlier years, against supply of parts in <strong>the</strong> current year.15. The Group has various Plant and Machinery (namely Diesel Generating Sets, Machines etc.) given under cancellable operating leases. Leases range forperiods between 6 months to 3 years. Terms of lease include terms for renewal, cancellation etc. Initial Direct costs (commissioning, installation etc.) forsuch assets are borne by <strong>the</strong> lessee, o<strong>the</strong>r than transportation cost, which is borne by <strong>the</strong> lessor and charged off to revenue. Lease rentals recognised asincome during <strong>the</strong> year ` 220,086 thousand (Previous Year ` 240,356 thousand). O<strong>the</strong>r details for such Plant and Machinery are as below.(` in ‘000)Gross Block Accumulated Depreciation DepreciationAs at 31.03.2011 As at 31.03.2010 As at 31.03.2011 As at 31.03.2010 Year Ended 31.03.2011 Year Ended 31.03.2010741,090 647,032 261,937 199,182 100,345 93,78816. The Group has various residential / commercial premises taken under cancellable operating lease. Leases range for periods between 3 to 5 years. Termsof <strong>the</strong> lease include operating term for renewal, increase in rent for future periods, terms of cancellation etc. The operating lease payments for <strong>the</strong> yearamount to ` 40,909 thousand (Previous Year ` 28,320 thousand)17. Information given in accordance with <strong>the</strong> requirements of Accounting Standard 17 on “Segment Reporting” -The Group’s business segments are organised on product lines as follows:Material Handling Solutions (MHS)- engaged in manufacturing and marketing of various Material Handling Equipments namely Mobile Cranes,Port Equipment (Reach stacker , Level Luffing Cranes), Self Loading Truck Cranes etc. and dealing in spares and providing services to relatedequipments.Construction & Mining Solutions (CMS) - engaged as a dealer for Caterpillar Inc. USA for <strong>the</strong>ir earthmoving, construction mining equipments,spares etc. and providing related services in Eastern and Nor<strong>the</strong>rn India, Bhutan,Nepal and Myamnar.Power Systems Solutions (PSS) - engaged in assembly, supply, erection and commissioning of Generating Sets powered by Caterpillar enginesand dealing in spares and providing related services in Eastern and Nor<strong>the</strong>rn India, Bhutan,Nepal and Myamnar.O<strong>the</strong>rs represent all unallocated expenditure and include expenses incurred on common services provided to <strong>the</strong> segments which are not directlyidentifiable to <strong>the</strong> individual segments as well as expenses incurred at <strong>the</strong> corporate level which relate to <strong>the</strong> company as a whole.
98Schedule forming part of <strong>the</strong> Consolidated Financial Statements for <strong>the</strong> year ended 31st March, 2011SCHEDULE ‘O’ (Contd.)I) Information about primary segments - Business Segments(` in ‘000)Year Ended 31.03.2011MHS CMS PSS OTHERS TOTAL(Unallocated)Segment Revenue* 2,068,588 8,459,151 3,278,017 33,002 13,838,758(1,699,138) (6,463,111) (2,470,476) (27,800) (10,660,525)Segment Results 264,016 512,272 292,363 - 1,068,651(383,825) (695,053) (285,706) - (1,364,584)Add(+)/(Less)(-): Unallocated income+ 33,002 + 33,002net off unallocated expense(+)/ [Unallocated expense netoff unallocated income(-)]- (290,997) - (290,997)Interest expenses 201,072 201,072(160,008) (160,008)Profit before tax 900,581(913,579)Depreciation and Amortisation 27,736 100,932 64,402 13,872 206,942(26,378) (106,635) (42,750) (17,753) (193,516)Non Cash Expenses o<strong>the</strong>r thanDepreciation and Amortisation 8,079 14,314 7,121 - 29,514(3,910) (2,722) (3,261) - (9,893)Segment Assets 2,186,518 3,751,512 2,298,075 1,106,528 9,342,633(1,224,435) (2,944,516) (1,457,643) (909,878) (6,536,472)Segment Liabilities 482,882 1,035,670 941,784 3,602,076 6,062,412(excluding Shareholders’ Funds) (299,580) (922,015) (403,381) (2,151,439) (3,776,415)Capital Expenditure 469,618 183,695 155,162 18,534 827,009(82,592) (183,907) (137,169) (5,538) (409,206)* There is no inter segment revenue.Previous year’s figures in bracket.II)Information about secondary segments - Geographical Segments(` in ‘000)Year Ended 31.03.2011 Year Ended 31.03.2010RevenueIndia 11,075,407 8,489,520Outside India 2,730,349 2,143,20513,805,756 10,632,725AssetsIndia 6,802,964 4,428,311Outside India 1,433,141 1,198,2838,236,105 5,626,594Capital ExpenditureIndia 795,213 390,114Outside India 13,262 13,554808,475 403,668
Over<strong>view</strong> Performance Re<strong>view</strong>s Governance Financials99Annual Report 2010-11Schedule forming part of <strong>the</strong> Consolidated Financial Statements for <strong>the</strong> year ended 31st March, 2011SCHEDULE ‘O’ (Contd.)18. Related Party Disclosure in keeping with Accounting Standard 18 on “Related Party Disclosures”.A) List of Related PartiesKey Management PersonnelMr. A. Mazumdar (Chairman and Whole time Director-TIL Limited)Mr. S. Mazumder (Vice Chairman and Managing Director-TIL Limited)Mr. S K Bhatnagar( Whole time Director - TIL Limited)B) Particulars of transactions during <strong>the</strong> year ended 31st March, 2011(` in ‘000)Particulars Year Ended 31.03.2011 Year Ended 31.03.2010Key Management Personnela) RemunerationMr. A. Mazumdar 19,430 23,554Mr. S. Mazumder 19,021 23,631Mr. S K Bhatnagar 12,767 -b) Year end BalanceCommission PayableMr. A. Mazumdar 7,728 16,344Mr. S. Mazumder 7,862 16,356Mr. S K Bhatnagar 5,767 -19. Previous year’s figures have been rearranged / regrouped wherever necessary.Signatures to Schedules ‘A’ to ‘O’For and on behalf of Board of DirectorsFor PRICE WATERHOUSEA. MazumdarFirm Registration No. 301112EChairmanChartered AccountantsSumit MazumderP. Law Vice Chairman & Managing DirectorPartnerMembership Number 51790Kolkata17th May, 2011Sekhar BhattacharjeeCompany Secretary
100Consolidated Cash Flow Statement of TIL Limited and its subsidiariesfor <strong>the</strong> year ended 31st March, 2011.(` in ‘000)Year ended 31.03.2011 Year ended 31.03.2010A. CASH FLOW FROM OPERATING ACTIVITIESNet Profit Before Tax 900,581 913,579Adjustments for :Depreciation and Amortisation 206,942 193,516Bad Debts/Advances etc Written off 29,514 9,893Profit on Sale of Fixed Assets (Net) (20,388) (19,523)Interest Expenses (Net) 168,131 142,397Dividend Income (61) (66)Unrealised Foreign Exchange Loss (Net) (12,266) (7,323)371,872 318,894Operating Profit before Working Capital Changes 1,272,453 1,232,473Adjustments for :Trade and O<strong>the</strong>r Receivables (274,501) (560,847)Inventories (1,453,817) (88,478)Loans and Advances and O<strong>the</strong>r Current Assets (184,359) 82,929Trade Payable 789,356 285,872(1,123,321) (280,524)Cash Generated from Operations 149,132 951,949Direct Taxes Paid (290,207) (311,480)Net Cash (Used in)/from Operating Activities (141,075) 640,469B. CASH FLOW FROM INVESTING ACTIVITIESPurchase of Fixed Assets (827,009) (409,241)Proceeds from Sale of Fixed Assets 81,979 68,899Interest Received 35,952 14,170Dividend Received 61 66Net Cash (Used in)/from Investing Activities (709,017) (326,106)C. CASH FLOW FROM FINANCING ACTIVITIESInterest Paid (192,738) (160,480)Proceeds from Long Term borrowings 48,658 -Repayment of Long Term borrowings (108,752) (63,534)Increase in Cash Credit and o<strong>the</strong>r short term borrowings (Net) 1,306,357 19,841Dividend Paid (69,684) (46,573)Net Cash (Used in)/from Financing Activities 983,841 (250,746)
Over<strong>view</strong> Performance Re<strong>view</strong>s Governance Financials101Annual Report 2010-11Consolidated Cash Flow Statement of TIL Limited and its subsidiariesfor <strong>the</strong> year ended 31st March, 2011. (Contd.)(` in ‘000)Year ended 31.03.2011 Year ended 31.03.2010D. EXCHANGE DIFFERENCES ON TRANSLATION OF FOREIGN(10,294) (92,660)CURRENCY CASH AND CASH EQUIVALENTSNet Increase/(Decrease) In Cash and Cash Equivalents (A+B+C+D) 123,455 (29,043)Cash and Cash Equivalents as at <strong>the</strong>beginning of <strong>the</strong> year (Schedule ‘I’) 430,772 459,803Add: Taken over consequent upon acquisition of Subsidiary Company - 12430,772 459,815Cash and Cash Equivalents as at <strong>the</strong> close of <strong>the</strong> year ( Schedule ‘I’ ) 554,227 430,772Notes :1) The above Cash Flow Statement has been prepared under <strong>the</strong> ‘ Indirect Method ‘ as set out in <strong>the</strong> Accounting Standard - 3 on ‘Cash Flow Statements’.2) The Schedule referred to above forms an integral part of <strong>the</strong> ‘Consolidated Cash Flow Statement’.3) Previous year’s figures have been rearranged / regrouped wherever necessary.This is <strong>the</strong> Consolidated Cash Flow Statement referred to in our report of even date.For and on behalf of Board of DirectorsFor PRICE WATERHOUSEA. MazumdarFirm Registration No. 301112EChairmanChartered AccountantsSumit MazumderP. Law Vice Chairman & Managing DirectorPartnerMembership Number 51790Kolkata17th May, 2011Sekhar BhattacharjeeCompany Secretary
102Statement Regarding Subsidiary CompaniesPursuant to Section 212(3) of <strong>the</strong> Companies Act, 1956.Name of <strong>the</strong> Company Tractors IndiaPrivate Limited(TIPL)Myanmar TractorsLtd. (MTL)Tractors Nepal Pvt.Ltd. (TNPL)TIL Overseas PTELtd. (TILO)FINANCIAL YEAR ENDING OF THE SUBSIDIARY 31st March 31st March 15th July 31st MarchThe Company’s Interest in <strong>the</strong> subsidiary as on 31st March 2011.a) No. of Equity Shares 45,00,000 19,714 120,000 107,577b) Face Value ` 10 Kyats 1000 NPR 100 S$ 10c) Extent of Holding 100% 81%* 100% 100%Net Aggregate Profit/(Loss) of <strong>the</strong> Subsidiary Company so faras it concerns <strong>the</strong> Members of <strong>the</strong> Company :-A) For <strong>the</strong> financial year ended on 31st March, 2011 :i) Not dealt with in <strong>the</strong> Books of Accounts of <strong>the</strong> Company. ` (‘000) 190,571(100% of <strong>the</strong> PAT)US$ 603,303(100% of <strong>the</strong> PAT)NPR 3,888,166(100% of <strong>the</strong> PAT)US$ 1,867,770(100% of <strong>the</strong> PAT)ii) Dealt with in <strong>the</strong> Books of Accounts of <strong>the</strong> Company. Nil Nil Nil NilB) For <strong>the</strong> Subsidiary Company’s previous financial years since itbecame a subsidiary:i) Not dealt with in <strong>the</strong> Books of Accounts of <strong>the</strong> Company. ` (‘000) (51)(100% of <strong>the</strong> PAT)US$ 6,208,343(100% of <strong>the</strong> PAT)NPR 39,425,257(100% of <strong>the</strong> PAT)US$ $ 8,741,912(100% of <strong>the</strong> PAT)ii) Dealt with in <strong>the</strong> Books of Accounts of <strong>the</strong> Company. Nil Nil Nil Nil* The Balance 19% of <strong>the</strong> Share Capital is held by TILONOTES:1. All Equity Shares are fully paid up.2. There are no material changes between <strong>the</strong> end of <strong>the</strong> applicable Financial Year of <strong>the</strong> subsidiary and that of holding company, o<strong>the</strong>r than thosereflected in <strong>the</strong> Accounts of TIL Limited.A. Mazumdar Sumit Mazumder Sekhar BhattacharjeeChairman Vice Chairman & Managing Director Company SecretaryKolkata17th May, 2011.
Over<strong>view</strong> Performance Re<strong>view</strong>s Governance Financials103Annual Report 2010-11Tractors India Private LimitedBOARD OF DIRECTORSMr. Sumit MazumderChairman and Managing DirectorMr. G.V.R. MurthyJoint Managing DirectorMr. Aloke BanerjeeDirector - FinanceDr. T. MukherjeeNon-Executive Independent DirectorAUDITORSPrice WaterhouseBankersBank of IndiaUnion Bank of IndiaING Vysya Bank Ltd.State Bank of Bikaner & JaipurState Bank of IndiaState Bank of HyderabadAxis Bank Ltd.CITI Bank N.A.REGISTERED OFFICE1, Taratolla RoadGarden ReachKolkata 700 024Telephone: (033) 2469 3732 - 36 (5 Lines)(033) 6633 2000 / 2845
104Directors’ReportYour Directors have pleasure in presenting <strong>the</strong> Annual Report and Accounts for <strong>the</strong> year ended 31st March, 2011.For <strong>the</strong> Year Ended31.03.2011(`/Crores)For <strong>the</strong> Year Ended31.03.20101. FINANCIAL RESULTSProfit for <strong>the</strong> year after meeting all expenses but before charging Depreciation and Interest. 65.64 -Less: Interest 17.70 -Depreciation 14.14 -Profit/(Loss) Before Tax 33.80 -Tax Provisiona) Current Tax 10.48 -b) Deferred Tax(Credit)/Charge 4.26 -Profit/(Loss) After Tax 19.06 -Balance Carried Forward 19.062. RESTRUCTURING OF BUSINESSWith effect from 1st April, 2010 (‘<strong>the</strong> Appointed Date’), <strong>the</strong> dealershipbusiness of Caterpillar comprising Construction and Mining Solutionsand Power Systems Solutions carried out by TIL Limited, <strong>the</strong> holdingCompany has been de-merged as a going concern and vested in <strong>the</strong>Company pursuant to <strong>the</strong> provisions of Sections 391 to 394 of <strong>the</strong>Companies Act, 1956 under a Scheme of Arrangement (‘<strong>the</strong> Scheme’)sanctioned by <strong>the</strong> Hon’ble High Court at Calcutta vide Order dated 12thJuly, 2010. In accordance with <strong>the</strong> Scheme, <strong>the</strong> Company has issued44,89,430 Equity Shares of ` 10/- each to TIL Limited at a premiumof ` 203.48 on every share, aggregating to ` 95,83,96,000/- (RupeesNinety Five Crores Eighty Three Lacs Ninety Six Thousand only).3. PERFORMANCEThe Company started its commercial operation with effect from 1stApril, 2010. Turnover including income from operations and O<strong>the</strong>rIncome for <strong>the</strong> year under re<strong>view</strong> is ` 911.10 Crores. The profit beforetax is ` 33.80 Crores.4. FINANCEThe Reserve & Surplus of <strong>the</strong> Company is ` 110.40 Crores and <strong>the</strong>Shareholders’ Fund is ` 114.90 Crores.
Over<strong>view</strong> Performance Re<strong>view</strong>s Governance Financials105Annual Report 2010-115. DEPOSITThe Company has not accepted any deposits from <strong>the</strong> public during <strong>the</strong> year.6. PARTICULARS OF CONSERVATION OF ENERGY, TECHNOLOGYABSORPTION, FOREIGN EXCHANGE EARNINGS AND OUTGOThe Statement pursuant to Section 217(1)(e) of <strong>the</strong> Companies Act,1956 read with Companies (Disclosure of Particulars in <strong>the</strong> Report of<strong>the</strong> Board of Directors) Rules, 1988 is given in <strong>the</strong> Annexure formingpart of this Report.7. PARTICULARS OF EMPLOYEESThe total number of employees of <strong>the</strong> Company as on 31st March, 2011was 1187.Information in accordance with <strong>the</strong> provisions of Section 217(2A) of <strong>the</strong>Companies Act, 1956, read with Companies (Particulars of Employees)Rules, 1975, as amended, forms part of this Directors’ Report. However,as per <strong>the</strong> provisions of Section 219(1)(b)(iv) of <strong>the</strong> Companies Act,1956, <strong>the</strong> Report and Accounts are being sent to all Shareholders of<strong>the</strong> Company excluding <strong>the</strong> Statement of Particulars of Employeesunder Section 217(2A) of <strong>the</strong> Companies Act, 1956. Any Shareholderinterested in obtaining a copy of <strong>the</strong> said Statement may write to <strong>the</strong>Company Secretary at <strong>the</strong> Registered Office of <strong>the</strong> Company, and <strong>the</strong>same will be sent by post.8. DIRECTORSDr. T. Mukherjee retires by rotation and being eligible, offers himself forre-appointment. The Board recommends his re-appointment.9. DIRECTORS’ RESPONSIBILITY STATEMENTPursuant to provisions of Section 217(2AA) of <strong>the</strong> Companies Act, 1956,<strong>the</strong> Directors confirm that:i) In <strong>the</strong> preparation of <strong>the</strong> annual accounts, <strong>the</strong> applicableaccounting standards have been followed along with properexplanations relating to material departures.ii) The directors have selected such accounting policies and applied<strong>the</strong>m consistently and made judgments and estimates that arereasonable and prudent so as to give a true and fair <strong>view</strong> of <strong>the</strong>state of affairs of <strong>the</strong> Company at <strong>the</strong> end of <strong>the</strong> financial yearand of <strong>the</strong> profit or loss of <strong>the</strong> Company for that period.iii) Proper and sufficient care has been taken for <strong>the</strong> maintenance ofadequate accounting records in accordance with <strong>the</strong> provisionsof <strong>the</strong> Act for safeguarding <strong>the</strong> assets of <strong>the</strong> Company and forpreventing and detecting fraud and o<strong>the</strong>r irregularities.iv) The annual accounts have been prepared on a going concern basis.9. AUDITORSMessrs. PriceWaterhouse, Chartered Accountants, Statutory Auditors of<strong>the</strong> Company, hold office <strong>til</strong>l conclusion of <strong>the</strong> ensuing Annual GeneralMeeting and being eligible, offer <strong>the</strong>mselves for re-appointment.10. AUDITORS’ REPORTThe notes to <strong>the</strong> Accounts referred to in <strong>the</strong> Auditors’ Report are selfexplanatoryand, <strong>the</strong>refore, does not call for any fur<strong>the</strong>r comment underSection 217(3) of <strong>the</strong> Companies Act.11. SECRETARIAL AUDIT REPORTPursuant to Section 383A of <strong>the</strong> Companies Act, 1956, your Companyhas appointed Mr. Tarun Chatterjee of M/s. T. Chatterjee & Associates,Practicing Company Secretaries, to conduct Secretarial Audit of <strong>the</strong>Company for <strong>the</strong> financial year ended March 31, 2011. The SecretarialAudit Report addressed to <strong>the</strong> Board of Directors of <strong>the</strong> Company isattached hereto as part of this report. The Secretarial Audit Reportconfirms that <strong>the</strong> Company has complied with all <strong>the</strong> applicableprovisions of <strong>the</strong> Companies Act, 1956, and all o<strong>the</strong>r Laws as applicableto <strong>the</strong> Company.12. ACKNOWLEDGEMENTSThe Board of Directors takes this opportunity to thank all its valuedCustomers, Principals, TIL Limited, Bankers, and <strong>the</strong> GovernmentAuthorities for <strong>the</strong>ir co-operation and support to <strong>the</strong> Company. TheBoard also takes this opportunity to express its sincere appreciation for<strong>the</strong> excellent support and dedicated efforts put in by <strong>the</strong> each and everyemployee of <strong>the</strong> Company.For and on behalf of Board of DirectorsPlace : KolkataDate : 17th May, 2011.S. MazumderChairman & Managing Director
106Annexure to Directors’ ReportInformation in accordance with Section 217(1)(e) of <strong>the</strong> Companies Act, 1956 and <strong>the</strong> Companies (Disclosure of Particulars in <strong>the</strong>Report of <strong>the</strong> Board of Directors) Rules, 1988.FORM ACONSERVATION OF ENERGYThe Company has always been conscious of <strong>the</strong> need for and significance of conservation of energy and has been steadily making progress towards this end/objective and enjoying tangible results.1. Measures taken:The Company’s manufacturing process is not energy intensive in nature and hence it is committed to conserve energy by optimal usage of this scarce resource.Energy Conservation measures have been implemented at all factories and offices, like energy efficient blowers and pumps, backward curve blowers, LED & CFLlamps, 28 W lighting with electronic ballast for office area, Low height lighting for factories etc.2. Improvements:The Company has embarked upon a system of periodic and regular monitoring of <strong>the</strong> power aspect and maintenance of all equipment, <strong>the</strong>reby conserving energyto an advantageous level.3. Impact of (1) & (2): The outcome of <strong>the</strong>se changes has resulted in cost savings for <strong>the</strong> Company.4. Total Energy Consumption And Energy Consumption Per Unit Of Production:Year ended31.03.2011Year ended31.03.2010A. Power and fuel consumptiona) ElectricityPurchased Units 346536 -Total amount (` Lakhs) 21.68 -Rate Per Unit (`) 6.26 -b) Own Generation -Through Diesel GeneratorUnits 61012 -Units per litre 2.77 -Cost per unit (`) 13.68 -StandardUnitYear ended31.03.2011Year ended31.03.2010B. Consumption per unit of ProductionProduct – DG Sets Electricity (in ‘000) Nos. 1.06 -
Over<strong>view</strong> Performance Re<strong>view</strong>s Governance Financials107Annual Report 2010-11TECHNOLOGY ABSORPTIONNot Applicable.FORM BFOREIGN EXCHANGE EARNINGS AND OUTGO1. Efforts:The Company is exploring <strong>the</strong> possibility of achieving <strong>the</strong> fabrication orders, specific market access, and designs subcontracting from its principal, toenhance its foreign exchange earnings.2. Earnings and Outgo: ` in Lacsi) Foreign Exchange Earnings - export sales (FOB), Commission, Dividend, etc. 1,908ii) Foreign Exchange outgo (includes raw material, capital goods, components & spares, and o<strong>the</strong>r expenditure in foreign currency, includingdividends) :a) Raw Material Nilb) Machines (Trading items) 21,980c) Components & Spares 11,610d) Capital goods Nile) Travelling 47f) Technical Know-how Fees Nilg) Commission Nilh) Royalty Nili) Dividend NilFor and on behalf of Board of DirectorsPlace : KolkataDate : 17th May, 2011.S. MazumderChairman & Managing Director
108Auditors’ ReportTo <strong>the</strong> members of Tractors India Private Limited1. We have audited <strong>the</strong> attached Balance Sheet of Tractors India Private Limited (<strong>the</strong> ‘Company’) as at 31st March, 2011, and <strong>the</strong> related Profit and Loss Accountand <strong>the</strong> Cash Flow Statement for <strong>the</strong> year ended on that date annexed <strong>the</strong>reto, which we have signed under reference to this report. These financial statementsare <strong>the</strong> responsibility of <strong>the</strong> Company’s management. Our responsibility is to express an opinion on <strong>the</strong>se financial statements based on our audit.2. We conducted our audit in accordance with auditing standards generally accepted in India. Those Standards require that we plan and perform <strong>the</strong>audit to obtain reasonable assurance about whe<strong>the</strong>r <strong>the</strong> financial statements are free of material misstatement. An audit includes, examining on a testbasis, evidence supporting <strong>the</strong> amounts and disclosures in <strong>the</strong> financial statements. An audit also includes assessing <strong>the</strong> accounting principles usedand significant estimates made by management, as well as evaluating <strong>the</strong> overall financial statement presentation. We believe that our audit providesreasonable basis for our opinion.3. As required by <strong>the</strong> Companies (Auditor’s Report) Order, 2003, as amended by <strong>the</strong> Companies (Auditor’s Report) (Amendment) Order,2004 (toge<strong>the</strong>r <strong>the</strong>‘Order’), issued by <strong>the</strong> Central Government of India in terms of sub-section (4A) of Section 227 of ‘The Companies Act, 1956’ of India (<strong>the</strong> ‘Act’) and on <strong>the</strong>basis of such checks of <strong>the</strong> books and records of <strong>the</strong> Company as we considered appropriate and according to <strong>the</strong> information and explanations given tous, we give in <strong>the</strong> Annexure a statement on <strong>the</strong> matters specified in paragraphs 4 and 5 of <strong>the</strong> Order.4. Fur<strong>the</strong>r to our comments in <strong>the</strong> Annexere referred to in paragraph 3 above, we report that:a) We have obtained all <strong>the</strong> information and explanations, which to <strong>the</strong> best of our knowledge and belief, were necessary for <strong>the</strong> purposes of our audit;b) In our opinion, proper books of account as required by law have been kept by <strong>the</strong> Company so far as appears from our examination of those books;c) The Balance Sheet, <strong>the</strong> Profit and Loss Account and <strong>the</strong> Cash Flow Statement dealt with by this report are in agreement with <strong>the</strong> books of account;d) In our opinion, <strong>the</strong> Balance Sheet, <strong>the</strong> Profit and Loss Account and <strong>the</strong> Cash Flow Statement dealt with by this report comply with <strong>the</strong> applicableaccounting standards referred to in sub-section (3C) of Section 211 of <strong>the</strong> Act;e) On <strong>the</strong> basis of written representations received from <strong>the</strong> directors , as on 31st March, 2011, and taken on record by <strong>the</strong> Board of Directors, none of <strong>the</strong>directors is disqualified as on 31st March, 2011 from being appointed as a director in terms of clause (g) of sub – section (1) of Section 274 of <strong>the</strong> Act;f) In our opinion and to <strong>the</strong> best of our information and according to <strong>the</strong> explanations given to us, <strong>the</strong> said financial statements toge<strong>the</strong>r with <strong>the</strong> notes<strong>the</strong>reon and attached <strong>the</strong>reto give, in <strong>the</strong> prescribed manner, <strong>the</strong> information required by <strong>the</strong> Act, and give a true and fair <strong>view</strong> in conformity with<strong>the</strong> accounting principles generally accepted in India :i) in <strong>the</strong> case of <strong>the</strong> Balance Sheet, of <strong>the</strong> state of affairs of <strong>the</strong> Company as at 31st March, 2011;ii)iii)in <strong>the</strong> case of <strong>the</strong> Profit and Loss Account, of <strong>the</strong> profit for <strong>the</strong> year ended on that date; andin <strong>the</strong> case of Cash Flow Statement, of <strong>the</strong> cash flows for <strong>the</strong> year ended on that date.FOR PRICE WATERHOUSEFirm Registration Number - 301112EChartered AccountantsP. LawPlace : KolkataPartnerDate : 16th May, 2011 Membership Number – 51790
Over<strong>view</strong> Performance Re<strong>view</strong>s Governance Financials109Annual Report 2010-11Annexure to Auditors’ ReportReferred to in Paragraph 3 of <strong>the</strong> Auditors’ Report of Even Date to <strong>the</strong> Members of Tractors India Private Limited on <strong>the</strong> FinancialStatements for <strong>the</strong> year ended 31st March, 2011.1. (a) The Company has maintained proper records showing full particulars, including quantitative details and situation, of fixed assets.(b)(c)The fixed assets of <strong>the</strong> Company are physically verified by <strong>the</strong> management according to a phased programme designed to cover all <strong>the</strong> items overa period of three years which, in our opinion, is reasonable having regard to <strong>the</strong> size of <strong>the</strong> Company and <strong>the</strong> nature of its assets. Pursuant to <strong>the</strong>programme, a portion of <strong>the</strong> fixed assets has been physically verified by <strong>the</strong> management during <strong>the</strong> year and no material discrepancies between<strong>the</strong> book records and <strong>the</strong> physical inventory have been noticed.In our opinion, and according to <strong>the</strong> information and explanations given to us, a substantial part of fixed assets has not been disposed off by <strong>the</strong>Company during <strong>the</strong> year.2. (a) The inventory of <strong>the</strong> Company has been physically verified by <strong>the</strong> management during <strong>the</strong> year. In our opinion, <strong>the</strong> frequency of verification is reasonable.(b)(c)In our opinion, <strong>the</strong> procedures of physical verification of inventory followed by <strong>the</strong> management are reasonable and adequate in relation to <strong>the</strong> sizeof <strong>the</strong> Company and nature of its business.On <strong>the</strong> basis of our examination of <strong>the</strong> inventory records, in our opinion, <strong>the</strong> Company has maintained proper records of inventory. The discrepanciesnoticed on physical verification of inventory as compared to book records were not material.3. (a) The Company has not granted any loans, secured or unsecured, to companies, firms or o<strong>the</strong>r parties covered in <strong>the</strong> register maintainedunder Section 301 of <strong>the</strong> Act.(b)The Company has not taken any loans, secured or unsecured, from companies, firms or o<strong>the</strong>r parties covered in <strong>the</strong> register maintained under Section301 of <strong>the</strong> Act.4. In our opinion and according to <strong>the</strong> information and explanations given to us, <strong>the</strong>re is an adequate internal control system commensurate with <strong>the</strong> size of<strong>the</strong> Company and <strong>the</strong> nature of its business, for <strong>the</strong> purchase of inventory, fixed assets and for <strong>the</strong> sale of goods and services. Fur<strong>the</strong>r, on <strong>the</strong> basis of ourexamination of <strong>the</strong> books and records of <strong>the</strong> Company, and according to <strong>the</strong> information and explanations given to us, we have nei<strong>the</strong>r come across norhave been informed of any continuing failure to correct major weaknesses in <strong>the</strong> aforesaid internal control system.5. According to <strong>the</strong> information and explanations given to us, <strong>the</strong>re have been no contracts or arrangements referred to in Section 301 of <strong>the</strong> Act during <strong>the</strong> yearto be entered in <strong>the</strong> register required to be maintained under that Section. Accordingly, <strong>the</strong> question of commenting on transactions made in pursuance of suchcontractrs or arrangements does not arise.6. The Company has not accepted any deposits from <strong>the</strong> public within <strong>the</strong> meaning of Sections 58A and 58AA of <strong>the</strong> Act and <strong>the</strong> rules framed <strong>the</strong>reunder.7. As <strong>the</strong> Company is not listed on any stock exchange or <strong>the</strong> paid-up capital and reserves as at <strong>the</strong> commencement of <strong>the</strong> financial year does not exceedRupees Fifty Lacs or <strong>the</strong> average annual turnover for <strong>the</strong> period of three consecutive financial years immediately preceeding <strong>the</strong> financial year did notexceed Rupees Five Crores, clause (vii) of paragraph 4 of <strong>the</strong> Companies (Auditor’s Report) Order, 2003 is not applicable for <strong>the</strong> year.8. The Central Government of India has not prescribed <strong>the</strong> maintenance of cost records under clause (d) of sub-section (1) of Section 209 of <strong>the</strong> Act, for anyof <strong>the</strong> products of <strong>the</strong> Company.9 (a) According to <strong>the</strong> information and explanations given to us and records of <strong>the</strong> Company examined by us, in our opinion, <strong>the</strong> Company is regularin depositing during <strong>the</strong> year <strong>the</strong> undisputed statutory dues including Provident Fund, Investor Education and Protection Fund, Employees’ StateInsurance, Income Tax, Sales Tax, Wealth Tax, Service Tax, Customs Duty, Excise Duty, Cess and o<strong>the</strong>r material statutory dues, as applicable, with<strong>the</strong> appropriate authorities.(b)According to <strong>the</strong> information and explanations given to us and <strong>the</strong> records of <strong>the</strong> Company examined by us, <strong>the</strong> particulars of dues of Income Tax, Sales Tax,Wealth Tax, Service Tax, Customs Duty, Excise Duty and Cess as at 31st March, 2011 as applicable, which have not been deposited on account of a dispute,are as follows :
110Name of <strong>the</strong> Statute Nature of Dues Amount (` in lacs) Forum where dispute is pending[net of payments]The Central Sales Tax Act, 1956 Sales Tax dues for <strong>the</strong> year 2001-02 4.85 The High Court of Jharkhand at RanchiThe Delhi Sales Tax Act Sales Tax dues for <strong>the</strong> year 2002-03 4.91 The High Court of DelhiThe Central Excise Act, 1944 Excise valuation disputes for <strong>the</strong> year 2002-03 18.57 Customs, Excise and Service Tax AppellateTribunal, ChennaiFinance Act, 1994Finance Act, 1994Finance Act, 1994Service Tax dues for <strong>the</strong> period August2004 to July 2007Service Tax dues for <strong>the</strong> period October2006 to January 2008Service Tax dues for <strong>the</strong> periodJanuary 2004 to August 200794.98 Customs, Excise and Service Tax AppellateTribunal , New Delhi6.60 The Commisioner of Central Excise, Jaipur.861.03 Customs, Excise and Service Tax AppellateTribunal , KolkataFinance Act, 1994 Service Tax dues for <strong>the</strong> period 2004 to 2009 41.47 The Commisioner of Central Excise, Kolkata10. The Company has no accumulated losses as at 31st March, 2011, and it has not incurred any cash loss in <strong>the</strong> financial year ended on that date. TheCompany had incurred cash loss of ` 0.07 lacs in <strong>the</strong> immediately preceding financial year.11. According to <strong>the</strong> records of <strong>the</strong> Company examined by us and <strong>the</strong> information and explanations given to us, <strong>the</strong> Company has not defaulted in repaymentof dues to any financial institution or bank or debenture holders as at <strong>the</strong> Balance Sheet date.12. The Company has not granted any loans and advances on <strong>the</strong> basis of security by way of pledge of shares, debentures and o<strong>the</strong>r securities.13. Provisions of any special statute applicable to chit fund/ nidhi/ mutual benefit fund/ societies are not applicable to <strong>the</strong> Company.14. In our opinion, <strong>the</strong> Company is not a dealer or trader in shares, securities, debentures and o<strong>the</strong>r investments.15. In our opinion, and according to <strong>the</strong> information and explanations given to us, <strong>the</strong> Company has not given any guarantee for loans taken by o<strong>the</strong>rs frombanks or financial institutions during <strong>the</strong> year.16. In our opinion, and according to <strong>the</strong> information and explanations given to us on an overall basis, <strong>the</strong> term loans have been applied for <strong>the</strong> purposes forwhich <strong>the</strong>y were obtained.17. On <strong>the</strong> basis of an overall examination of <strong>the</strong> Balance Sheet of <strong>the</strong> Company, in our opinion and according to <strong>the</strong> information and explanations given to us,<strong>the</strong>re are no funds raised on short term basis which have been used for long term investment.
Over<strong>view</strong> Performance Re<strong>view</strong>s Governance Financials111Annual Report 2010-1118. The Company has not made any preferential allotment of shares to parties and companies covered in <strong>the</strong> register maintained under Section 301 of <strong>the</strong> Actduring <strong>the</strong> year.19. The Company had nei<strong>the</strong>r any outstanding debenture at <strong>the</strong> beginning of <strong>the</strong> year nor has it issued any debenture during <strong>the</strong> year and accordingly, <strong>the</strong>question of creation of security or charges in this respect does not arise.20. The Company has not raised any money by public issue during <strong>the</strong> year.21. During <strong>the</strong> course of our examination of <strong>the</strong> books and records of <strong>the</strong> Company, carried out in accordance with <strong>the</strong> generally accepted auditing practicesin India, and according to <strong>the</strong> information and explanations given to us, we have nei<strong>the</strong>r come across any instance of fraud on or by <strong>the</strong> Company, noticedor reported during <strong>the</strong> year, nor have we been informed of such case by <strong>the</strong> management.22. The o<strong>the</strong>r clauses, (iii)(b), (iii)(c), (iii)(d), (iii)(f), (iii)(g) and (v)(b) of paragraph 4 of <strong>the</strong> Companies (Auditor’s Report) Order 2003 as amended by <strong>the</strong>Companies (Auditor’s Report) (Amendment) Order, 2004, are not applicable in <strong>the</strong> case of <strong>the</strong> Company for <strong>the</strong> year, since in our opinion <strong>the</strong>re is no matterwhich arises to be reported in <strong>the</strong> aforesaid order.FOR PRICE WATERHOUSEFirm Registration Number - 301112EChartered AccountantsP. LawPlace : KolkataPartnerDate : 16th May, 2011 Membership Number – 51790
112Balance Sheet as at 31st March, 2011(` in ‘000)Schedule As at 31.03.2011 As at 31.03.2010SOURCES OF FUNDS1. Shareholders’ Funds(a) Capital A 45,000 106(b) Reserves and Surplus B 1,104,021 -1,149,021 1062. Loan Funds C(a) Secured Loans 1,343,978 -(b) Unsecured Loans 560,480 -1,904,458 -3. Deferred Tax Liability (Note 14 on schedule ‘N’) 42,656 -Total 3,096,135 106APPLICATIONS OF FUNDS1. Fixed Assets E(a) Gross Block 1,235,987 -(b) Less : Depreciation 411,678 -(c) Net Block 824,309 -(d) Capital Work-in-Progress 7,850 -832,159 -2. Current Assets, Loans and Advances(a) Inventories F 2,335,072 -(b) Sundry Debtors G 1,329,865 -(c) Cash and Bank Balances H 625 11(d) O<strong>the</strong>r Current Assets I 101,829 -(e) Loans and Advances J 125,594 483,892,985 59Less : Current Liabilities and ProvisionsD(a) Liabilities 1,506,625 4(b) Provisions 122,384 -1,629,009 4Net Current Assets 2,263,976 553. Profit and Loss Account - 51Total 3,096,135 106NotesNThe Schedules referred to above form an integral part of <strong>the</strong> Balance Sheet.This is <strong>the</strong> Balance Sheet referred to in our report of even date.For and on behalf of Board of DirectorsFor PRICE WATERHOUSEFirm Registration No. 301112EChartered AccountantsG.V.R. MurthyP. Law Joint Managing DirectorPartnerMembership No.51790Kolkata16th May, 2011.Sumit MazumderChairman & Managing DirectorAloke BanerjeeDirector Finance
Over<strong>view</strong> Performance Re<strong>view</strong>s Governance Financials113Annual Report 2010-11Profit & Loss Account for <strong>the</strong> year ended 31st March, 2011(` in ‘000)Schedule Year Ended 31.03.2011 Year Ended 31.03.2010INCOMESales and Services (Gross) 8,696,715 -Less : Excise Duty 61,388 -Sales and Services (Net) 8,635,327 -Selling Commission Earned 198,420 -Rental from Machinery 186,398 -O<strong>the</strong>r Income K 29,419 -9,049,564 -EXPENDITURECost of Materials and Direct Manufacturing Expenses L 7,249,607 -Expenses M 1,143,557 158,393,164 15Interest on :Fixed Loans 14,862 -O<strong>the</strong>rs 162,171 -177,033 -Depreciation and Amortisation 141,390 -Profit/(Loss) Before Taxation 337,977 (15)Less : Provision for Taxation :Current Tax 104,750 -Deferred Tax Charge 42,656 -147,406 -Profit/(Loss) After Taxation 190,571 (15)Add : Balance of Profit and Loss Accountbrought forward from previous year (51) (36)Balance Carried Forward 190,520 (51)Earnings/(Loss) Per Share - (Note 4 on Schedule ‘N’)Basic (`) 42.35 (1.42)Diluted (`) 42.35 (1.42)NotesNThe Schedules referred to above form an integral part of <strong>the</strong> Profit and Loss Account.This is <strong>the</strong> Profit and Loss Account referred to in our report of even date.For and on behalf of Board of DirectorsFor PRICE WATERHOUSEFirm Registration No. 301112EChartered AccountantsG.V.R. MurthyP. Law Joint Managing DirectorPartnerMembership No.51790Kolkata16th May, 2011.Sumit MazumderChairman & Managing DirectorAloke BanerjeeDirector Finance
114Schedule forming part of <strong>the</strong> Balance Sheet(` in ‘000 )As at 31.03.2011 As at 31.03.2010SCHEDULE ‘A’Share CapitalAuthorised7,000,000 Equity Shares of ` 10/- each 70,000 70,00070,000 70,000Issued, Subscribed and Paid up4,500,000 (Previous year 10,570) Equity Shares of ` 10/- each fully paid up ( Notes 1 & 2 below) 45,000 106Total 45,000 106Notes :1. Above Shares are held by TIL Limited, <strong>the</strong> Holding Company.2. Of <strong>the</strong> above Shares, 44,89,430 equity shares of ` 10 each at a premium of ` 203.48 per Share were allotted as fully paid up pursuant to a Scheme ofArrangement during <strong>the</strong> year without payment being received in Cash ( Note 3 on Schedule ‘N’)(` in ‘000 )As at 31.03.2010 Additions Deductions As at 31.03.2011SCHEDULE ‘B’Reserves and SurplusSecurities Premium Account - 913,501 - 913,501(Note 3 on Schedule ‘N’)- 913,501 - 913,501Profit and Loss Account (51) 190,571 - 190,520Total (51) 1,104,072 - 1,104,021(` in ‘000)As at 31.03.2011 As at 31.03.2010SCHEDULE ‘C’Loan Funds(a) Secured LoansCash Credit/ Working Capital Demand LoansFrom Banks 1,167,628 -[Cash Credit/Working Capital facilities from Consortium Bankers are secured by firstpari-passu charge by way of hypo<strong>the</strong>cation on all <strong>the</strong> Current Assets of <strong>the</strong> Company(namely Stocks, Bills Receivables and Book Debts etc.) both present and future, excludingsuch movables as may be permissible by <strong>the</strong> said bankers from time to time and a secondpari passu charge on Fixed Assets of <strong>the</strong> Company both movable and immovable, presentand future, ranking after <strong>the</strong> mortgage and/or charge created and/or to be created by <strong>the</strong>Company over such Fixed Assets in favour of its term lenders/ prior charge holders forsecuring <strong>the</strong>ir respective Term Loan/Credit facilities and also secured by a second paripassucharge on all moveable and certain immoveable properties of <strong>the</strong> Company’s holdingcompany-TIL Limited. Fur<strong>the</strong>r for <strong>the</strong>se facilities a Corporate Guarantee has been provided to<strong>the</strong> Consortium Bankers by TIL Limited]Interest accrued and due 6,381 -
Over<strong>view</strong> Performance Re<strong>view</strong>s Governance Financials115Annual Report 2010-11Schedule forming part of <strong>the</strong> Balance SheetSCHEDULE ‘C’ (Contd.)(b)(` in ‘000)As at 31.03.2011 As at 31.03.2010Term LoansFrom BanksIn Indian Rupee (Repayable within one year ` 54,000 thousand) 160,298 -Interest accrued and due on term loans 1,674 -[Term Loans are secured by first pari-passu charge on <strong>the</strong> movable fixed assets of <strong>the</strong>Company and its holding Company-TIL Limited, both present and future and by way ofmortgage of certain immovable properties of TIL Limited and second pari-passu charge on<strong>the</strong> current assets of <strong>the</strong> Company, both present and future. Fur<strong>the</strong>r for <strong>the</strong>se facilities aCorporate Guarantee has been provided to <strong>the</strong> Consortium Bankers by TIL Limited]Vehicle LoansFrom Banks 7,997 -(Repayable within one year ` 3,701 thousand)[Vehicle loans are secured by hypo<strong>the</strong>cation of <strong>the</strong> vehicles financed.]Total 1,343,978 -Unsecured LoansFrom Banks (Short Term) In Foreign Currency 560,480 -Total 560,480 -(` in ‘000)As at 31.03.2011 As at 31.03.2010SCHEDULE ‘D’Current Liabilities And ProvisionsCurrent Liabilities :Acceptances 58,803 -Sundry Creditors (Note 9 on Schedule ‘N’) 1,162,963 -Advance from Customers and o<strong>the</strong>rs 149,804 -Security Deposit from Customers 19,208 -O<strong>the</strong>r Liabilities 110,181 4Interest accrued but not due on Loans 5,666 -1,506,625 4Provisions for :Accrued Leave Encashment Benefit for Employees 17,634 -Provision for Taxation 104,750 -122,384 -Total 1,629,009 4
116Schedule forming part of <strong>the</strong> Balance SheetSCHEDULE ‘E’Fixed Assets Gross Block Depreciation Net BlockCost as at31.03.2010Acquired videScheme ofArrangement(Note 3 onSchedule ‘N’)Additions/Adjustmentduring <strong>the</strong>yearSales/Adjustmentduring <strong>the</strong>yearCost as at31.03.2011As at31.03.2010Acquired videScheme ofArrangement(Note 3 onSchedule ‘N’)For <strong>the</strong>yearOn Sales/Adjustmentduring<strong>the</strong> yearAs at31.03.2011As at31.03.2011Tangible AssetsLeasehold Land - 2,503 - - 2,503 - 356 38 - 394 2,109 -Buildings :Leasehold - 76,163 17,111 - 93,274 - 2,835 2,415 - 5,250 88,024 -Plant and Machinery(Note 8.2 on Schedule ‘N’)- 891,946 283,198 122,457 1,052,687 - 317,155 132,211 65,384 383,982 668,705 -Furniture and Equipment - 36,103 14,310 - 50,413 - 8,590 3,833 - 12,423 37,990 -Motor Vehicles and- 22,585 15,035 510 37,110 - 7,012 2,893 276 9,629 27,481 -Motor Cycle(` in ‘000)As at31.03.2010Total - 1,029,300 329,654 122,967 1,235,987 - 335,948 141,390 65,660 411,678 824,309 -Capital Work-in-31,025 7,850 -ProgressGrand Total - 1,060,325 329,654 122,967 1,235,987 - 335,948 141,390 65,660 411,678 832,159 -Previous year - - - - - - - - - -
Over<strong>view</strong> Performance Re<strong>view</strong>s Governance Financials117Annual Report 2010-11Schedule forming part of <strong>the</strong> Balance Sheet(` in ‘000)As at 31.03.2011 As at 31.03.2010SCHEDULE ‘F’Inventories (Note 2.4 on Schedule ‘N’)Loose Tools 8,932 -Raw Materials 164,735 -Stock-in-Trade 2,102,074 -Work-in-Progress 59,331 -Total 2,335,072 -(` in ‘000)As at 31.03.2011 As at 31.03.2010SCHEDULE ‘G’Sundry Debtors (Unsecured -Considered Good)Debts outstanding for more than six months 94,531 -O<strong>the</strong>r Debts 1,235,334 -Total 1,329,865 -(` in ‘000)As at 31.03.2011 As at 31.03.2010SCHEDULE ‘H’Cash and Bank BalancesCash in hand 207 -Balance with Scheduled Banks - On Current Accounts 418 11Total 625 11(` in ‘000)As at 31.03.2011 As at 31.03.2010SCHEDULE ‘I’O<strong>the</strong>r Current Assets (Unsecured-Considered Good)Claims Receivable 64,299 -Balance with Excise and Customs Authorities 18,247 -Accrued duty benefits pertaining to Exports/ Deemed Exports 1,791 -Deposits 17,492 -Total 101,829 -(` in ‘000)As at 31.03.2011 As at 31.03.2010SCHEDULE ‘J’Loans and Advances (Unsecured-Considered Good)Advances recoverable in cash or in kind or for value to be received 15,609 48Advance Income Tax (Including Tax deducted at source) 109,985 -Total 125,594 48
118Schedule forming Part of <strong>the</strong> Profit and Loss Account(` in ‘000)Year Ended 31.03.2011 Year Ended 31.03.2010SCHEDULE ‘K’O<strong>the</strong>r IncomeSale of Scraps 1,393 -Profit on Sale of Fixed Assets (Net) 16,876 -Discounts 694 -Liability no longer required Written Back 3,730 -Miscellaneous Income 6,726 -Total 29,419 -(` in ‘000)Year Ended 31.03.2011 Year Ended 31.03.2010SCHEDULE ‘L’Cost Of Materials And Direct Manufacturing ExpensesOpening StockRaw Materials - -Stock in Trade - -- -Acquired vide Scheme of Arrangement (Note 3 on Schedule ‘N’)Raw Materials 14,016 -Stock in Trade 977,884 -991,900 -Add : Purchases (Note 12 on Schedule ‘N’) 8,542,087 -9,533,987 -Less : Closing StockRaw Materials 164,734 -Stock in Trade 2,102,074 -2,266,808 -7,267,179 -Add : Opening Work-in-Progress - -Acquired vide Scheme of Arrangement (Note 3 on Schedule ‘N’) 43,888 -7,311,067 -Less : Closing Work-in-Progress 59,331 -7,251,736 -Less : Capitalised 16,881 -7,234,855 -Carriage Inward 14,752 -Total 7,249,607 -
Over<strong>view</strong> Performance Re<strong>view</strong>s Governance Financials119Annual Report 2010-11Schedule forming Part of <strong>the</strong> Profit and Loss Account(` in ‘000)Year Ended 31.03.2011 Year Ended 31.03.2010SCHEDULE ‘M’ExpensesSalaries , Wages , Bonus etc. * 548,956 -Contribution to Provident and o<strong>the</strong>r Funds * 68,236 -Staff Welfare Expenses * 16,735 -Rent 20,504 -Rates and Taxes 15,513 -Bank Charges 22,030 1Insurance 13,665 -Repairs and Maintenance :Buildings 11,221 -Plant and Machinery 23,687 -O<strong>the</strong>r 4,247 -39,155 -Travelling Expenses 145,161 -Stationery and Printing 6,810 -Postage, Telephone and o<strong>the</strong>r Communication Expenses 17,079 -Advertising 4,066 -Gas and Electricity 9,024 -Commission 11,059 -Miscellaneous Expenses (Note 13.1 on Schedule ‘N’)* 80,973 9Forwarding Charges 40,417 -Medical Expenses * 9,989 -Professional Fees (Note 13.2 on Schedule ‘N’) 12,915 5Motor Car and Van Expenses 9,451 -Service Support Expenses 42,676 -Debts/Advances/Claims written off 9,143 -Total 1,143,557 15* Includes reimbursements [also refer Note 18(B)(l)(b) on Schedule ‘N’)]
120Schedule forming part of <strong>the</strong> Accounts for <strong>the</strong> year ended 31st March, 2011SCHEDULE ‘N’Notes1. The Financial Statements are prepared to comply in all material aspects with all <strong>the</strong> applicable accounting principles in India, <strong>the</strong> applicable AccountingStandards notified under section 211(3C) of <strong>the</strong> Companies Act, 1956 and <strong>the</strong> relevant provisions of <strong>the</strong> Companies Act, 1956.2. Significant Accounting Policies2.1 SalesRevenue from sales/services (exclusive of Sales Tax/ Value Added Tax) is being recognised on accrual basis in keeping with related arrangementswith customers and is net of credit notes on account of returns and allowances.2.2 Fixed AssetsFixed Assets are stated at <strong>the</strong>ir original cost/cost of acquisition ( Note 3 below ) less depreciation. Impairment loss, if any, is recognised wherever <strong>the</strong>carrying amount of fixed assets of a cash generating unit exceeds its recoverable amount i.e. net selling price or value in use, whichever is higher.2.3 DepreciationDepreciation (including amortisation) is calculated in <strong>the</strong> following manner :(a)(b)Leasehold land is amortised over <strong>the</strong> period of lease.In respect of o<strong>the</strong>r assets, at rates prescribed in Schedule XIV to <strong>the</strong> Companies Act, 1956 on ‘Straight Line Method’ except Plant andMachinery given under operating leases which are depreciated over a period of 3 to 6 years, being <strong>the</strong> useful life as estimated by <strong>the</strong>management.2.4 InventoriesInventories, o<strong>the</strong>r than Loose Tools are valued at lower of weighted average cost/actual cost( inclusive of conversion expenses and applicableoverheads for manufacturing activities) and net realizable value. Loose tools are charged off on purchase except for certain Loose Tools (originallyacquired prior to 1st September 2008 and subsequently transferred to <strong>the</strong> Company pursuant to <strong>the</strong> Scheme of Arrangement effective 1st April,2010), which are written off over a period up to 5 years from <strong>the</strong> date of purchase, after retaining 10% of <strong>the</strong> residual value.2.5 TaxationCurrent Tax in respect of taxable income is provided for <strong>the</strong> year based on applicable tax rates and laws. Deferred Tax is recognised subject to <strong>the</strong>consideration of prudence in respect of deferred tax assets, on timing differences, being <strong>the</strong> difference between taxable income and accounting incomethat originate in one period and are capable of reversal in one or more subsequent periods and is measured using tax rates and laws that have beenenacted or substantively enacted by <strong>the</strong> Balance Sheet date. Deferred tax assets are re<strong>view</strong>ed at each Balance Sheet date to re-assess realisation.2.6 Employee Benefits2.6.1 Short-term Employee benefits (i.e. benefits payable within one year) are recognised in <strong>the</strong> period in which <strong>the</strong> employee services are rendered.2.6.2 Contributions towards provident funds are recognised as expense. Provident fund contributions in respect of employees are made to common trust- ‘Tractors India Employees Provident Fund’ (being administered by <strong>the</strong> trustees of <strong>the</strong> said fund for <strong>the</strong> benefit of employees of <strong>the</strong> Company andits Holding Company i.e. TIL Limited) and such Trust invest funds following a pattern of investments prescribed by <strong>the</strong> Government. The interest ratepayable to <strong>the</strong> members of <strong>the</strong> Trust is not lower than <strong>the</strong> rate of interest declared annually by <strong>the</strong> Central Government under <strong>the</strong> Employees’Provident Funds and Miscellaneous Provisions Act,1952 and shortfall, if any, on account of interest is made good by <strong>the</strong> Company. ( Also refer note15.2 below ) Contributions under Employees’ Pension Scheme is made as per statutory requirements and charged as expenses for <strong>the</strong> year.2.6.3 The Company also contributes to <strong>the</strong> Central Government administered Employees’ State Insurance Scheme for its eligible employees, which is adefined contribution plan.2.6.4 Provisions for Gratuity for eligible employees is (being a defined benefit plan) made on <strong>the</strong> basis of year-end actuarial valuation using projected unitcredit method.2.6.5 In respect of certain eligible employees transferred from Parent Company (TIL Ltd) who have attained 45 years of age as on 1st April 2009, provision forSuperannuation under defined benefit plan is made on <strong>the</strong> basis of year end actuarial valuation ( Note 15.3 below) using projected unit credit method.
Over<strong>view</strong> Performance Re<strong>view</strong>s Governance Financials121Annual Report 2010-11Schedule forming part of <strong>the</strong> Accounts for <strong>the</strong> year ended 31st March, 2011SCHEDULE ‘N’ (Condt.)In respect of certain eligible employees who have not attained 45 years of age as on 1st April 2009 provision for Superannuation is made :-under defined contribution scheme in respect of services rendered with effect from 1st April 2009.under defined benefit scheme in respect of services rendered up to 31st March 2009, based on frozen pensionable salary ason 31st March 2009 (Note 15.3 below) using projected unit credit method.2.6.6 Actuarial gains/ losses arising in Defined Benefit Plans are recognised in <strong>the</strong> Profit and Loss Account as income or expenses in <strong>the</strong> year in which<strong>the</strong>y occur.2.6.7 Accrued liability towards Leave Encashment benefits, covering eligible employees, evaluated on <strong>the</strong> basis of year-end actuarial valuation usingprojected unit credit method, is recognised as a charge.2.7 Foreign Currency TransactionsMonetary assets and liabilities related to foreign currency transactions remaining unsettled at <strong>the</strong> year end are translated at year end rates or atcontract rates, covered by forward exchange contracts. The difference in transactions of monetary assets and liabilities and realised gains and losseson foreign exchange transactions are recognised in <strong>the</strong> Profit and Loss Account. In respect of transactions covered by forward exchange contracts,<strong>the</strong> difference between <strong>the</strong> contract rate and <strong>the</strong> spot rate on <strong>the</strong> date of transaction is charged to <strong>the</strong> Profit and Loss Account over <strong>the</strong> period of <strong>the</strong>contract. Profit/(Loss) on cancellation of forward contracts are recognised as income or as expenses for <strong>the</strong> year. Foreign currency non monetaryitems carried in terms of historical cost are reported using <strong>the</strong> exchange rate at <strong>the</strong> date of transactions.2.8 Borrowing CostBorrowing Cost, if any, that are attributable to <strong>the</strong> acquisition, construction or production of ‘Qualifying Assets’ are capitalised as part of cost ofsuch assets. A ‘Qualifying Asset’ is an asset that necessarily requires a substantial period of time to get ready for its intended use or sale. All o<strong>the</strong>rborrowing costs are recognised as expenses in <strong>the</strong> period in which <strong>the</strong>y are incurred.2.9 LeasesFor assets acquired under Operating Lease, rentals payable are charged to Profit and Loss Account. Assets acquired under Finance Lease arecapitalised at lower of <strong>the</strong> Fair Value and Present Value of Minimum Lease Payments. Assets leased out under operating leases are capitalised. Rentalincome is recognised on accrual basis over <strong>the</strong> lease term.3. Pursuant to <strong>the</strong> Scheme of Arrangement (<strong>the</strong> ‘Scheme’) under Section 391 to 394 of <strong>the</strong> Companies Act, between <strong>the</strong> Company i.e. TIPL (<strong>the</strong> TransfereeCompany) and its Holding Company-TIL Limited (<strong>the</strong> Transferor Company) as sanctioned by <strong>the</strong> Hon’ble High Court at Calcutta vide order dated 12thJuly,2010, <strong>the</strong> undertaking of <strong>the</strong> Holding Company pertaining to dealership business of Caterpillar (comprising Construction and Mining Solutions andPower Systems Solutions) has been transferred to and vested in TIPL on a going concern basis with effect from <strong>the</strong> appointed date of 1st April,2010,on a slump sale basis, in consideration of 4,489,430 number of Equity Shares of TIPL at ` 10/- each at a premium of ` 203.48 per share fully paid up,aggregating ` 958,396 thousand, issued to TIL Limited.The said Scheme has been given effect to in <strong>the</strong>se accounts in accordance with <strong>the</strong> said High Court order.In pursuance of <strong>the</strong> Scheme <strong>the</strong> following assets and liabilities were acquired by <strong>the</strong> Company with effect from 1st April, 2010 at <strong>the</strong>ir respective book values:-(` in ‘000)Net Fixed Assets 724,377Current Assets, Loans and Advances 2,319,691Total Assets 3,044,068Less: Current Liabilities, Provisions andBorrowings 2,085,672Net Assets 958,396
122Schedule forming part of <strong>the</strong> Accounts for <strong>the</strong> year ended 31st March, 2011SCHEDULE ‘N’ (Condt.)4. Earnings/(Loss) Per Share (EPS) - The numerators and denominators used to calculate Basic and Diluted EPS:Year Ended 31.03.2011 Year Ended 31.03.2010Profit/(Loss) after Tax attributable to <strong>the</strong> Equity Shareholders (` in ‘000) A 190,571 (15)Basic and Diluted :i. Number of Equity Shares at <strong>the</strong> beginning of <strong>the</strong> year 10,570 10,570ii. Number of Equity Shares issued during <strong>the</strong> year 4,489,430 -iii. Number of Equity Shares at <strong>the</strong> end of <strong>the</strong> year 4,500,000 10,570iv. Weighted average number of Equity Sharesoutstanding during <strong>the</strong> year B 4,500,000 10,570v. Nominal Value of each Equity Share (`) 10/- 10/-Basic and Diluted Earnings/(Loss) Per Share (`) A/B 42.35 (1.42)(` in ‘000)As at 31.03.2011 As at 31.03.20105. Contingent Liabilities in respect of -5.1 Sales Tax Matters under dispute 976 -[Net of payments ` 500 thousand (Previous year - Nil)]5.2 Service Tax matters under dispute [Net of payments ` 20,208 thousand (Previous year - Nil)] 100,408 -5.3 Excise Duty matters under dispute [Net of payments ` 1,000 thousand (Previous year - Nil)] 1,857 -6. Bank Guarantees outstanding 186,466 -7. Capital Commitment [Net of advance ` 331 thousand(Previous year - Nil)] 1,651 -8.1 Pursuant to <strong>the</strong> Scheme of Arrangement (Note 3 above), <strong>the</strong> Company has taken over from TIL Limited various residential/ commercial premises which areunder cancellable operating lease. Leases range for periods between 3 to 5 years. Terms of <strong>the</strong> lease include operating term for renewal, increase in rentfor future periods, terms of cancellation etc. The operating lease payments for <strong>the</strong> year amount to ` 20,504 thousand (Previous Year - Nil)8.2 Pursuant to <strong>the</strong> Scheme of Arrangement (Note 3 above), <strong>the</strong> Company has taken over from TIL Limited various Plant and Machinery (namely DieselGenerating Sets, Machines etc.) which are rented to customers under cancellable operating leases. Leases range for periods between 6 months to 3 years.Terms of lease include terms for renewal, cancellation etc. Initial Direct costs (commissioning, installation etc.) for such assets are borne by <strong>the</strong> lessee,o<strong>the</strong>r than transportation cost, which is borne by <strong>the</strong> Company and charged off to revenue. Lease rentals recognised as income during <strong>the</strong> year ` 186,398thousand (Previous Year Nil). O<strong>the</strong>r details for such Plant and Machinery are as below.(` in ‘000)Gross Block Accumulated Depreciation DepreciationAs at 31.03.2011 As at 31.03.2010 As at 31.03.2011 As at 31.03.2010 Year Ended 31.03.2011 Year Ended 31.03.2010660,925 Nil 213,043 Nil 83,283 Nil
Over<strong>view</strong> Performance Re<strong>view</strong>s Governance Financials123Annual Report 2010-11Schedule forming part of <strong>the</strong> Accounts for <strong>the</strong> year ended 31st March, 2011SCHEDULE ‘N’ (Condt.)9. There are no outstanding dues for Micro and Small Enterprises based on information available with <strong>the</strong> Company.10. During <strong>the</strong> year Company’s long term composite maintenance contract with a customer, which entailed, inter-alia, supply of parts, was completed. Theliability accumulated in respect earlier years amounting to ` 145,394 thousand [arising from payments received in advance as per <strong>the</strong> billing/paymentschedule, which was time phased] has been appropriately adjusted, as in earlier years, against supply of parts in <strong>the</strong> current year.11. Sales-o<strong>the</strong>rs [Note 16.2 (e) below ]represent, Service Income ` 227,478 thousand (Previous year - Nil).(` in ‘000)Year Ended 31.03.2011 Year Ended 31.03.201012. Purchases includes :a) Marine Insurance Charges 2,322 -b) Raw materials purchased 735,787 -Excludes :Items being recoverable by way of reimbursement i.e. o<strong>the</strong>r than through Sales 109,293 -(` in ‘000)Year Ended 31.03.2011 Year Ended 31.03.201013.1. Miscellaneous expenses include, charge/(credit) on account of :a) Discounting Charges 1,320 -b) Loss/(Gain) on Foreign Exchange (net) (14,946) -13.2. Professional fees include :Amount paid /payable to AuditorsAs Auditors*- Audit Fees 1,175 2- Tax Audit Fees 200 -- O<strong>the</strong>rs (Certificates, etc.) 450 -* Excluding Service Tax ` 188 thousand (Previous Year ` 0.21 thousand)14. Year-end Deferred Tax balance comprises <strong>the</strong> following :(` in ‘000)As at 31.03.2011 As at 31.03.2010Timing Difference resulting in liabilities /(assets) mainly on account of :Difference between net book value of depreciable Capital Asset as per books vis-à-vis42,656 -written down value as per Income Tax.Deferred Tax Liability 42,656 -15. Employee Benefits15.1 (a) In accordance with <strong>the</strong> Scheme of Arrangement (Note 3 above) employees of TIL Limited (hereinafter referred to as transferred employees) whowere engaged in <strong>the</strong> transferred undertaking are employed by <strong>the</strong> Company (TIPL) on and from 1st April 2010. All liabilities as on 1st April, 2010and arising <strong>the</strong>reafter relating to <strong>the</strong> transferred employees shall be borne and paid by TIPL. Fur<strong>the</strong>r for <strong>the</strong> purpose of payment of any retirementbenefits, past service of such transferred employees in TIL Limited shall be taken into account and <strong>the</strong> methodology for computation of retirementbenefits shall remain same as that followed by TIL Limited.
124Schedule forming part of <strong>the</strong> Accounts for <strong>the</strong> year ended 31st March, 2011SCHEDULE ‘N’ (Condt.)15.1 (b) The Company has recognised, in <strong>the</strong> Profit and Loss Account for <strong>the</strong> year ended 31st March, 2011 an amount of ` 11,897 thousand (Previous year- Nil) as expenses under defined contribution plans as detailed below:(` in ‘000)For <strong>the</strong> year 2010-11 For <strong>the</strong> year 2009-10Benefit (Contribution to)Employees Pension Scheme 4,945 -Employees State Insurance 1,424 -Superannuation Fund 5,528 -Total 11,897 -15.2 Provident Fund :-In terms of <strong>the</strong> Guidance on implementing Accounting Standard(AS) 15 on Employee Benefits issued by <strong>the</strong> Accounting Standards Board of <strong>the</strong> Institute ofChartered Accountants of India, a provident fund set up by <strong>the</strong> Company is treated as a defined benefit plan since <strong>the</strong> Company is obligated to meet interestshortfall, if any. However, at <strong>the</strong> year end, no shortfall remains unprovided for. The Actuary has expressed his inability to provide an actuarial valuation of <strong>the</strong>provident fund liability as at <strong>the</strong> year end in <strong>the</strong> absence of any guidance from <strong>the</strong> Actuarial Society of India. Accordingly, complete information required tobe considered as per AS 15 in this regard are not available and <strong>the</strong> same could not be disclosed. During <strong>the</strong> year, <strong>the</strong> Company has contributed ` 13,623thousand (Previous year - Nil) to <strong>the</strong> Provident Funds.15.3 A) Superannuation Fund :-i. Certain eligible employees of <strong>the</strong> Company who had attained at least 45 years of age as on 1st April,2009 are entitled to superannuation benefitunder <strong>the</strong> Superannuation Scheme (a funded Defined Benefit Plan under a common Trust- ‘Tractors India Limited Superannuation Fund Scheme’,being administered by <strong>the</strong> trustees of <strong>the</strong> said fund for <strong>the</strong> benefit of employees of <strong>the</strong> Company and its Holding Company i.e. TIL Limited). Under <strong>the</strong>aforesaid benefit scheme <strong>the</strong> Company makes periodic contribution to <strong>the</strong> Superannuation Fund Scheme and a predetermined percentage of salaryis paid as pension on retirement. The quantum of pension depends on <strong>the</strong> average basic salary of eligible employee during <strong>the</strong> last 36 months beforeretirement. The benefit vests to employees with 12 years of continuous service and attainment of 48 years of age on retirement/death/termination.The most recent actuarial valuation of Plan Assets and Present Value of <strong>the</strong> Defined Benefit Obligation of Superannuation Fund was carried out ason 31st March,2011.ii.Employees who did not attain 45 years of age as on 1st April,2009 are under <strong>the</strong> pur<strong>view</strong> of ‘Defined Contribution Scheme’ in respect of servicerendered from 1st April,2009. The benefit of services rendered by <strong>the</strong>se employees up to 31st March,2009 come under <strong>the</strong> pur<strong>view</strong> of ‘DefinedBenefit Scheme’ as indicated in Note 15.3(i) above, which is frozen as on 31st March,2009. Thus for this category of employees, <strong>the</strong> benefit ofcessation of service will be : a) amount accumulated by annual contribution of 15% of Basic Salary and b) amount frozen as on 31st March,2009.B) Gratuity Fund :-The Company makes periodic contributions to <strong>the</strong> Tractors India Limited Staff Gratuity Fund, a funded defined benefit-plan for qualifying employeesadministered under a common Trust, by <strong>the</strong> trustees of <strong>the</strong> said fund for <strong>the</strong> benefit of employees of <strong>the</strong> Company and its Holding Company i.e. TIL Limited.Under <strong>the</strong> Gratuity plan, every employee is entitled to gratuity, being higher of <strong>the</strong> amount, calculated under <strong>the</strong> Company’s plan (based on averagesalary of last 36 months and number of years of service, restricted to a maximum of 40 years) or calculations as laid down under <strong>the</strong> Payment ofGratuity Act, 1972. Gratuity is payable on death/ retirement/ termination and <strong>the</strong> benefit vests after 5 years of continuous service.The most recent actuarial valuation of plan assets and <strong>the</strong> present value of <strong>the</strong> defined benefit obligation was carried out as at 31st March, 2011.
Over<strong>view</strong> Performance Re<strong>view</strong>s Governance Financials125Annual Report 2010-11Schedule forming part of <strong>the</strong> Accounts for <strong>the</strong> year ended 31st March, 2011SCHEDULE ‘N’ (Condt.)15.4 Particulars in respect of post retirement defined benefit plans of <strong>the</strong> Company are as follows :-(` in ‘000)Superannuation Fund (Funded) Gratuity Fund (Funded)2010-11 2009-10 @ 2010-11 2009-10 @1. Reconciliation of <strong>the</strong> Opening and Closing balances of <strong>the</strong>Present Value of Obligation :a. Present Value of Obligation at <strong>the</strong> Beginning of <strong>the</strong> Year - -b. Present Value of Obligation transferred from Holding73,957 20,451Company ( Note 3 Above )c. Current Service Cost 3,257 2,633d. Interest Cost 5,946 1,593e. Actuarial (gain)/loss 5,115 7,883f. Benefits paid (4,636) (2,506)g. Present Value of Obligation at <strong>the</strong> end of <strong>the</strong> Year 83,639 30,0542. Reconciliation of <strong>the</strong> Opening and Closing balances of <strong>the</strong>Fair Value of Plan Assets :a. Fair value of Plan Assets at <strong>the</strong> Beginning of <strong>the</strong> Year - -b. Fair value of Plan Assets transferred from Holding Company 73,999 17,956( Note 3 Above )c. Expected return on Plan Assets 6,324 1,789d. Actuarial gain/(loss) 211 (236)e. Contributions by <strong>the</strong> Employer 9,021 9,706f. Benefits paid (4,636) (2,506)g. Fair value of Plan Assets at <strong>the</strong> end of <strong>the</strong> Year 84,919 26,7093. Reconciliation of <strong>the</strong> Present Value of Obligation and FairValue of <strong>the</strong> Plan Assets :a. Fair value of Plan Assets at <strong>the</strong> end of <strong>the</strong> Year 84,919 26,709b. Present Value of Obligation at <strong>the</strong> end of <strong>the</strong> Year 83,639 30,054c. (Asset)/Liabilities recognised in <strong>the</strong> Balance Sheet (1,280) 3,3454. Expenses recognised during <strong>the</strong> year :a. Current Service cost 3,257 2,633b. Interest cost 5,946 1,593c. Expected return on Plan Assets (6,324) (1,789)d. Actuarial (Gain)/ Loss 4,904 8,119e. Expense recognised during <strong>the</strong> year 7,783 10,5565. Experience Adjustments on Plan Obligation and Assetsa. Experience Adjustments on Plan Obligation [(Gain)/Loss] 6,147 8,372b. Experience Adjustments on Plan Assets [(Gain)/Loss] 211 (236)The expense for <strong>the</strong> defined benefits (referred to in para 15.2 and 15.3 above) are included in <strong>the</strong> line item under ‘Contribution to Providentand o<strong>the</strong>r Funds’ on Schedule ‘M’ .@ - Not Applicable
126Schedule forming part of <strong>the</strong> Accounts for <strong>the</strong> year ended 31st March, 2011SCHEDULE ‘N’ (Condt.)Particulars in respect of post retirement defined benefit plans of <strong>the</strong> Company are as follows :-DescriptionSuperannuation Fund % Invested Gratuity Fund % Invested31.03.2011 31.03.2010 ‘@ 31.03.2011 31.03.2010 ‘@6. Investment Details of Plan Assets as ata. Govt of India Securities 20.53 20.79b. Public Sector (PSU)Bonds 47.16 30.54c. State/Central Govt Securities 16.82 18.70d. Special Deposit Scheme 14.99 29.81e. O<strong>the</strong>r including Bank Balance 0.50 0.16Total 100.00 100.007. Assumptionsa. Discount rate per annum 8.50 8.50b. Salary escalation rate per annum 4.00 4.00c. Expected rate of return on Plan Assets per annum 8.00 8.00d. Method used Projected Unit Projected UnitCredit MethodCredit Method8. Actual Return on Plan Assets 7.64% 6.53%@ - Not Applicable15.5 The basis used to determine overall expected rate of return on assets and <strong>the</strong> effect on major categories of Plan Assets is as follows :The major portions of <strong>the</strong> Assets are invested in PSU Bonds and Special Deposits. Based on <strong>the</strong> asset allocation and prevailing yield rates on <strong>the</strong>se assetclasses, <strong>the</strong> long term estimate of <strong>the</strong> expected rate of return on <strong>the</strong> fund assets have been arrived at. Assumed rate of return on assets is expected tovary from year to year reflecting <strong>the</strong> returns on matching Government Bonds.15.6 The estimate of future salary increases take into account inflation, seniority, promotion and o<strong>the</strong>r relevant reasons.15.7 In respect of <strong>the</strong> Company’s Defined Benefit Plans pertaining to Gratuity and Superannuation benefit schemes for employees taken over in terms of <strong>the</strong>Scheme of Arrangement, as indicated in Note 3 above, <strong>the</strong> present value of obligation as on 1st April, 2010 have been worked out by an independentactuary based on relevant information related to each such employees. The fair value of plan assets pertaining to <strong>the</strong> Company as on 01.04.10 inrespect of Gratuity and Superannuation benefit scheme funds, being maintained by Tractors India Limited Staff Gratuity Fund and Tractors India LimitedSuperannuation Fund respectively have been bifurcated by <strong>the</strong> Trustees of <strong>the</strong> related funds in proportion to <strong>the</strong> present value of <strong>the</strong> obligation determinedby <strong>the</strong> independent actuary as referred above.16.1 Particulars of Goods ManufacturedYear Ended 31.03.2011 Year Ended 31.03.2010Diesel Generating Sets -Licensed Capacity 500 Nos -Installed Capacity * 400 Nos -Actual Production 383 Nos -* As certified by <strong>the</strong> Management
Over<strong>view</strong> Performance Re<strong>view</strong>s Governance Financials127Annual Report 2010-11Schedule forming part of <strong>the</strong> Accounts for <strong>the</strong> year ended 31st March, 2011SCHEDULE ‘N’ (Condt.)16.2 Particulars of Construction, Mining Equipment and Diesel Generating Sets and o<strong>the</strong>r classes of Goods Dealt in Stock, Purchases (Trading) and SalesClass of Goodsa) Construction & MiningEquipment, etc.OpeningStockUnit of Qty. Qty. Value` ‘000StockTransfer *Qty. Value` ‘000Purchases Sales(Gross)Qty. Value` ‘000Qty. Value` ‘000ClosingStockQty. Value` ‘000Nos. - - 52 139,321 1,263 3,963,536 1,139 ** 4,135,972 176 745,076(-) (-) (-) (-) (-) (-) (-) (-) (-) (-)b) Diesel Generating Set Nos. - - - - - - 371 *** 822,628 12 16,738(-) (-) (-) (-) (-) (-) (-) (-) (-) (-)c) Packaged Diesel Generating Set Nos. - - 14 371,121 244 1,041,979 185 805,007 73 649,420(-) (-) (-) (-) (-) (-) (-) (-) (-) (-)d) Goods, Components and Partsfor Mining Equipments & DieselGenerating Set467,442 2,783,904 2,705,630 690,840(-) (-) (-) (-)e) O<strong>the</strong>rs (Refer Note 11) - - 227,478 -(-)Total - 977,884 7,789,419 8,696,715 2,102,074Previous year (-) (-) (-) (-) (-)[ Previous year’s figuresindicated in bracket ]* Stock transfer from Holding Company as on 1st April,2010 vide Scheme of Arrangement. (Note 3 above.)** Includes 17 Capitalised during <strong>the</strong> year.*** Includes 12 capitalised during <strong>the</strong> year. ( Refer Schedule ‘L’ )With <strong>the</strong> exception of Construction, Mining Equipment and Diesel Generating Sets mentioned above ,none of <strong>the</strong> items included in <strong>the</strong> above classes of goods exceeded individually 10% of <strong>the</strong> totalvalue of Purchases, Stock or Turnover and accordingly quantitative information has not been provided for .
128Schedule forming part of <strong>the</strong> Accounts for <strong>the</strong> year ended 31st March, 2011SCHEDULE ‘N’ (Condt.)16.3 Details of Indigenous Raw Materials (Including Components) consumed:Particulars Unit Quantity Value ` ’000 PercentageEngine Nos 371 350,402(-) (-)Acoustic Enclosure (for D G Set) Nos 387 89,667(-) (-)Alternator (for DG Sets) Nos 364 82,951(-) (-)Miscellaneous * (-) 62,049(-) (-)Total 585,069 100.00(-)* As none of <strong>the</strong> Miscellaneous items exceeded individually 10% of <strong>the</strong> total value of consumption quantitative information has not been provided for.[Previous year’s figures indicated in bracket]17. Segment Reporting in accordance with Accounting Standards 17 :On transfer of <strong>the</strong> undertaking from TIL Limited ( Holding Company ) to <strong>the</strong> Company with effect from 1st April 2010 pursuant to <strong>the</strong> Scheme ofarrangement (Note 3 above ) <strong>the</strong> Company’s business segments are as follows:-Construction & Mining Solutions (CMS) - engaged as a dealer for Caterpillar Inc. USA for <strong>the</strong>ir earthmoving, construction mining equipments, sparesetc. and providing related services in Eastern and Nor<strong>the</strong>rn India and Bhutan.Power Systems Solutions (PSS) - engaged in assembly, supply, erection and commissioning of Generating Sets powered by Caterpillar engines anddealing in spares etc and providing related services in Eastern and Nor<strong>the</strong>rn India and Bhutan.O<strong>the</strong>r represents all unallocated expenditure and includes expenses incurred on common services provided to <strong>the</strong> segments which are not directlyidentifiable to <strong>the</strong> individual segments as well as expenses incurred at <strong>the</strong> corporate level which relate to <strong>the</strong> Company as a whole.There has been no inter segment transactions during <strong>the</strong> year.The Company operates predominantly within <strong>the</strong> geographical limits of India, accordingly secondary segments have not been considered.(` in ‘000)Year Ended 31.03.2011CMS PSS OTHERSTotal(Unallocated)Segment Revenue * 6,545,080 2,504,484 - 9,049,564Segment Results 326,469 188,541 - 515,010Less : Unallocated expenses net ofUnallocated (income) - -Interest expenses 177,033 177,033Profit/(Loss) before tax 337,977Depreciation and Amortisation 88,717 52,673 - 141,390Non Cash Expenses o<strong>the</strong>r than 6,665 2,478 - 9,143Depreciation and AmortisationSegment Assets 2,854,559 1,760,600 109,985 4,725,144Segment Liabilities 838,955 679,638 2,057,530 3,576,123(excluding Shareholders’ funds)Capital Expenditure 191,096 146,408 - 337,504* There is no inter segment revenue.Note : Segment information in respect of previous year 2009-10 is not applicable
Over<strong>view</strong> Performance Re<strong>view</strong>s Governance Financials129Annual Report 2010-11Schedule forming part of <strong>the</strong> Accounts for <strong>the</strong> year ended 31st March, 2011SCHEDULE ‘N’ (Condt.)18. Related Party Disclosure in keeping with Accounting Standard 18 on “Related Party Disclosures”.A) List of Related PartiesHolding CompanyTIL LimitedKey Management Personnel Mr. S. Mazumder( Chairman & Managing Director) *Mr. G V R. Murthy (Joint Managing Director) *Mr. A. Banerjee (Director Finance) **Mr. Soumen Das **** Appointed wef 1st April,2010.** Director up to 31st March,2010 and appointed as Director Finance w.e.f 1st April, 2010*** Ceased to be Director w.e.f 1st April, 2010B) Particulars of transactions during <strong>the</strong> year ended 31st March, 2011 :(` in ‘000)Particulars Year Ended 31.03.2011 Year Ended 31.03.2010I) Holding Companya) Asset Usage Charges Paid 9,339 -b) Reimbursement of Expenses 102,357 -c) Issue of 4,489,430 number of equity shares of ` 10 each at a Premium of958,396 -` 203.48 per share pursuant to Scheme of Arrangement (Note 3 above)d) Year-end Balancesi) Share Capital 45,000 -ii) Share Premium 913,501 -iii) Advance recoverable - 48II) Key Management Personnela) Remuneration (Note 19 below)Mr. S. Mazumder 19,021 -Mr. GVR Murthy 12,481 -Mr. A. Banerjee 9,611 -b) Year end BalanceCommission PayableMr. S. Mazumder 7,862 -Mr. GVR Murthy 4,681 -Mr. A. Banerjee 3,511 -
130Schedule forming part of <strong>the</strong> Accounts for <strong>the</strong> year ended 31st March, 2011SCHEDULE ‘N’ (Condt.)(` in ‘000)Year Ended 31.03.2011 Year Ended 31.03.201019.1 Managerial Remunerationa) Executive Directorsi) Salaries and Allowances 11,098 -ii) Contribution to Funds :Provident Fund 1,152 -Superannuation Fund 596 -Gratuity Fund 224 -1,972 -iii) Estimated value of benefits computed wherenecessary under Income Tax Rules. 11,989 -iv) Commission 16,054 -b) Non Executive Directorsi) Sitting Fees 60 -ii) Commission 800 -41,973 -(` in ‘000)Year Ended 31.03.2011 Year Ended 31.03.201019.2 Computation of Net Profits under Sections 198 and 349 of <strong>the</strong> Companies Act, 1956Profit before taxation as per Profit & Loss Account 337,977 -Add : Directors’ Remuneration :Sitting Fees 60 -Salaries, Commission and estimated value of o<strong>the</strong>r benefits 41,913 -41,973 -Depreciation and Amortization charged to Accounts 141,390 -521,340 -Deduct : Depreciation under Section 350 of <strong>the</strong> Companies Act, 1956. 53,185 -The excess of expenditure over income computed as per 51Sec-349 in respect of earlier yearsAdjusted Profit in accordance with Section 198 of <strong>the</strong> Companies Act, 1956. 468,104 -10% <strong>the</strong>re of, being <strong>the</strong> maximum permissible limit under section 198 of <strong>the</strong> Companies46,810 -Act,1956.Executive Directors Commission restricted (As per service agreement) 16,054 -1% <strong>the</strong>re of, being <strong>the</strong> maximum permissible limit under section 198 of <strong>the</strong> Companies4,681 -Act,1956.O<strong>the</strong>r Directors’ Commission restricted to 800 -
Over<strong>view</strong> Performance Re<strong>view</strong>s Governance Financials131Annual Report 2010-11Schedule forming part of <strong>the</strong> Accounts for <strong>the</strong> year ended 31st March, 2011SCHEDULE ‘N’ (Condt.)(` in ‘000)Year Ended 31.03.2011 Year Ended 31.03.201020. C.I.F. Value of Imports :(a) Parts and Components 1,160,969 -(b) Machines (Trading Items) 2,198,023 -21. Expenditure in Foreign Currency :(on payment basis)Travelling 4,711 -22. Earnings in Foreign Exchange :(Remittance received) on account of(a) Export of goods calculated on FOB basis 15,085 -(b) Selling Commission (including Dealer’s profit) 175,682 -23. The figures for <strong>the</strong> current year are not comparable with those of <strong>the</strong> previous year (which have been rearranged/regrouped wherever necessary) as<strong>the</strong> figures for current year include transactions arising from transfer of undertaking of TIL Limited pertaining to dealership business of Caterpillar to <strong>the</strong>Company with effect from 1st April,2010 as referred to in Note 3 above.Signatures to Schedules ‘A’ to ‘N’For and on behalf of Board of DirectorsFor Price WaterhouseFirm Registration No. 301112EChartered AccountantsP.LawPartnerMembership No.51790Sumit MazumderChairman & Managing DirectorG.V.R. MurthyJoint Managing DirectorAloke BanerjeeDirector FinanceKolkata16th May, 2011.
132Cash Flow Statement for <strong>the</strong> year ended 31st March, 2011(` in ‘000)Year ended 31.03.2011 Year ended 31.03.2010A. CASH FLOW FROM OPERATING ACTIVITIESNet Profit/(Loss) Before Tax 337,977 (15)Adjustments for :Depreciation and Amortisation 141,390 -Bad Debts,Advances etc Written off 9,143 -(Profit)/Loss on Sale of Fixed Assets (Net) (16,876) -Interest Expenses (Net) 177,033 -Preliminary Expenses Written off - 8Unrealised Foreign Exchange (Gain)/Loss (Net) (10,216) -300,474 8Operating Profit/(Loss) before Working Capital Changes 638,451 (7)Adjustments for :Trade and O<strong>the</strong>r Receivables (157,944) -Inventories (1,287,476) -Loans and Advances and O<strong>the</strong>r Current Assets (26,359) 20Trade Payable 393,548 2(1,078,231) 22Cash Generated from Operations (439,780) 15Direct Taxes Paid (109,985) -Net Cash (Used in)/from Operating Activities (549,765) 15B. CASH FLOW FROM INVESTING ACTIVITIESPurchase of Fixed Assets (306,479) -Proceeds from Sale of Fixed Assets 74,182 -Net Cash (Used in)/from Investing Activities (232,297) -
Over<strong>view</strong> Performance Re<strong>view</strong>s Governance Financials133Annual Report 2010-11Cash Flow Statement for <strong>the</strong> year ended 31st March, 2011 (Contd.)(` in ‘000)Year ended 31.03.2011 Year ended 31.03.2010C. CASH FLOW FROM FINANCING ACTIVITIESInterest Paid (163,312)Proceeds from Long Term borrowings 10,039Repayment of Long Term borrowings (492,059)Increase in Cash Credit and o<strong>the</strong>r short term borrowings (Net) 1,428,008 (15)Net Cash (Used in) from Financing Activities 782,676 (15)Net Increase/ (Decrease) In Cash And Cash Equivalents614 -(A+B+C)Cash and Cash Equivalents as at <strong>the</strong> beginning of <strong>the</strong> year (Schedule ‘H’) 11 11Cash and Cash Equivalents as at <strong>the</strong> close of <strong>the</strong> year (Schedule ‘H’ ) 625 11Notes : 1)The above Cash Flow Statement has been prepared under <strong>the</strong> ‘ Indirect Method ‘ as set out in <strong>the</strong> Accounting Standard - 3 on Cash Flow Statements.2) The above Cash Flow Statement does not reflect transfer of Assets and Liabilities amounting to ` 3,044,068 thousand and ` 2,085,672 thousandrespectively from TIL Ltd pursuant to <strong>the</strong> Scheme of Arrangement indicated in Note 3 on Schedule ‘N’, being non cash in nature.3) The Schedules referred to above forms an integral part of <strong>the</strong> Cash Flow Statement .4) The figures for <strong>the</strong> current year are not comparable with those of <strong>the</strong> previous year as <strong>the</strong> figures for current year include transactions arising fromtransfer of undertaking of TIL Limited pertaining to dealership business of Caterpillar to <strong>the</strong> Company with effect from 1st April, 2010, referred toin Note 3 on Schedule ‘N’ .This is <strong>the</strong> Cash Flow Statement referred to in our report of even date.For and on behalf of Board of DirectorsFor PRICE WATERHOUSEFirm Registration No. 301112EChartered AccountantsG.V.R. MurthyP. Law Joint Managing DirectorPartnerMembership No.51790Kolkata16th May, 2011.Sumit MazumderChairman & Managing DirectorAloke BanerjeeDirector Finance
134Balance Sheet Abstract and Company’s General Business ProfileI. Registration DetailsRegistration No. 7 2 5 0 1 State Code 2 1Balance Sheet Date 3 1 . 0 3 . 2 0 1 1II. Capital Raised during <strong>the</strong> Year (All Figures in ` ‘000)Public Issue - Rights Issue -Bonus Issue - Private Placement 4 4 8 9 4III. Position of Mobilisation and Deployment of Funds (All Figures in ` ‘000)Total Liabilities (Including Owner’s Fund) 4 7 2 5 1 4 4 Total Assets 4 7 2 5 1 4 4Sources of FundsPaid-up Capital 4 5 0 0 0 Reserves and Surplus 1 1 0 4 0 2 1Secured Loans 1 3 4 3 9 7 8 Unsecured Loans 5 6 0 4 8 0Application of FundsNet Fixed Assets (Including Capital Work In Progress) 8 3 2 1 5 9 Investments -Net Current Assets 2 2 6 3 9 7 6 Misc Expenditure -IV. Performance of Company (All Figures in ` ‘000)Turnover(excluding O<strong>the</strong>r Income 29,419) 9 0 8 1 5 3 3 Total Expenditure 8 6 3 1 5 8 5Profit/(Loss) Before Tax 3 3 7 9 7 7 Profit/(Loss) after Tax 1 9 0 5 7 1Earnings Per Share (Figure in `) 4 2 . 3 5 Dividend Rate % -V. Generic Names of Product/Services of Company (as per monetary terms)Item Code No. (ITC Code) 8 5 0 2Product Description D G S E T SFor and on behalf of Board of DirectorsSumit MazumderChairman & Managing DirectorG.V.R. MurthyJoint Managing DirectorAloke BanerjeeDirector Finance
Over<strong>view</strong> Performance Re<strong>view</strong>s Governance Financials135Annual Report 2010-11Myanmar Tractors Limited GENERAL INFORMATIONDIRECTORSMr. A. MazumdarMr. S. MazumderMr. Shyamal BandopadhyayMr. Aloke BanerjeeChairmanDirectorDirectorDirectorREGISTERED OFFICE16, Mya Mar Lar Lane,Industrial Zone, Thaketa Township,Yangon, MyanmarBANKERSMyanma Investment & Commercial Bank (MICB)Myanmar Foreign Trade Bank (MFTB)Myanmar Citizen Bank (MCB)Myawaddy Bank (MWD)Kan Baw Za Bank (KBZ)AUDITORSU Tin Win GroupEngagement Partner : Naing Naing San
136Directors’ Report for <strong>the</strong> Financial Year ended 31st March, 2011.The Directors have pleasure in submitting <strong>the</strong>ir report and <strong>the</strong> audited financial statements for <strong>the</strong> year ended 31st March, 2011.REVIEW OF OPERATIONSOur business in Myanmar is now done jointly by Myanmar Tractors Ltd. and TIL Overseas Pte Ltd. (a group company registered in Singapore – owned 100% byTIL Ltd.).Whereas TIL Overseas Pte Ltd. sells Prime Products and Parts on CIF Yangon basis, Myanmar Tractors provides After-Sales Service, Rental of Gensets/ Construction/Earthmoving Equiptment, Technical Support etc.Myanmar market showed a huge upward shift last year, with Private Customers and Contractors buying large number of Machines and Parts for various projects.However, economic embargoes were imposed/streng<strong>the</strong>ned by various Countries on Myanmar during <strong>the</strong> year under re<strong>view</strong>. This has affected our business thisyear and your Directors are apprehensive that this will continue to affect our business substantially <strong>til</strong>l <strong>the</strong>se Embargoes last.Due to all <strong>the</strong> above, your company has achieved a turnover of US$ 7,709,869(last year US$ 11,191,969) profit before tax of US$ 861,862( last year US$ 799,021).Your Directors will make all possible efforts to maximize <strong>the</strong> future business opportunity in <strong>the</strong> environment under which your company operates.DIVIDENDConsidering <strong>the</strong> increasing future requirements of funds for <strong>the</strong> company, <strong>the</strong> Board recommends no dividend this year and <strong>the</strong> entire profit is being retained in<strong>the</strong> business.DIRECTORSThere is no change in <strong>the</strong> Board of Directors during <strong>the</strong> year.Presently <strong>the</strong> Board consists of <strong>the</strong> following persons:-1. Mr. A. Mazumdar2. Mr. S. Mazumder3. Mr. Shyamal Bandopadhyay4. Mr. Aloke BanerjeeAUDITORSThe Report of <strong>the</strong> Auditors, U Tin Win group, T.A Firm of Ernst & Young International, is attached with <strong>the</strong> financial statements.The Directors take this opportunity to thank all <strong>the</strong> Customers, Employees, Principals and all Stakeholders, whose continuous support helped <strong>the</strong> company toachieve a profitable performance, despite <strong>the</strong> adverse situations, as explained under <strong>the</strong> heading “Re<strong>view</strong> of Operations”.28th April, 2011S. MazumderVice Chairman
Over<strong>view</strong> Performance Re<strong>view</strong>s Governance Financials137Annual Report 2010-11Independent Auditors’ ReportTO THE MEMBERS OF MYANMAR TRACTORS LIMITEDWe have audited <strong>the</strong> accompanying financial statements of <strong>the</strong> company, which comprise <strong>the</strong> balance sheet as at March 31, 2011 and <strong>the</strong> profit & loss accountfor <strong>the</strong> year <strong>the</strong>n ended, and a summary of significant accounting policies and o<strong>the</strong>r explanatory notes.Management’s Responsibility for <strong>the</strong> Financial StatementsManagement is responsible for <strong>the</strong> preparation and fair presentation of <strong>the</strong>se financial statements in accordance with <strong>the</strong> provisions of <strong>the</strong> Myanmar CompaniesAct (Act) and generally accepted financial reporting standards. This responsibility includes:(a)(b)(c)devising and maintaining a system of internal accounting controls sufficient to provide a reasonable assurance that assets are safeguarded against lossfrom unauthorized use or disposition; and transactions are properly authorized and that <strong>the</strong>y are recorded as necessary to permit <strong>the</strong> preparation of trueand fair profit and loss accounts and balance sheets and to maintain accountability of assets;selecting and applying appropriate accounting policies; andmaking accounting estimates that are reasonable in <strong>the</strong> circumstances.Auditor’s ResponsibilityOur responsibility is to express an opinion on <strong>the</strong>se financial statements based on our audit. We conducted our audit in accordance with International Standards onAuditing. Those standards require that we comply with ethical requirements and plan and perform <strong>the</strong> audit to obtain reasonable assurance whe<strong>the</strong>r <strong>the</strong> financialstatements are free from material misstatement.An audit involves performing procedures to obtain audit evidence about <strong>the</strong> amounts and disclosures in <strong>the</strong> financial statements. The procedures selected dependon <strong>the</strong> auditor’s judgment, including <strong>the</strong> assessment of <strong>the</strong> risks of material misstatement of <strong>the</strong> financial statements, whe<strong>the</strong>r due to fraud or error. In makingthose risk assessments, <strong>the</strong> auditor considers internal control relevant to <strong>the</strong> entity’s preparation and fair presentation of <strong>the</strong> financial statements in order todesign audit procedures that are appropriate in <strong>the</strong> circumstances, but not for <strong>the</strong> purpose of expressing an opinion on <strong>the</strong> effectiveness of <strong>the</strong> entity’s internalcontrol. An audit also includes evaluating <strong>the</strong> appropriateness of accounting policies used and <strong>the</strong> reasonableness of accounting estimates made by management,as well as evaluating <strong>the</strong> overall presentation of <strong>the</strong> financial statements.We believe that <strong>the</strong> audit evidence we have obtained is sufficient and appropriate to provide a basis for our audit opinion.OpinionIn our opinion,(i) <strong>the</strong> financial statements are properly drawn up in accordance with <strong>the</strong> provisions of <strong>the</strong> Act and International Financial Reporting Standards so as to givea true and fair <strong>view</strong> of <strong>the</strong> state of affairs of <strong>the</strong> company as at 31st March, 2011 and <strong>the</strong> results of <strong>the</strong> company for <strong>the</strong> year ended on that date; and(ii)<strong>the</strong> accounting and o<strong>the</strong>r records required by <strong>the</strong> Act to be kept by <strong>the</strong> company have been properly kept in accordance with <strong>the</strong> provisions of <strong>the</strong> Act.Myanmar28th April, 2011U Tin Win GroupCertified Public Accountants
138Balance Sheet as at 31st March, 2011US $ ` US $ `Schedule As at 31.03.2011 As at 31.03.2011 As at 31.03.2010 As at 31.03.2010SOURCES OF FUNDS1. Shareholders’ Funds(a) Capital A 4,100,000 187,124,000 4,100,000 194,381,000(b) Reserves and Surplus B 6,811,646 310,883,523 6,513,292 308,795,17410,911,646 498,007,523 10,613,292 503,176,1742. Loan Funds C - - - -Total 10,911,646 498,007,523 10,613,292 503,176,174APPLICATIONS OF FUNDS1. Fixed Assets E(a) Gross Block 4,340,474 198,099,233 4,557,377 216,065,244(b) Less : Depreciation 3,084,304 140,767,635 2,894,575 137,231,801(c) Net Block 1,256,170 57,331,599 1,662,802 78,833,443(d) Capital Work-in-Progress 246,873 11,267,284 80,977 3,839,1201,503,043 68,598,883 1,743,779 82,672,5622. Investments F - - - -3. Current Assets,Loans and Advances(a) Inventories G 4,653,958 212,406,643 5,412,101 256,587,708(b) Sundry Debtors H 355,420 16,221,369 833,335 39,508,412(c) Cash and Bank Balances I 2,428,681 110,845,001 1,522,678 72,190,164(d) O<strong>the</strong>r Current Assets J 3,171,622 144,752,828 2,058,755 97,605,575(e) Loans and Advances K 1,443,030 65,859,889 1,602,253 75,962,81512,052,711 550,085,730 11,429,122 541,854,674Less :Current Liabilities and ProvisionsD(a) Liabilities 2,385,549 108,876,456 2,319,903 109,986,601(b) Provisions 258,559 11,800,633 239,706 11,364,4612,644,108 120,677,089 2,559,609 121,351,063Net Current Assets 9,408,603 429,408,641 8,869,513 420,503,611Total 10,911,646 498,007,523 10,613,292 503,176,174This is <strong>the</strong> Balance Sheet referred to in our report of even date.Ms. Naing Naing SannCertified Public AccountantFor and on behalf ofU Tin Win GroupMyanmarFor and on behalf of Board of DirectorsSumit MazumderVice ChairmanAloke BanerjeeDirectorDate: 28th April, 2011
Over<strong>view</strong> Performance Re<strong>view</strong>s Governance Financials139Annual Report 2010-11Profit & Loss Account for <strong>the</strong> year ended 31st March,2011ScheduleYear to31.03.2011US $ ` US $ `Year to31.03.2011Year to31.03.2010Year to31.03.2010INCOMESales and Services (Gross) O 6,225,176 284,117,033 9,564,370 453,446,782Less : Excise Duty - - - -Sales and Services (Net) 6,225,176 284,117,033 9,564,370 453,446,782Rental from Machinery 738,122 33,687,888 1,088,829 51,621,383O<strong>the</strong>r Income L 746,571 34,073,500 538,770 25,543,0867,709,869 351,878,421 11,191,969 530,611,250EXPENDITURECost of Materials and Direct Manufacturing Expenses M 1,796,027 81,970,672 4,606,356 218,387,338Expenses N 4,546,167 207,487,062 5,277,944 250,227,3256,342,194 289,457,734 9,884,300 468,614,663Interest on :Debentures and O<strong>the</strong>r Fixed Loans - - - -O<strong>the</strong>rs - - 1,219 57,793- - 1,219 57,793Depreciation and Amortization 505,813 23,085,305 507,429 24,057,209Profit Before Taxation 861,862 39,335,382 799,021 37,881,586Less : Provision for Taxation :Current Tax 258,559 11,800,633 239,706 11,364,461Profit After Taxation 603,303 27,534,749 559,315 26,517,124Add : Transfer from Revaluation Reserve on sale of AssetsLess : Adjustment for under provision of tax & o<strong>the</strong>r prior period items. (304,949) (13,917,872) (50,109) (2,375,668)Add : Balance of Profit and Loss Accountbrought forward from previous year 6,513,292 297,266,647 6,004,086 284,653,717BALANCE AVAILABLE FOR APPROPRIATIONS 6,811,646 310,883,523 6,513,292 308,795,174APPROPRIATIONSGeneral Reserve 1,681,003 76,720,977 1,681,003 76,720,977Proposed Dividend :Balance Carried Forward 5,130,643 234,162,547 4,832,289 232,074,1976,811,646 310,883,523 6,513,292 308,795,174This is <strong>the</strong> Profit & Loss Account referred to in our report of even date.Ms. Naing Naing SannCertified Public AccountantFor and on behalf ofU Tin Win GroupMyanmarFor and on behalf of Board of DirectorsSumit MazumderVice ChairmanAloke BanerjeeDirectorDate: 28th April, 2011
140Schedule forming part of <strong>the</strong> Balance SheetUS $ ` US $ `As at 31.03.2011 As at 31.03.2011 As at 31.03.2010 As at 31.03.2010SCHEDULE ‘A’Share CapitalAuthorized50,000, Ordinary Shares of Kyat 1,000/- each 8,333,333 380,333,318 8,333,333 395,083,3188,333,333 380,333,318 8,333,333 395,083,318Issued,Subscribed and Paid up24,325 Ordinary Shares of Kyat 1,000/- each fully paid up 4,100,000 187,124,000 4,100,000 194,381,000(Equivalent to US$ 168.55 per share)Total 4,100,000 187,124,000 4,100,000 194,381,000As per lastAccountAdditions Deductions As at31.03.2011SCHEDULE ‘B’Reserves and SurplusGeneral Reserve US$ 1,681,003 1,681,003` 76,720,977 - - 76,720,977Profit and Loss Account US$ 4,832,289 603,303 (304,949) 5,130,643` 220,545,670 27,534,749 (13,917,872) 234,162,547Total US$ 6,513,292 6,811,646` 297,266,647 310,883,523# As under provision of US$ 304,949 was adjusted by debiting Retain Earning.# Figures in bold type represent US$ figure.
Over<strong>view</strong> Performance Re<strong>view</strong>s Governance Financials141Annual Report 2010-11Schedule forming part of <strong>the</strong> Balance Sheet (Contd.)US $ ` US $ `As at 31.03.2011 As at 31.03.2011 As at 31.03.2010 As at 31.03.2010SCHEDULE ‘C’Loan FundsSecured Loans - - - -Unsecured Loans - - - -O<strong>the</strong>r Loans - - - -Total - - - -US $ ` US $ `As at 31.03.2011 As at 31.03.2011 As at 31.03.2010 As at 31.03.2010SCHEDULE ‘D’Current Liabilities and ProvisionsCurrent Liabilities :Sundry Creditors 2,254,303 102,886,389 2,030,591 96,270,319Advance from Customers and o<strong>the</strong>rs 131,246 5,990,067 249,312 11,819,882O<strong>the</strong>r Liabilities - - 40,000 1,896,4002,385,549 108,876,456 2,319,903 109,986,601Provisions for :Provision for Taxation 258,559 11,800,633 239,706 11,364,461Total 2,644,108 120,677,089 2,559,609 121,351,063
142Schedule forming part of <strong>the</strong> Balance Sheet (Contd.)Cost / Valuationas at31.03.2010Additions/Adjustmentduring <strong>the</strong> yearSales/Adjustmentetc. during<strong>the</strong> yearTotal Cost /Valuationas at31.03.2011DepreciationProvidedup to31.03.2010DepreciationProvidedduring<strong>the</strong> yearDepreciation onSales/Adjustmentetc. during<strong>the</strong> yearDepreciationProvidedup to31.03.2010Net Valueof Assetsas at31.03.2011SCHEDULE ‘E’Fixed AssetsTangible AssetsBuildings :Leasehold US$ 567,281 - - 567,281 310,593 25,248 - 335,841 231,440 256,688` 25,890,705 - - 25,890,705 14,175,465 1,152,319 - 15,327,783.24 10,562,922 12,169,578Plant and Machinery US$ 317,097 78,358 25,690 369,765 235,423 30,817 25,673 240,567 129,198 81,674` 14,472,307 3,576,259 1,172,492 16,876,075 10,744,706 1,406,488 1,171,716 10,979,477.88 5,896,597 3,872,164Rental Equipment US$ 2,141,074 - 353,179 1,787,895 980,570 373,840 275,801 1,078,609 709,286 1,160,504` 97,718,617 - 16,119,090 81,599,528 44,753,215 17,062,058 12,587,558 49,227,714.76 32,371,813 55,019,495Furniture and Equipment US$ 684,646 20,121 6,491 698,276 632,487 17,882 5,752 644,617 53,659 52,159` 31,247,243 918,322 296,249 31,869,317 28,866,707 816,134 262,521 29,420,319.88 2,448,997 2,472,858Cycle and Motor Vehicles US$ 761,153 78,854 5,996 834,011 649,384 58,026 5,980 701,430 132,581 111,769` 34,739,023 3,598,897 273,657 38,064,262 29,637,886 2,648,307 272,927 32,013,265.20 6,050,997 5,298,968Sub total US$ 4,471,251 177,333 391,356 4,257,228 2,808,457 505,813 313,206 3,001,064 1,256,164 1,662,794` 204,067,896 8,093,478 17,861,488 194,299,886 128,177,977 23,085,305 14,294,722 136,968,561 57,331,325 78,833,064Intangible Assets(aquired items)Software US$ 86,126 - 2,880.00 83,246 86,118 2,878.00 83,240 6 8` 3,930,791 - 131,443 3,799,347 3,930,426 - 131,352 3,799,074 274 379Sub total US$ 86,126 - 2,880 83,246 86,118 - 2,878 83,240 6 8` 3,930,791 - 131,443 3,799,347 3,930,426 - 131,352 3,799,074 274 379Total US$ 4,557,377 177,333 394,236 4,340,474 2,894,575 505,813 316,084 3,084,304 1,256,170 1,662,802` 207,998,686 8,093,478 17,992,931 198,099,233 132,108,403 23,085,305 14,426,074 140,767,635 57,331,599 78,833,443Previous year US$ 4,803,688 213,033 459,344 4,557,377 2,834,015 507,429 446,869 2,894,575` 227,742,848 10,099,895 21,777,499 216,065,244 134,360,651 24,057,209 21,186,059 137,231,801Capital Work-in-Progress US$ 246,873 80,977` 11,267,284 3,839,120Grand total US$ 1,503,043 1,743,779` 68,598,883 82,672,562Net Valueof Assetsas at31.03.2010
Over<strong>view</strong> Performance Re<strong>view</strong>s Governance Financials143Annual Report 2010-11Schedule forming part of <strong>the</strong> Balance Sheet (Contd.)As at 31.03.2011 As at 31.03.2010Particulars Numbers Value Numbers ValueSCHEDULE ‘F’Investments - Long Term - at CostTrade - Unquoted : - - - -O<strong>the</strong>r than Trade : - - - -Total - -US $ ` US $ `As at 31.03.2011 As at 31.03.2011 As at 31.03.2010 As at 31.03.2010SCHEDULE ‘G’InventoriesLoose tools - at or under cost 269,266 12,289,300 219,551 10,408,913Stock-in-Trade-at lower of cost and net4,378,962 199,855,826 4,869,842 230,879,209realisable valueWork-in-Progress-at lower of cost / realisable value 5,730 261,517 322,708 15,299,586Total 4,653,958 212,406,643 5,412,101 256,587,708** Cost of inventories were valued on FIFO method.US $ ` US $ `As at 31.03.2011 As at 31.03.2011 As at 31.03.2010 As at 31.03.2010SCHEDULE ‘H’Sundry Debtors(Unsecured -Considered Good)Debts outstanding for more than six months - - 18,508 877,464**O<strong>the</strong>r Debts 355,420 16,221,369 814,827 38,630,948Total 355,420 16,221,369 833,335 39,508,412
144Schedule forming part of <strong>the</strong> Balance Sheet (Contd.)US $ ` US $ `As at 31.03.2011 As at 31.03.2011 As at 31.03.2010 As at 31.03.2010SCHEDULE ‘I’Cash and Bank BalancesCash in hand 492,341 22,470,443 415,726 19,709,570Balance with Banks** On Current Accounts 1,936,340 88,374,558 1,106,952 52,480,594Total 2,428,681 110,845,001 1,522,678 72,190,164US $ ` US $ `As at 31.03.2011 As at 31.03.2011 As at 31.03.2010 As at 31.03.2010SCHEDULE ‘J’O<strong>the</strong>r Current Assets(Unsecured-Considered Good)Claims Receivable 2,640,147 120,496,309 386,998 18,347,575Amount due from related company 482,628 22,027,142 1,494,023 70,831,630Deposits 48,847 2,229,377 177,734 8,426,369Total 3,171,622 144,752,828 2,058,755 97,605,575US $ ` US $ `As at 31.03.2011 As at 31.03.2011 As at 31.03.2010 As at 31.03.2010SCHEDULE ‘K’Loans and Advances (Unsecured-Considered Good)Advances recoverable in cash or in kind or for value918,876 41,937,501 1,464,147 69,415,209to be receivedAdvance Income Tax (Including Tax deducted at524,154 23,922,389 138,106 6,547,605source)Total 1,443,030 65,859,889 1,602,253 75,962,815
Over<strong>view</strong> Performance Re<strong>view</strong>s Governance Financials145Annual Report 2010-11Schedule forming part of <strong>the</strong> Profit and Loss AccountUS $ ` US $ `Year to 31.03.2011 Year to 31.03.2011 Year to 31.03.2010 Year to 31.03.2010SCHEDULE ‘L’O<strong>the</strong>r IncomeSale of Scraps 83,963 3,832,071 - -Profit on Sale of Assets (Net) 77,377 3,531,486 187,412 8,885,203[Gross - Tax deducted at source Nil(Previous Year Nil)]- On deposit with Banks and O<strong>the</strong>rs 504,285 23,015,567 18,475 875,900Miscellaneous Income 80,946 3,694,375 332,883 15,781,983Total 746,571 34,073,500 538,770 25,543,086US $ ` US $ `Year to 31.03.2011 Year to 31.03.2011 Year to 31.03.2010 Year to 31.03.2010SCHEDULE ‘M’Cost of Materials and Direct Manufacturing ExpensesOpening StockStock in Trade 4,869,842 222,259,589 4,300,108 203,868,120Add : Purchases 475,633 21,707,890 5,046,923 239,274,6195,345,475 243,967,479 9,347,031 443,142,740Less : Closing StockStock in Trade 4,378,962 199,855,826 4,869,842 230,879,209966,513 44,111,653 4,477,189 212,263,530Add : Work-in-Progress on 01.04.2010 322,708 14,728,393 41,190 1,952,8181,289,221 58,840,046 4,518,379 214,216,348Less : Work-in-Progress on 31.03.2011 5,730 261,517 322,708 15,299,5861,283,491 58,578,529 4,195,671 198,916,762Carriage Inward 512,536 23,392,143 410,685 19,470,576Total 1,796,027 81,970,672 4,606,356 218,387,338
146Schedule forming part of <strong>the</strong> Profit and Loss Account (Contd.)US $ ` US $ `Year to 31.03.2011 Year to 31.03.2011 Year to 31.03.2010 Year to 31.03.2010SCHEDULE ‘N’ExpensesSalaries , Wages , Bonus etc 1,773,839 80,958,012 2,028,821 96,186,404Contribution to Provident and o<strong>the</strong>r Funds 15,044 686,608 13,096 620,881Staff Welfare Expenses 148,565 6,780,507 128,329 6,084,078Rent (Net) 151,415 6,910,581 156,373 7,413,644Rates and Taxes 4,084 186,394 316,709 15,015,174Bank Charges 21,269 970,717 17,977 852,290Insurance 66,752 3,046,561 58,356 2,766,658Repairs and Maintenance :Buildings 83,404 3,806,559 75,862 3,596,617Plant and Machinery 189,801 8,662,518 192,167 9,110,637O<strong>the</strong>r Assets 72,506 3,309,174 24,279 1,151,067345,711 15,778,250 292,308 13,858,322Travelling Expenses 442,537 20,197,389 338,169 16,032,592Stationery and Printing 24,355 1,111,562 18,577 880,736Postage,Telephones and o<strong>the</strong>r Communication118,975 5,430,019 88,284 4,185,544ExpensesAdvertising 95,412 4,354,604 85,334 4,045,685Gas and Electricity 67,754 3,092,293 102,792 4,873,369Commission 123,329 5,628,736 565,745 26,821,970Miscellaneous Expenses 444,750 20,298,390 279,974 13,273,567Medical Expenses 96,719 4,414,255 43,646 2,069,257Professional Fees 113,673 5,188,036 326,621 15,485,102Motor Car and Van Expenses 220,563 10,066,495 152,820 7,245,196Service Support Expenses 180,059 8,217,893 218,803 10,373,450Debts/Advances/Claims written off 91,362 4,169,762 45,210 2,143,406Total 4,546,167 207,487,062 5,277,944 250,227,325US $ ` US $ `Year to 31.03.2011 Year to 31.03.2011 Year to 31.03.2010 Year to 31.03.2011SCHEDULE ‘O’Sales and Service GrossPrime Product 1,622,803 74,064,729 485,550 23,019,926Spareparts and Accessories 2,560,628 116,867,062 7,794,449 369,534,827Services 2,041,745 93,185,242 1,284,371 60,892,029Total 6,225,176 284,117,033 9,564,370 453,446,782
Over<strong>view</strong> Performance Re<strong>view</strong>s Governance Financials147Annual Report 2010-11Notes to <strong>the</strong> Financial Statements1. CORPORATE INFORMATIONThe financial statements of Myanmar Tractors Limited for <strong>the</strong> year ended 31st March, 2011 were authorized for issue in accordance with resolution of <strong>the</strong>Directors on 28th April, 2011. Myanmar Tractors Limited is a limited liability company which is in incorporated in Union of Myanmar, is a 81 % ownedsubsidiary of TIL Limited, which is <strong>the</strong> ultimate holding company.Business of MTL in Myanmar is now done jointly by Myanmar Tractors Ltd. and TIL Overseas Pte Ltd. (a group company registered in Singapore - owned100 % by TIL Ltd.).The registered office of Myanmar Tractors Limited is located at No 16 , Mya Mar Lar Lane, Industrial Zone, Thaketa Township, Yangon, Myanmar.The principal activities of <strong>the</strong> company are to carry out <strong>the</strong> business of Earthmoving and related Equipment, Generator Sets, Spare parts and providingservice for <strong>the</strong> Equipments and to operate Rental fleet of Earthmoving Equipment and Generator Sets.The company operates in Myanmar and employed 305 employees as of 31st March, 2011. The employee cost of <strong>the</strong> company for <strong>the</strong> year ended 31stMarch, 2011 amounted to USD 2,034,167.(YE 2010: USD 2,213,891)2. SUMMARY OF SIGNIFICANT ACCOUNTING POLICIES(a) Basis of preparationThe financial statements of <strong>the</strong> company have been prepared in accordance with generally accepted accounting principals in Myanmar.The financial statements have been prepared on a historical cost basis.The accounting policies have been consistently applied by <strong>the</strong> company and, are consistent with those used in <strong>the</strong> previous year.The financial statements are presented in United States dollars ( USD or US$ ).(b)(c)Foreign currency translationTransactions arising in currencies o<strong>the</strong>r than United States dollars during <strong>the</strong> year are translated at rates closely approximating those ruling on<strong>the</strong> transaction dates including monetary assets and liabilities. All exchange differences arising from translation are included in <strong>the</strong> profit and lossaccount.Property & equipmentCost and valuationAll items of property and equipment are stated at costs less accumulated depreciation. The cost of an asset comprises its purchase price and anydirectly attributable costs of bringing <strong>the</strong> asset to working condition for its intended use. Expenditure for additions, improvements and renewalsare capitalized. Expenditure for maintenance and repairs are charged to <strong>the</strong> profit and loss account. When assets are sold or retired, <strong>the</strong>ir cost andaccumulated depreciation are removed from <strong>the</strong> accounts and any gain or loss resulting from <strong>the</strong>ir disposal is included in <strong>the</strong> profit and loss account.DepreciationDepreciation is charged to <strong>the</strong> statement of income on a straight line method to write off <strong>the</strong> cost of fixed assets over <strong>the</strong>ir estimated useful lives.The estimated useful lives of fixed assets are as follows:-Nature of <strong>the</strong> AssetEstimate Useful LifeOffice equipment5 yearsMotor vehicles & motor cycle5 yearsOffice Furniture & fittings5 yearsComputer Heardware4 yearsComputer Software4 yearsTools4 yearsRental Machine5 years
148Notes to <strong>the</strong> Financial Statements (Contd.)Fully depreciated assets are retained in <strong>the</strong> accounts un<strong>til</strong> <strong>the</strong>y are no longer in use and no fur<strong>the</strong>r charge for depreciation is made in respect of<strong>the</strong>se assets.Amortization of Development of Leased AssetsDepreciation of leased Assets were amortized over five year.(d) Revenue recognitionSaleRevenue from sales/services/rental(exclusive of commercial tax) is being recognized on accrual basis in keeping with related arrangements withcustomer and is net of credit notes.(e) Employees’ Retiral Benefit SchemeThe company announced a comprehensive retirement benefit scheme for all employees in <strong>the</strong> past year (2009-10), with retrospective effect, from<strong>the</strong> date joining by individual employees. To maintain prudent accounting practice, Board approved an expenditure and a provision in <strong>the</strong> accountfor <strong>the</strong> 2009-10 and 2010-11, which covers <strong>the</strong> accumulated liabilities of <strong>the</strong> company up to 31st March, 2011 as per <strong>the</strong> announced Policy.(f)TaxationTaxation is provide in <strong>the</strong> Accounts as and when <strong>the</strong>y are deducted on receipt and on residual profit, if applicable, as per <strong>the</strong> conventional procedurefollowed in <strong>the</strong> Host Country.3. REGISTERED ADDRESSThe registered address of <strong>the</strong> holding company which is also its ultimate holding company is as follows:-TIL LTD,1, Taratolla RoadGarden ReachKolkata – 700024, India.4. COMPARISON OF LAST YEAR FIGURESLast year figures were regrouped wherever necessary.
Over<strong>view</strong> Performance Re<strong>view</strong>s Governance Financials149Annual Report 2010-11Til Overseas Pte Ltd (Incorporated in Singapore)10 th ANNUAL REPORT 2010-11GENERAL INFORMATIONDIRECTORSMr. Avijit MazumdarMr. Sumit MazumderMr. Shyamal BandopadhyayMr. Arangannal s/o KathamuthuMr. Aloke Banerjee (appointed on 20th August, 2010)COMPANY SECRETARYMr. Cheng Lian SiangREGISTERED OFFICE3 Phillip Street#18-00 Commerce PointSingapore 048693INDEPENDENT AUDITORShanker Iyer & Co.
150Directors’ ReportThe directors present <strong>the</strong>ir report to <strong>the</strong> member toge<strong>the</strong>r with <strong>the</strong> audited financial statements of <strong>the</strong> company for <strong>the</strong> financial year ended 31st March, 2011.DIRECTORSThe directors of <strong>the</strong> company in office at <strong>the</strong> date of this report are:Mr. Avijit MazumdarMr. Sumit MazumderMr. Shyamal BandopadhyayMr. Arangannal s/o KathamuthuMr. Aloke Banerjee (appointed on 20th August, 2010)ARRANGEMENTS TO ENABLE DIRECTORS TO ACQUIRE SHARES AND DEBENTURESNei<strong>the</strong>r at <strong>the</strong> end of nor at any time during <strong>the</strong> financial year was <strong>the</strong> company a party to any arrangement whose object was to enable <strong>the</strong> directors of <strong>the</strong>company to acquire benefits by means of <strong>the</strong> acquisition of shares in, or debentures of, <strong>the</strong> company or any o<strong>the</strong>r body corporate.DIRECTORS’ INTEREST IN SHARES AND DEBENTURESAccording to <strong>the</strong> register of directors’ shareholdings kept by <strong>the</strong> company for <strong>the</strong> purpose of Section 164 of <strong>the</strong> Singapore Companies Act, Cap. 50, none of <strong>the</strong>directors holding office at <strong>the</strong> end of <strong>the</strong> financial year had any interest in <strong>the</strong> shares of <strong>the</strong> company or its related corporations except as detailed below:Holdings registered in <strong>the</strong> name of directorsAs at 01.04.2010 As at 31.03.2011Immediate and Ultimate Holding companyOrdinary shares of 10 Rupees each fully paidAvijit Mazumdar 724,087 545,301Sumit Mazumder 33,560 24,360Shyamal Bandopadhyay 500 7,593Aloke Banerjee - -None of <strong>the</strong> directors holding office at <strong>the</strong> end of <strong>the</strong> financial year had any interests in <strong>the</strong> debentures of <strong>the</strong> company or its related corporations at beginningand end of <strong>the</strong> financial year.DIRECTORS’ CONTRACTUAL BENEFITSSince <strong>the</strong> end of <strong>the</strong> previous financial year, no director has received or become entitled to receive a benefit which is required to be disclosed under Section201(8) of <strong>the</strong> Singapore Companies Act, by reason of a contract made by <strong>the</strong> company or a related corporation with <strong>the</strong> director or with a firm of which <strong>the</strong>director is a member, or with a company in which <strong>the</strong> director has a substantial financial interest, except for salaries, bonuses and o<strong>the</strong>r benefits as disclosed in<strong>the</strong> financial statements.SHARE OPTIONSThere were no share options granted during <strong>the</strong> financial year to subscribe for unissued shares of <strong>the</strong> company. No shares have been issued during <strong>the</strong> financialyear by virtue of <strong>the</strong> exercise of options to take up unissued shares of <strong>the</strong> company. There were no unissued shares of <strong>the</strong> company under option at <strong>the</strong> end of<strong>the</strong> financial year.INDEPENDENT AUDITORThe independent auditor, Messrs Shanker Iyer & Co., Certified Public Accountants, Singapore, has expressed its willingness to accept re-appointment.On behalf of <strong>the</strong> directorsDate : 26th April, 2011Sumit MazumderVice ChairmanAloke BanerjeeDirector
Over<strong>view</strong> Performance Re<strong>view</strong>s Governance Financials151Annual Report 2010-11Statement By DirectorsIn <strong>the</strong> opinion of <strong>the</strong> directors,(a)(b)<strong>the</strong> accompanying financial statements of <strong>the</strong> company are drawn up so as to give a true and fair <strong>view</strong> of <strong>the</strong> state of affairs of <strong>the</strong> company as at31st March, 2011 and of its results, changes in equity and cash flows for <strong>the</strong> financial year <strong>the</strong>n ended; andat <strong>the</strong> date of this statement <strong>the</strong>re are reasonable grounds to believe that <strong>the</strong> company will be able to pay its debts when <strong>the</strong>y fall due. The board ofdirectors authorized <strong>the</strong>se financial statements for issue on 26th April, 2011.On behalf of <strong>the</strong> directorsSumit MazumderVice ChairmanAloke BanerjeeDirectorDate : 26th April, 2011
152Independent Auditor’s Report To The Member of Til Overseas Pte Ltd (Incorporated In Singapore)We have audited <strong>the</strong> accompanying financial statements of TIL OVERSEAS PTE LTD (<strong>the</strong> “company”) as set out on pages 7 to 38, which comprise <strong>the</strong> statementof financial position as at 31st March, 2011, <strong>the</strong> statement of comprehensive income, statement of changes in equity and statement of cash flows for <strong>the</strong> financialyear <strong>the</strong>n ended, and a summary of significant accounting policies and o<strong>the</strong>r explanatory notes.Management’s Responsibility for <strong>the</strong> Financial StatementsManagement is responsible for <strong>the</strong> preparation of financial statements that give a true and fair <strong>view</strong> in accordance with <strong>the</strong> provisions of <strong>the</strong> Singapore CompaniesAct, Cap. 50 (<strong>the</strong> “Act”) and Singapore Financial Reporting Standards, and for devising and maintaining a system of internal accounting controls sufficient toprovide a reasonable assurance that assets are safeguarded against loss from unauthorized use or disposition; and transactions are properly authorized and that<strong>the</strong>y are recorded as necessary to permit <strong>the</strong> preparation of true and fair statement of comprehensive income and statement of financial position and to maintainaccountability of assets.Auditor’s ResponsibilityOur responsibility is to express an opinion on <strong>the</strong>se financial statements based on our audit. We conducted our audit in accordance with Singapore Standards onAuditing. Those standards require that we comply with ethical requirements and plan and perform <strong>the</strong> audit to obtain reasonable assurance about whe<strong>the</strong>r <strong>the</strong>financial statements are free from material misstatement.An audit involves performing procedures to obtain audit evidence about <strong>the</strong> amounts and disclosures in <strong>the</strong> financial statements. The procedures selected dependon <strong>the</strong> auditor’s judgement, including <strong>the</strong> assessment of <strong>the</strong> risks of material misstatement of <strong>the</strong> financial statements, whe<strong>the</strong>r due to fraud or error. In makingthose risk assessments, <strong>the</strong> auditor considers internal control relevant to <strong>the</strong> entity’s preparation of <strong>the</strong> financial statements that give a true and fair <strong>view</strong> in orderto design audit procedures that are appropriate in <strong>the</strong> circumstances, but not for <strong>the</strong> purpose of expressing an opinion on <strong>the</strong> effectiveness of <strong>the</strong> entity’s internalcontrol. An audit also includes evaluating <strong>the</strong> appropriateness of accounting policies used and <strong>the</strong> reasonableness of accounting estimates made by management,as well as evaluating <strong>the</strong> overall presentation of <strong>the</strong> financial statements.We believe that <strong>the</strong> audit evidence we have obtained is sufficient and appropriate to provide a basis for our audit opinion.OpinionIn our opinion, <strong>the</strong> financial statements are properly drawn up in accordance with <strong>the</strong> provisions of <strong>the</strong> Act and Singapore Financial Reporting Standards so asto give a true and fair <strong>view</strong> of <strong>the</strong> state of affairs of <strong>the</strong> company as at 31st March, 2011 and of its results, changes in equity and cash flows of <strong>the</strong> company for<strong>the</strong> financial year ended on that date.Report on O<strong>the</strong>r Legal and Regulatory RequirementsIn our opinion, <strong>the</strong> accounting and o<strong>the</strong>r records required by <strong>the</strong> Act to be kept by <strong>the</strong> company have been properly kept in accordance with <strong>the</strong> provisions of<strong>the</strong> Act.On behalf of <strong>the</strong> directorsPlace : SingaporeDate : 26th April, 2011SHANKER IYER & CO.Public Accountants And Certified Public Accountants
Over<strong>view</strong> Performance Re<strong>view</strong>s Governance Financials153Annual Report 2010-11Balance Sheet as at 31st March, 2011USD ` USD `Note 2010-11 2010-11 2009-10 2009-10CURRENT ASSETSCash and cash equivalents 4 9,859,828 449,706,755 7,734,099 366,673,634Trade Receivables 5 3,607,448 164,535,703 2,837,360 134,519,238O<strong>the</strong>r Receivables 6 149,522 6,819,698 166,049 7,872,383Inventories 7 5,224,321 238,281,281 4,772,931 226,284,65918,841,119 859,343,438 15,510,439 735,349,913NON CURRENT ASSETSPlant & Equipment 8 57,958 2,643,464 26,495 1,256,128Available for resale financial assets 9 2,068,848 94,360,157 2,062,069 97,762,6912,126,806 97,003,622 2,088,564 99,018,819Total Assets 20,967,925 956,347,059 17,599,003 834,368,732CURRENT LIABILITIESTrade Payables 10 2,296,554 104,745,828 3,767,212 178,603,521O<strong>the</strong>r Payables 11 6,392,691 291,570,637 3,415,910 161,948,293Provision For Taxation 360,000 16,419,600 372,000 17,636,5209,049,245 412,736,064 7,555,122 358,188,334Non Current Liability 12 3,250 148,233 3,000 142,230Total Liabilities 9,052,495 412,884,297 7,558,122 358,330,564Net Assets 11,915,430 543,462,762 10,040,881 476,038,168SHAREHOLDER’S EQUITYShare Capital 13 708,012 32,292,427 708,012 33,566,849Reserves 14 11,207,418 511,170,335 9,332,869 442,471,31911,915,430 543,462,762 10,040,881 476,038,168* The annexed Notes form an integral part of and should be read in conjunction with <strong>the</strong>se financial statements.Income Statement for <strong>the</strong> year ended 31st March, 2011USD ` USD `Note 2010-11 2010-11 2009-10 2009-10REVENUESale of Goods 51,872,885 2,365,922,285 33,222,844 1,575,095,034O<strong>the</strong>r Income 15 189,579 8,646,698 926,743 43,936,886Total Revenue 52,062,464 2,374,568,983 34,149,587 1,619,031,920COSTS AND EXPENSESPurchases Consumed 16 46,570,118 2,124,063,082 29,930,156 1,418,988,696Warranty Expenses 1,135,970 51,811,592 1,120,062 53,102,139Depreciation of plant & equipment 8 13,991 638,130 14,963 709,396O<strong>the</strong>r Operating Expenses 17 2,018,260 92,052,839 722,232 34,241,019Employee benefits expenses 90,486 4,127,066 55,831 2,646,948Finance cost 2,619 119,453 3,728 176,744Total Costs and Expenses 49,831,444 2,272,812,161 31,846,972 1,509,864,943Profit Before Taxation 2,231,020 101,756,822 2,302,615 109,166,977Taxation 18 (363,250) (16,567,833) (371,374) (17,606,841)Net Profit 19 1,867,770 85,188,990 1,931,241 91,560,136O<strong>the</strong>r Comprehensive IncomeFair value gain available- for sale financial assets 6,779 309,190 142,292 6,746,064O<strong>the</strong>r Comprehensive Income for <strong>the</strong> year, net of tax 6,779 309,190 142,292 6,746,064Total Comprehensive Income for <strong>the</strong> year 1,874,549 85,498,180 2,073,533 98,306,200* The annexed Notes form an integral part of and should be read in conjunction with <strong>the</strong>se financial statements.
154Statement of Changes In Shareholder’s Equity for <strong>the</strong> year ended 31st March, 2011Share CapitalFair valuereserveCurrencytranslationreserveRetained profits2011Balance as at 1st April, 2010 US$ 708,012 590,957 (3,457) 8,745,369 10,040,881` 32,292,427 26,953,549 (157,674) 398,876,280 457,964,582Total Comprehensive income for <strong>the</strong> year US$ - 6,779 - 1,867,770 1,874,549` - 309,190 - 85,188,990 85,498,180Balance as at 31st March, 2011 US$ 708,012 597,736 (3,457) 10,613,139 11,915,430` 32,292,427 27,262,739 (157,674) 484,065,270 543,462,7622010Share CapitalFair valuereserveCurrencytranslationreserveRetained profitsBalance as at 1st April, 2009 US$ 708,012 448,665 (3,457) 6,814,128 7,967,348` 33,566,849 21,271,208 (163,896) 323,057,808 377,731,969Total Comprehensive income for <strong>the</strong> year US$ - 142,292 - 1,931,241 2,073,533` - 6,746,064 - 91,560,136 98,306,200Balance as at 31st March, 2010 US$ 708,012 590,957 (3,457) 8,745,369 10,040,881` 33,566,849 28,017,271 (163,896) 414,617,944 476,038,168* The annexed Notes form an integral part of and should be read in conjunction with <strong>the</strong>se financial statements.TotalTotal
Over<strong>view</strong> Performance Re<strong>view</strong>s Governance Financials155Annual Report 2010-11Cash Flow Statement for <strong>the</strong> year ended 31st March, 2011Note 2010-11 2010-11 2009-10 2009-10US$ ` US$ `OPERATING ACTIVITIESProfit before Income Taxation 2,231,020 101,756,822 2,302,615 109,166,977Adjustments forDepreciation on Plant & Equipment 8 13,991 638,130 14,963 709,396Loss on disposal of Plant & Equipment 17 - - 2,685 127,296Gain on disposal of Plant & Equipment 15 - - (3,507) (166,267)(Reversal)/Provision for slow moving inventories 7 114,306 5,213,497 (279,375) (13,245,169)Interest Income 15 (170,049) (7,755,935) (343,727) (16,296,097)Interest Expenses 2,619 119,453 3,728 176,744Cash flows generated from operations before changes in2,191,887 99,971,966 1,697,382 80,472,881working capitalChanges in Working CapitalTrade receivables (770,088) (35,123,714) (1,941,900) (92,065,479)O<strong>the</strong>r receivables 3,354 152,976 (77,459) (3,672,331)Inventories, at cost (565,696) (25,801,395) (1,781,150) (84,444,322)Trade payables (1,470,658) (67,076,711) 2,615,409 123,996,541O<strong>the</strong>r Payables 4,645,872 211,898,222 269,154 12,760,591Cash generated from operating activities 4,034,671 184,021,344 781,436 37,047,881Interest received 183,222 8,356,755 382,053 18,113,133Interest paid (2,619) (119,453) (3,728) (176,744)Income Tax paid (375,000) (17,103,750) (294,845) (13,978,601)Net Cash generated from operating activities 3,840,274 175,154,897 864,916 41,005,668CASH FLOWS FROM INVESTING ACITIVITIESPurchase of Plant & Equipments 8 (45,635) (2,081,412) (316) (14,982)Proceeds from sale of Plant & Equipments 181 8,255 21,457 1,017,276Withdrawal/(Placement) of Fixed Deposits 6,727,873 306,858,288 472,127 22,383,541Net Cash generated Investing activities 6,682,419 304,785,131 493,268 23,385,836CASH FLOWS FROM FINANCING ACTIVITYAdvance from (Repayment to) holding company 449,640 20,508,080 (3,281,498) (155,575,820)Advances from related company (2,118,731) (96,635,321) 2,601,359 123,330,430Addition of pledged deposits 4 (756,930) (34,523,577) (193,762) (9,186,256)Net Cash used in Financing activities (2,426,021) (110,650,818) (873,901) (41,431,646)Net(decrease)/increase in cash & cash Equivalents 8,096,672 369,289,210 484,283 22,959,857Cash and Cash Equivalents at <strong>the</strong> beginning of <strong>the</strong> year 812,464 37,056,483 328,181 15,559,061Cash and Cash Equivalents at <strong>the</strong> end of <strong>the</strong> year 4 8,909,136 406,345,693 812,464 38,518,919* The annexed Notes form an integral part of and should be read in conjunction with <strong>the</strong>se financial statements.
156Notes to <strong>the</strong> Financial Statements for <strong>the</strong> Financial year ended 31st March, 20111. GENERAL INFORMATIONTIL Overseas Pte Ltd (company Registration No. 200104404H) is domiciled in Singapore. The company’s principal place of business is at 11 Tractor Road,Singapore 627972. The company’s registered office is at 3 Phillip Street, #18-00 Commerce Point, Singapore 048693.The principal activities of <strong>the</strong> company are to carry on <strong>the</strong> business of importers and exporters of equipment and machinery parts in relation to <strong>the</strong>construction industry. There have been no significant changes in <strong>the</strong> nature of <strong>the</strong>se activities during <strong>the</strong> financial year.The financial statements of <strong>the</strong> company as at 31st March, 2011 were authorized and approved by <strong>the</strong> directors for issuance on 26th April, 2011.2. SIGNIFICANT ACCOUNTING POLICIESa) Basis of preparationThe financial statements have been prepared in accordance with Singapore Financial Reporting Standards (“FRS”). The financial statements, which areexpressed in United States dollars, are prepared in accordance with <strong>the</strong> historical cost convention, except as disclosed in <strong>the</strong> accounting policies below.In <strong>the</strong> current financial year, <strong>the</strong> company has adopted all <strong>the</strong> new and revised FRSs and Interpretations of FRS (“INT FRS”) that are mandatory forapplication from that date. The adoption of <strong>the</strong>se new and revised FRSs and INT FRSs have no material effect on <strong>the</strong> financial statements.At <strong>the</strong> date of authorization of <strong>the</strong>se financial statements, <strong>the</strong> company has not applied those FRSs and INT FRSs that have been issued but areeffective only in next financial year. The company expects <strong>the</strong> adoption of <strong>the</strong> standards will have no financial effect on <strong>the</strong> financial statements in<strong>the</strong> period of initial application.During <strong>the</strong> financial year, <strong>the</strong> company has changed <strong>the</strong> accounting policy of inventory valuation method from first in first out basis to weighted averagebasis to align its policy with that of its holding company. However, <strong>the</strong>re is no retrospective application to <strong>the</strong> comparatives as <strong>the</strong> management hasdetermined that it is impracticable to do so in accordance with FRS 8 : Accounting Policies, Changes in Accounting Estimates and Errors.b) Currency translationThe financial statements of <strong>the</strong> company are measured and presented in <strong>the</strong> currency of <strong>the</strong> primary economic environment in which <strong>the</strong> entityoperates (its functional currency). The financial statements of <strong>the</strong> company are presented in United States dollars, which is <strong>the</strong> functional currencyof <strong>the</strong> company.In preparing <strong>the</strong> financial statements of <strong>the</strong> company, monetary assets and liabilities in foreign currencies are translated into United States dollars atrates of exchange closely approximating to those ruling at <strong>the</strong> end of <strong>the</strong> reporting period and transactions in foreign currencies during <strong>the</strong> financialyear are translated at rates ruling on transaction dates. Non-monetary items carried at fair value that are denominated in foreign currencies areretranslated at <strong>the</strong> rates prevailing on <strong>the</strong> date when <strong>the</strong> fair value was determined. Non-monetary items that are measured in terms of historicalcost in a foreign currency are not retranslated.Exchange differences arising on <strong>the</strong> settlement of monetary items, and on retranslation of monetary items are included in <strong>the</strong> statement ofcomprehensive income for <strong>the</strong> year. Exchange differences arising on <strong>the</strong> retranslation of non-monetary items carried at fair value are included in <strong>the</strong>statement of comprehensive income for <strong>the</strong> year except for differences arising on <strong>the</strong> retranslation of non-monetary items in respect of which gainsand losses are recognized directly in o<strong>the</strong>r comprehensive income. For such non-monetary items, any exchange component of that gain or loss isalso recognized directly in o<strong>the</strong>r comprehensive incomec) Cash and cash equivalentsFor <strong>the</strong> purpose of presentation in <strong>the</strong> statement of cash flows, cash and cash equivalents include cash at bank and fixed deposit which are subjectto an insignificant risk of change in value.d) Financial assets(i) ClassificationThe company classifies its financial assets in <strong>the</strong> following categories: “loans and receivables” and “financial assets, available-for-sale”.The classification depends on <strong>the</strong> nature of <strong>the</strong> asset and <strong>the</strong> purpose for which <strong>the</strong> assets were acquired. Management determines <strong>the</strong>classification of its financial assets at initial recognition.Loans and receivablesLoans and receivables are non-derivative financial assets with fixed or determinable payments that are not quoted in an active market. Theyare presented as current assets, except for those maturing later than 12 months after <strong>the</strong> end of <strong>the</strong> reporting period which are presented asnon-current assets. Loans and receivables are presented as “cash and cash equivalents”, “trade receivables” and “o<strong>the</strong>r receivables” on <strong>the</strong>statement of financial position.
Over<strong>view</strong> Performance Re<strong>view</strong>s Governance Financials157Annual Report 2010-11Notes to <strong>the</strong> Financial Statements for <strong>the</strong> Financial year ended 31st March, 2011Financial assets, available-for-saleFinancial assets, available-for-sale are non-derivatives that are ei<strong>the</strong>r designated in this category or not classified in any of <strong>the</strong> o<strong>the</strong>r categories. Theyare presented as non-current assets unless management intends to dispose of <strong>the</strong> assets within 12 months after <strong>the</strong> end of <strong>the</strong> reporting period.(ii) Effective interest methodThe effective interest method is a method of calculating <strong>the</strong> amortized cost of a financial instrument and of allocating interest income orexpense over <strong>the</strong> relevant period. The effective interest rate is <strong>the</strong> rate that exactly discounts estimated future cash receipts or paymentsthrough <strong>the</strong> expected life of <strong>the</strong> financial instrument, or where appropriate, a shorter period.(iii) Recognition and derecognitionRegular way of purchases and sales of financial assets are recognized on trade-date – <strong>the</strong> date on which <strong>the</strong> company commits to purchaseor sell <strong>the</strong> asset.Financial assets are derecognized when <strong>the</strong> rights to receive cash flows from <strong>the</strong> financial assets have expired or have been transferred and<strong>the</strong> company has transferred substantially all risks and rewards of ownership. On disposal of a financial asset, <strong>the</strong> difference between <strong>the</strong>carrying amount and <strong>the</strong> sale proceeds is recognized in <strong>the</strong> statement of comprehensive income. Any amount in <strong>the</strong> fair value reserve relatingto that asset is transferred to <strong>the</strong> statement of comprehensive income.(iv) Initial measurementFinancial assets are initially recognized at fair value plus transaction costs.(v)Subsequent measurementLoans and receivables are subsequently carried at amortized cost using <strong>the</strong> effective interest method less allowance for impairment. Foravailable–for-sale financial assets are subsequently carried at fair value, changes in <strong>the</strong> fair value are recognized in <strong>the</strong> fair value reserve.Interest and dividend income on financial assets, available–for-sale are recognized separately in <strong>the</strong> statement of comprehensive income.Change in <strong>the</strong> fair values of available–for-sale debt securities (i.e. monetary items) denominated in foreign currencies are analysed into currencytranslation differences on <strong>the</strong> amortized cost of <strong>the</strong> securities and o<strong>the</strong>r changes.; <strong>the</strong> currency translation differences are recognized in <strong>the</strong>statement of comprehensive income and o<strong>the</strong>r changes are recognized in <strong>the</strong> fair value reserve. Changs in fair valus of available-for-sale equitysecurities (i.e non-menetary)are recognized in <strong>the</strong> fair value reserve, toge<strong>the</strong>r with <strong>the</strong> related currency translation differences.(vi)ImpairmentThe company assesses at <strong>the</strong> end of each reporting period whe<strong>the</strong>r <strong>the</strong>re is abjective evidence that a financial asset or a group of financial assetsis impaired and recognizes an allowance for impairment when such evidence arises.Loans and receivablesSignificant financial difficulties of <strong>the</strong> debtor, probability that debtor will enter bankruptcy, and default or significant delays in payments areobjective evidence that <strong>the</strong>se financial assets are impaired.The carrying amount of <strong>the</strong>se assets is reduced through <strong>the</strong> use of an impairment allowance account which is calculated as <strong>the</strong> differencebetween <strong>the</strong> carrying amount and <strong>the</strong> present value of estimated future cash flows, discounted at <strong>the</strong> original effective interest rate. When<strong>the</strong> asset becomes uncollectible, it is written off against <strong>the</strong> allowance account. Subsequent recoveries of amounts previously written off arerecognized against <strong>the</strong> same line item in <strong>the</strong> statement of comprehensive income.The allowance for impairment loss account is reduced through <strong>the</strong> statement of comprehensive income in a subsequent period when <strong>the</strong>amount of impairment loss decreases and <strong>the</strong> related decrease can be objectively measured. The carrying amount of <strong>the</strong> asset previouslyimpaired is increased to <strong>the</strong> extent that <strong>the</strong> new carrying amount does not exceed <strong>the</strong> amortized cost had no impairment been recognized inprior periods.Financial assets, available-for-saleSignificant or prolonged decline in <strong>the</strong> fair value of an equity security below its cost and <strong>the</strong> disappearance of an active trading market for <strong>the</strong>security are considered as indicators that <strong>the</strong> available-for-sale financial asset has been impaired.If any evidence of impairment exists, <strong>the</strong> cumulative loss that was recognized in <strong>the</strong> fair value reserve is reclassified to <strong>the</strong> statement ofcomprehensive income. The cumulative loss is measured as <strong>the</strong> difference between <strong>the</strong> acquisition cost (net of any principal repayments andamortisation) and <strong>the</strong> current fair value, less any impairment loss previously recognized as an expense in <strong>the</strong> statement of comprehensiveincome. The impairment losses recognized as an expense on equity securities are not reversed through <strong>the</strong> statement of comprehensive income.
158Notes to <strong>the</strong> Financial Statements for <strong>the</strong> Financial year ended 31st March, 2011e) InventoriesInventories are stated at <strong>the</strong> lower of cost and net realisable value. Cost is determined using <strong>the</strong> weighted average method. The cost of inventoriescomprises all cost of purchase and o<strong>the</strong>r costs incurred in bringing <strong>the</strong> inventories to <strong>the</strong>ir present location and condition. Net realisable value is <strong>the</strong>price at which <strong>the</strong> inventories can be realized in <strong>the</strong> normal course of business after allowing for <strong>the</strong> costs of realization.f) Plant and equipment(i) MeasurementPlant and equipment are initially recognized at cost and subsequently carried at cost less accumulated depreciation and accumulatedimpairment losses.Components of costsThe cost of an item of plant and equipment initially recognized includes its purchase price and any cost that is directly attributable to bringing<strong>the</strong> asset to <strong>the</strong> location and condition necessary for it to be capable of operating in <strong>the</strong> manner intended by management.(ii)DepreciationDepreciation on plant and equipment is calculated using <strong>the</strong> straight-line method to allocate <strong>the</strong>ir depreciable amounts over <strong>the</strong>ir estimateduseful lives as follows:Computers 25%Furniture and fittings 20%Office equipment 25%Motor vehicle 20%The residual values, estimated useful lives and depreciation method of plant and equipment are re<strong>view</strong>ed, and adjusted as appropriate, at <strong>the</strong>end of each reporting period. The effects of any revision are recognized in <strong>the</strong> statement of comprehensive income when <strong>the</strong> changes arise.(iii) Subsequent expenditureSubsequent expenditure relating to plant and equipment that has already been recognized is added to <strong>the</strong> carrying amount of <strong>the</strong> asset onlywhen it is probable that future economic benefits associated with <strong>the</strong> item will flow to <strong>the</strong> company and <strong>the</strong> cost of <strong>the</strong> item can be measuredreliably. All o<strong>the</strong>r repair and maintenance expenses are recognized in <strong>the</strong> statement of comprehensive income when incurred.(iv) DisposalOn disposal of an item of property, plant and equipment, <strong>the</strong> difference between <strong>the</strong> disposal proceeds and its carrying amount is recognized in<strong>the</strong> statement of comprehensive income. Any revaluation reserves relating to <strong>the</strong> asset are transferred to retained profits directly.g) Impairment of non-financial assetsPlant and equipmentPlant and equipment are tested for impairment whenever <strong>the</strong>re is any objective evidence or indication that <strong>the</strong>se assets may be impaired.For <strong>the</strong> purpose of impairment testing, <strong>the</strong> recoverable amount (i.e. <strong>the</strong> higher of <strong>the</strong> fair value less cost to sell and <strong>the</strong> value-in-use) is determinedon an individual asset basis unless <strong>the</strong> asset does not generate cash inflows that are largely independent of those from o<strong>the</strong>r assets. If this is <strong>the</strong>case, <strong>the</strong> recoverable amount is determined for <strong>the</strong> cash generating unit (“CGU”) to which <strong>the</strong> asset belongs.If <strong>the</strong> recoverable amount of <strong>the</strong> asset (or CGU) is estimated to be less than its carrying amount, <strong>the</strong> carrying amount of <strong>the</strong> asset (or CGU) is reducedto its recoverable amount.The difference between <strong>the</strong> carrying amount and recoverable amount is recognized as an impairment loss in <strong>the</strong> statement of comprehensiveincome, unless <strong>the</strong> asset is carried at revalued amount, in which case, such impairment loss is treated as a revaluation decrease. An impairmentloss for an asset is reversed if, and only if, <strong>the</strong>re has been a change in <strong>the</strong> estimates used to determine <strong>the</strong> asset’s recoverable amount since <strong>the</strong> lastimpairment loss was recognized.The carrying amount of an asset is increased to its revised recoverable amount, provided that this amount does not exceed <strong>the</strong> carrying amount thatwould have been determined (net of any accumulated amortisation or depreciation) had no impairment loss been recognized for <strong>the</strong> asset in prior years.A reversal of impairment loss for an asset is recognized in <strong>the</strong> statement of comprehensive income, unless <strong>the</strong> asset is carried at revalued amount,in which case, such reversal is treated as a revaluation increase. However, to <strong>the</strong> extent that an impairment loss on <strong>the</strong> same revalued asset waspreviously recognized as an expense in <strong>the</strong> statement of comprehensive income, a reversal of that impairment is also credited to <strong>the</strong> statement ofcomprehensive income.
Over<strong>view</strong> Performance Re<strong>view</strong>s Governance Financials159Annual Report 2010-11Notes to <strong>the</strong> Financial Statements for <strong>the</strong> Financial year ended 31st March, 2011h) Trade and o<strong>the</strong>r payablesTrade and o<strong>the</strong>r payables are initially measured at fair value, and subsequently measured at amortized cost, using <strong>the</strong> effective interest rate methodThe company derecognises financial liabilities when, and only when, <strong>the</strong> company’s obligations are discharged, cancelled and expired.i) ProvisionsProvisions are recognized when <strong>the</strong> company has a present obligation (legal or constructive) as a result of past events, and it is probable that anoutflow of resources embodying economic benefits will be required to settle <strong>the</strong> obligation and <strong>the</strong> amount has been reliably estimated.Provisions are re<strong>view</strong>ed at <strong>the</strong> end of each reporting period and adjusted to reflect <strong>the</strong> current best estimation.Provisions are measured at <strong>the</strong> present value of <strong>the</strong> expenditure expected to be required to settle <strong>the</strong> obligation using a pre-tax discount rate thatreflects <strong>the</strong> current market assessment of <strong>the</strong> time value of money and <strong>the</strong> risks specific to <strong>the</strong> obligation. The increase in <strong>the</strong> provision due to <strong>the</strong>passage of time is recognized in <strong>the</strong> statement of comprehensive income as finance expense.Changes in <strong>the</strong> estimated timing or amount of <strong>the</strong> expenditure or discount rate are recognized in <strong>the</strong> statement of comprehensive income when <strong>the</strong>changes arise.j) Operating leasesThe company leases office space under operating leases from non-related parties. Leases of office where substantially all risks and rewardsincidental to ownership are retained by <strong>the</strong> lessors are classified as operating leases. Payments made under operating leases (net of any incentivesreceived from <strong>the</strong> lessors) are recognized in <strong>the</strong> statement of comprehensive income on a straight-line basis over <strong>the</strong> period of <strong>the</strong> lease.k) Share capitalOrdinary shares are classified as equity. Incremental costs directly attributable to <strong>the</strong> issuance of new ordinary shares are deducted against <strong>the</strong> sharecapital account.l) Revenue recognitionSales comprise <strong>the</strong> fair value of <strong>the</strong> consideration received or receivable for <strong>the</strong> sale of goods and rendering of services in <strong>the</strong> ordinary course of <strong>the</strong>company’s activities. Sales are presented, net of goods and services tax, rebates and discounts.The company recognises revenue when <strong>the</strong> amount of revenue and related cost can be reliably measured, it is probable that <strong>the</strong> collectibility of <strong>the</strong>related receivables is reasonably assured and when <strong>the</strong> specific criteria for each of <strong>the</strong> company’s activities are met as follows:(i) Revenue from <strong>the</strong> sale of goods is recognized upon passage of title to <strong>the</strong> customer, which generally coincides with <strong>the</strong>ir delivery andacceptance.(ii) Commission income is recognized upon provision of <strong>the</strong> services.(iii) Interest income is recognized on a time apportioned basis.m) Income taxIncome tax for current and prior periods is recognized at <strong>the</strong> amount expected to be paid to or recovered from <strong>the</strong> tax authorities, using <strong>the</strong> tax ratesand tax laws that have been enacted or substantively enacted by <strong>the</strong> end of <strong>the</strong> reporting period.Deferred income tax is recognized for all temporary differences arising between <strong>the</strong> tax bases of assets and liabilities and <strong>the</strong>ir carrying amounts in<strong>the</strong> financial statements.A deferred income tax liability is recognized for all taxable temporary differences.A deferred income tax asset is recognized to <strong>the</strong> extent that it is probable that future taxable profit will be available against which <strong>the</strong> deductibletemporary differences and tax losses can be u<strong>til</strong>ized.Deferred income tax is measured:(i) at <strong>the</strong> tax rates that are expected to apply when <strong>the</strong> related deferred income tax asset is realized or <strong>the</strong> deferred income tax liability is settled,based on tax rates and tax laws that have been enacted or substantively enacted by <strong>the</strong> end of <strong>the</strong> reporting period; and(ii) based on <strong>the</strong> tax consequence that will follow from <strong>the</strong> manner in which <strong>the</strong> company expects, at <strong>the</strong> end of reporting period, to recover orsettle <strong>the</strong> carrying amounts of its assets and liabilities.Current and deferred income taxes are recognized as income or expense in <strong>the</strong> statement of comprehensive income.n) Employee benefitsEmployee benefits are recognized as an expense, unless <strong>the</strong> cost qualifies to be capitalized as an asset.
160Notes to <strong>the</strong> Financial Statements for <strong>the</strong> Financial year ended 31st March, 2011Defined contribution plansDefined contribution plans are post-employment benefit plans under which <strong>the</strong> company pays fixed contributions into separate entities such as <strong>the</strong>Central Provident Fund on a mandatory, contractual or voluntary basis. The company has no fur<strong>the</strong>r payment obligations once <strong>the</strong> contributions havebeen paid.o) Government grantsJob Credit SchemeCash grants received from <strong>the</strong> government in relation to <strong>the</strong> Job Credit Scheme are recognized as income when <strong>the</strong>re is reasonable assurance that<strong>the</strong> grant will be received.3. CRITICAL ACCOUNTING ESTIMATES, ASSUMPTIONS AND JUDGEMENTSThe presentation of financial statements in conforming with FRS requires <strong>the</strong> use of certain critical accounting estimates, assumptions and judgementsin applying <strong>the</strong> accounting policies. These estimates, assumptions and judgements are continually evaluated and are based on historical experience ando<strong>the</strong>r factors, including expectations of future events that are believed to be reasonable under <strong>the</strong> circumstances. Actual results may differ from <strong>the</strong>seestimates. The following are <strong>the</strong> significant accounting estimates, assumptions and judgements that have <strong>the</strong> most significant effect for preparation offinancial statements:(a)(b)(c)(d)Depreciation of plant and equipmentThe company depreciates <strong>the</strong> plant and equipment, using <strong>the</strong> straight-line method, over <strong>the</strong>ir estimated useful lives after taking into account of<strong>the</strong>ir estimated residual values. The estimated useful life reflects management’s estimate of <strong>the</strong> periods that <strong>the</strong> company intends to derive futureeconomic benefits from <strong>the</strong> use of <strong>the</strong> company’s plant and equipment. The residual values reflect management’s estimated amount that <strong>the</strong>company would currently obtain from disposal of <strong>the</strong> asset, after deducting <strong>the</strong> estimated costs of disposal, as if <strong>the</strong> asset were already of <strong>the</strong> ageand in <strong>the</strong> condition expected at <strong>the</strong> end of its useful life. The carrying amounts of <strong>the</strong> company’s plant and equipment as at <strong>the</strong> end of each reportingperiod were disclosed in Note 8 to <strong>the</strong> financial statements.Impairment of loans and receivablesManagement re<strong>view</strong>s its loans and receivables for objective evidence of impairment at each reporting period. Significant financial difficulties of <strong>the</strong>debtor, <strong>the</strong> probability that <strong>the</strong> debtor will enter bankruptcy, and default or significant delay in payments are considered objective evidence that areceivable is impaired. In determining this, management makes judgement as to whe<strong>the</strong>r <strong>the</strong>re is observable data indicating that <strong>the</strong>re has beena significant change in <strong>the</strong> payment ability of <strong>the</strong> debtor, or whe<strong>the</strong>r <strong>the</strong>re have been significant changes with adverse effect in <strong>the</strong> technological,market, economic or legal environment in which <strong>the</strong> debtor operates in.Where <strong>the</strong>re is objective evidence of impairment, management makes judgements as to whe<strong>the</strong>r an impairment loss should be recorded as anexpense. In determining this, management uses estimates based on historical loss experience for assets with similar credit risk characteristics. Themethodology and assumptions used for estimating both <strong>the</strong> amount and timing of future cash flows are re<strong>view</strong>ed regularly to reduce any differencesbetween <strong>the</strong> estimated loss and actual loss experience.Impairment of financial assets, available-for-saleThe company follows <strong>the</strong> guidance of FRS 39 in determining when an available-for-sale financial asset is considered impaired at least annually. Thisdetermination requires significant judgement.Significant or prolonged declines in <strong>the</strong> fair value of <strong>the</strong> security below its cost and <strong>the</strong> disappearance of an active trading market for <strong>the</strong> securityare considered objective evidence that a financial asset is impaired. In determining this, management evaluates, among o<strong>the</strong>r factors, <strong>the</strong> durationand extent to which <strong>the</strong> fair value of a financial asset is less than its cost, <strong>the</strong> financial health of and <strong>the</strong> near-term business outlook of <strong>the</strong> issuerof <strong>the</strong> instrument, including factors such as industry and sector performance, changes in technology and operational and financing cash flow. Fairvalue gains of US$6,779 (2010 : US$142,292) was transferred for <strong>the</strong> year ended 31st March, 2011 (Note 9).Income taxesJudgement is involved in determining <strong>the</strong> company’s provision for income taxes. The company recognises liabilities for expected tax issues basedon estimates of whe<strong>the</strong>r additional taxes will be due. Where <strong>the</strong> final tax outcome of <strong>the</strong>se matters is different from <strong>the</strong> amounts that were initiallyrecognized, such differences will impact <strong>the</strong> income tax and deferred tax provision in <strong>the</strong> financial year in which such determination is made. At31st March, 2011, <strong>the</strong> carrying amounts of <strong>the</strong> company’s current income tax payable and deferred tax liability are disclosed in <strong>the</strong> statement financialposition.
Over<strong>view</strong> Performance Re<strong>view</strong>s Governance Financials161Annual Report 2010-11Notes to <strong>the</strong> Financial Statements for <strong>the</strong> Financial year ended 31st March, 20114 CASH AND CASH EQUIVALENTSUS$ ` US$ `2010-11 2010-11 2009-10 2009-10Cash at banks 5,859,828 267,266,755 1,006,226 47,705,175Fixed deposits 4,000,000 182,440,000 6,727,873 318,968,4599,859,828 449,706,755 7,734,099 366,673,634The carrying amounts of cash and cash equivalents approximate <strong>the</strong>ir fair values. Fixed deposits had a maturity of 3 months (2010 : 1 year) at weighted averageeffective interest rate of 1.5% (2010 : 2.1%) per annum.Cash and cash equivalents include an amount of US$950,692 (2009 : US$193,762) which is pledged against <strong>the</strong> bank guarantees as disclosed in Note 23.For <strong>the</strong> pupose of cash flow statement, <strong>the</strong> year end cash and cash equivalents comprise <strong>the</strong> following;US$ ` US$ `2010-11 2010-11 2009-10 2009-10Cash at Banks 9,859,828 449,706,755 7,734,099 366,673,634Less: fixed deposits with maturity period more than 3 months - - (6,727,873) (318,968,459)Less: Pledged Deposits(Note 23) (950,692) (43,361,062) (193,762) (9,186,256)Cash & cash equivalents per statement of cash flows 8,909,136 406,345,693 812,464 38,518,918The company’s cash and cash equivalents are denominated in <strong>the</strong> following currencies:US$ ` US$ `2010-11 2010-11 2009-10 2009-10United States dollar 9,745,759 444,504,068 7,525,979 356,806,664Singapore dollar 114,069 5,202,687 208,120 9,866,9699,859,828 449,706,755 7,734,099 366,673,6345 TRADE RECEIVABLESUS$ ` US$ `2010-11 2010-11 2009-10 2009-10Trade debtors 3,202,859 146,082,399 2,547,483 120,776,169GST receivable 404,589 18,453,304 289,877 13,743,0693,607,448 164,535,703 2,837,360 134,519,238Trade receivables are non-interest bearing except for US$658,800 (2010 : US$1,820,000) which bear interest between 10% to 17% (2010 : 10% to 15%)per annum. Credit terms are in accordance with <strong>the</strong> contracts or agreements with <strong>the</strong> customers.Trade receivables are recognized at <strong>the</strong>ir original invoiced amounts which represent <strong>the</strong>ir fair values on initial recognition. The trade receivables areconsidered to be of short duration and are not discounted.The carrying amount of trade receivables approximate <strong>the</strong>ir fair values and are denominated in <strong>the</strong> following currencies:US$ ` US$ `2010-11 2010-11 2009-10 2009-10United States dollar 3,194,571 145,704,383 2,837,360 134,519,238Singapore dollar 412,877 18,831,320 - -3,607,448 164,535,703 2,837,360 134,519,238
162Notes to <strong>the</strong> Financial Statements for <strong>the</strong> Financial year ended 31st March, 20116 OTHER RECEIVABLESUS$ ` US$ `2010-11 2010-11 2009-10 2009-10Interest Receivable 9,667 440,912 22,840 1,082,844Prepayment 8,086 368,802 - -Commission Receivable - - 30,860 1,463,073O<strong>the</strong>r Debtors 7,984 364,150 97,775 4,635,513Advance to Suppliers 123,785 5,645,834 14,574 690,953149,522 6,819,698 166,049 7,872,383The carrying amount of o<strong>the</strong>r receivables approximate <strong>the</strong>ir fair value.The company’s o<strong>the</strong>r receivables are denominated in <strong>the</strong> following currencies:US$ ` US$ `2010-11 2010-11 2009-10 2009-10Euro - - 13,988 663,171United States dollar 140,725 6,418,467 134,088 6,357,112British pound - - 17,973 852,100Singapore dollar 8,797 401,231 - -149,522 6,819,698 166,049 7,872,3837 INVENTORIESUS$2010-11`2010-11US$2009-10`2009-10Machines 3,527,382 160,883,893 1,232,295 58,423,106Engine 345,855 15,774,447 85,904 4,072,709Spare parts 1,034,660 47,190,843 1,150,007 54,521,832Total inventories at cost 4,907,897 223,849,182 2,468,206 117,017,646Stocks in transit 430,730 19,645,595 2,304,725 109,267,012Less: Allowance for slow moving inventories (114,306) (5,213,497) - -5,224,321 238,281,281 4,772,931 226,284,659Allowance for slow moving inventoriesBalance at beginning of <strong>the</strong> year - - 279,375 13,245,169Provision/(Reversal) for slow moving inventories 114,306 5,213,497 (279,375) (13,245,169)114,306 5,213,497 - -The cost of inventories recognized as an expense and included in <strong>the</strong> “purchases consumed” amounts to US$46,570,118 (2010 : US$29,930,156).
Over<strong>view</strong> Performance Re<strong>view</strong>s Governance Financials163Annual Report 2010-11Notes to <strong>the</strong> Financial Statements for <strong>the</strong> Financial year ended 31st March, 20118 PLANT & EQUIPMENTComputers Furniture & Fittings Office Equipment Motor vehicle Total2010-11CostAt 1st April, 2010 US$ 6,793 37,952 2,847 - 47,592` 309,829 1,730,991 129,852 - 2,170,671Additions/(Disposal) US$ 1,706 - (297) 43,929 45,338` 77,811 - (13,546) 2,003,602 2,067,866At 31st March, 2011 US$ 8,499 37,952 2,550 43,929 92,930` 387,639 1,730,991 116,306 2,003,602 4,238,537Accumulated DepreciationAt 1st April, 2010 US$ 5,737 14,142 1,218 - 21,097` 261,665 645,017 55,553 - 962,234Charge for <strong>the</strong> year (Net) US$ 820 7,571 511 5,089 13,991` 37,400 345,313 23,307 232,109 638,130Disposals US$ - - (116) - (116)` - - (5,291) - (5,291)At 31st March, 2011 US$ 6,557 21,713 1,613 5,089 34,972` 299,065 990,330 73,569 232,109 1,595,073Net Book valueAt 31st March, 2011 US$ 1,942 16,239 937 38,840 57,958` 88,575 740,661 42,737 1,771,492 2,643,4642009-10CostAt 1st April, 2009 US$ 11,970 37,636 25,802 - 75,408` 567,498 1,784,323 1,223,273 - 3,575,093Additions/(Disposals) US$ (5,177) 316 (22,955) - (27,816)` (245,442) 14,982 (1,088,297) - (1,318,757)At 31st March, 2010 US$ 6,793 37,952 2,847 - 47,592` 322,056 1,799,304 134,976 - 2,256,337Accumulated DepreciationAt 1st April, 2009 US$ 5,984 6,596 1,051 - 13,631` 283,701 312,716 49,828 - 646,246Charge for <strong>the</strong> year US$ 2,244 7,546 5,173 - 14,963` 106,388 357,756 245,252 - 709,396Disposals US$ (2,491) - (5,006) - (7,497)` (118,098) - (237,334) - (355,433)At 31st March, 2010 US$ 5,737 14,142 1,218 - 21,097` 271,991 670,472 57,745 - 1,000,209Net Book valueAt 31st March, 2010 US$ 1,056 23,810 1,629 - 26,495` 50,065 1,128,832 77,231 - 1,256,128
164Notes to <strong>the</strong> Financial Statements for <strong>the</strong> Financial year ended 31st March, 20119 AVAILABLE FOR RE SALE FINANCIAL ASSETSUS$2010-11`2010-11US$2009-10`2009-10Unquoted equity investmentsAt <strong>the</strong> beginning of <strong>the</strong> year 2,062,069 94,050,967 1,919,777 91,016,628Fair Value gain transferred 6,779 309,190 142,292 6,746,064At end of <strong>the</strong> year 2,068,848 94,360,157 2,062,069 97,762,691The above available-for-sale financial assets represent 19% beneficial interest in Myanmar Tractors Limited, a related company incorporated under <strong>the</strong>laws of Myanmar.The carrying amounts of available-for-sale financial assets approximate <strong>the</strong>ir fair values and are denominated in United States dollars.10 TRADE PAYABLESUS$2010-11`2010-11US$2009-10`2009-10Third parties 2,296,554 104,745,828 3,767,212 178,603,5212,296,554 104,745,828 3,767,212 178,603,521Trade payables are recognized at <strong>the</strong>ir original invoiced amounts which represent <strong>the</strong>ir fair values on initial recognition. Trade payables are considered tobe of short duration and are not discounted and <strong>the</strong> carrying values are assumed to approximate <strong>the</strong>ir fair values.The carrying amounts of trade payables approximate <strong>the</strong>ir fair values and are denominated in United States dollars.11 OTHER PAYABLESUS$2010-11`2010-11US$2009-10`2009-10Accruals for Operating Expenses 143,428 6,541,751 13,500 640,035Accruals for employee benefit expense 13,900 633,979 - -Advance from customers 883,147 40,280,335 261,352 12,390,698Advance from third party 3,500,000 159,635,000 - -O<strong>the</strong>r creditors 858,608 39,161,111 478,359 22,679,000Amount owing to holding company 510,980 23,305,798 61,340 2,908,129Amount owing to related company 482,628 22,012,663 2,601,359 123,330,4306,392,691 291,570,637 3,415,910 161,948,293Advances from third party is non-trade in nature, interest-free, unsecured and repayable within <strong>the</strong> next twelve monthsThe amount owing to holding company and related company is non-trade in nature, interest-free, unsecured and repayable within <strong>the</strong> next twelve months.The carrying amounts of o<strong>the</strong>r payables approximate <strong>the</strong>ir fair values and are denominated in <strong>the</strong> following currencies:US$2010-11`2010-11US$2009-10`2009-10United States Dollar 6,373,553 290,697,752 3,415,910 161,948,293Singapore Dollar 19,138 872,884 - -6,392,691 291,570,637 3,415,910 161,948,293
Over<strong>view</strong> Performance Re<strong>view</strong>s Governance Financials165Annual Report 2010-11Notes to <strong>the</strong> Financial Statements for <strong>the</strong> Financial year ended 31st March, 201112 DEFERRED INCOME TAX LIABILITYUS$2010-11`2010-11US$2009-10`2009-10At <strong>the</strong> beginning of <strong>the</strong> year 3,000 136,830 - -Reversal of deferred income tax liability (3,000) (136,830) - -Charged to statement of comprehensive income(Note 18) 3,250 148,233 3,000 142,230At <strong>the</strong> end of <strong>the</strong> year 3,250 148,233 3,000 142,230The deferred income tax liability comprises of <strong>the</strong> excess net book value of plant and equipment over tax written down value.13 SHARE CAPITALUS$2010-11`2010-11US$2009-10`2009-10Issued and fully paid107,577 ordinary shares 708,012 3 32, 32,292,427, 708,012 33,566,849All issued ordinary shares are fully paid. There is no par value for <strong>the</strong>se ordinary shares.The holder of ordinary shares is entitled to receive dividend as declared from time to time and entitled to one vote per share at meeting of <strong>the</strong>company. All shares rank equally with regard to <strong>the</strong> company’s residual assets.14 RESERVESUS$2010-11`2010-11US$2009-10`2009-10Fair value reserveBalance at beginning of <strong>the</strong> year 590,957 26,953,549 448,665 21,271,208Fair value gains on available 6,779 309,190 142,292 6,746,064for resale financial assets(Note 9)Balance at end of <strong>the</strong> year 597,736 27,262,739 590,957 28,017,271Currency translation reserveBalance at beginning of <strong>the</strong> year (3,457) (157,674) (3,457) (163,896)Retained ProfitsBalance at beginning of <strong>the</strong> year 8,745,369 398,876,280 6,814,128 323,057,808Profit for <strong>the</strong> year 1,867,770 85,188,990 1,931,241 91,560,136Balance at end of <strong>the</strong> year 10,613,139 484,065,270 8,745,369 414,617,944Total reserves 11,207,418 511,170,335 9,332,869 442,471,31915 OTHER INCOMEUS$2010-11`2010-11US$2009-10`2009-10Commission Income 7,785 355,074 268,981 12,752,389Foreign Exchange Gain - - 25,194 1,194,448Government grant 291 13,273 3,960 187,744Gain on sale of plant & equipment - - 3,507 166,267Interest Income 170,049 7,755,935 343,727 16,296,097Reversal of Inventory Allowance - - 279,374 13,245,121O<strong>the</strong>rs 11,454 522,417 2,000 94,820189,579 8,646,698 926,743 43,936,886
166Notes to <strong>the</strong> Financial Statements for <strong>the</strong> Financial year ended 31st March, 201116 PURCHASE CONSUMED17 OPERATING EXPENSESUS$2010-11`2010-11US$2009-10`2009-10Bank Charges 84,192 3,839,997 58,719 2,783,868Commission fees 1,468,161 66,962,823 450,439 21,355,313Management Fees 126,700 5,778,787 107,800 5,110,798Office Rental - operating lease 44,094 2,011,127 40,536 1,921,812Provision for slow moving inventories 114,306 5,213,497 - -Professional Fees 25,932 1,182,759 14,261 676,114O<strong>the</strong>rs 154,875 7,063,849 50,477 2,393,1152,018,260 92,052,839 722,232 34,241,01918 INCOME TAX EXPENSESUS$2010-11`2010-11US$2009-10`2009-10Current year's provision 360,000 16,419,600 372,000 17,636,520Over provision for prior period - - (3,626) (171,909)Deferred Tax liability 3,250 148,233 3,000 142,230The current year’s income tax expense varied from <strong>the</strong> amount of income tax expense determined by applying <strong>the</strong> applicable Singapore statutoryincome tax rate 17% (2010 : 17%) to <strong>the</strong> profit before income tax as a result of <strong>the</strong> following differences:363,250 16,567,833 371,374 17,606,841Profit before Income Tax 2,231,020 101,756,822 2,302,615 109,166,977Tax calculated at <strong>the</strong> applicable tax rate 379,273 17,298,642 391,445 18,558,407Temporary differences not recognized 1,223 55,781 1,067 50,586Non Taxable items (380) (17,332) (1,013) (48,026)Deferred taxation 3,250 148,233 3,000 142,230Exempt Income (19,453) (887,251) (18,537) (878,839)Over provision of prior year - - (3,626) (171,909)O<strong>the</strong>rs (663) (30,239) (962) (45,608)363,250 16,567,833 371,374 17,606,84119 NET PROFITUS$2010-11US$2010-11`2010-11`2010-11US$2009-10US$2009-10`2009-10Opening Inventories 4,772,931 217,693,383 2,712,406 128,595,168Purchase 46,907,202 2,139,437,483 32,270,056 1,529,923,355Inventories written off 114,306 5,213,497 (279,375) (13,245,169)Closing Inventories (5,224,321) (238,281,281) (4,772,931) (226,284,659)46,570,118 2,124,063,082 29,930,156 1,418,988,696`2009-10CPF Contributions 8,324 379,658 4,590 217,612
Over<strong>view</strong> Performance Re<strong>view</strong>s Governance Financials167Annual Report 2010-11Notes to <strong>the</strong> Financial Statements for <strong>the</strong> Financial year ended 31st March, 201120. BANKING FACILITIESThe company’s banking facilities at <strong>the</strong> existing limit of US$1,500,000 and foreign exchange limit of US$1,000,000, and letter of credit from financialinstitution as at 31st March, 2011 were secured by <strong>the</strong> following:a) Charge on all monies of <strong>the</strong> company with <strong>the</strong> bank;b) Corporate guarantee provided by <strong>the</strong> holding company ; andc) General letter of charge on all assets of <strong>the</strong> company.21. IMMEDIATE AND ULTIMATE HOLDING COMPANYThe company’s immediate and ultimate holding company is TIL Limited, a company incorporated in <strong>the</strong> Republic of India.22. SIGNIFICANT RELATED PARTY TRANSACTIONSAn entity or individual is considered a related party of <strong>the</strong> company for <strong>the</strong> purpose of <strong>the</strong> financial statements if:(i)it possesses <strong>the</strong> ability (directly or indirectly) to control or exercise significant influence over <strong>the</strong> financial and operating decisions of <strong>the</strong> companyor vice versa; or(ii) it is subject to common control or common significant influence.During <strong>the</strong> financial year, <strong>the</strong> company had significant related party transactions as detailed below on terms agreed between <strong>the</strong>m :US$2010-11`2010-11US$2009-10`2009-10Warranty expenses paid to holding company 1,135,970 51,811,592 1,120,062 53,102,139Sales to related company 606,662 27,669,854 1,492,439 70,756,533Purchase from related company - - 127,177 6,029,462Management Fees paid/payable to holding company 126,700 5,778,787 207,500 9,837,575Parts commission paid/payable to holding company 950,000 43,329,500 450,439 21,355,31323 COMMITMENTS AND CONTINGENT LIABILITIESa) As at 31st March, 2011, <strong>the</strong> company had obtained bank guarantees amounting to US$919,925 and EUR21,824 (2010 : US$193,762).b) As at 31st March, 2011 of this report, <strong>the</strong> company had entered into letter of credit amounting to US$363,323 (2010 : US401,068).24 OPERATING LEASE COMMITMENTSAt <strong>the</strong> end of <strong>the</strong> reporting period, <strong>the</strong> company’s commitments in respect of operating leases are as follows;US$2010-11`2010-11US$2009-10`2009-10Due within one year 19,013 867,183 16,825 797,67319,013 867,183 16,825 797,67325. FINANCIAL RISK MANAGEMENTFinancial risk factorsThe company’s activities expose it to market risk (including currency risk and interest rate risk), credit risk and liquidity risk. The company’s overall riskmanagement strategy seeks to minimize adverse effects from <strong>the</strong> unpredictability of financial markets on <strong>the</strong> company’s financial performance.(a)Market risk(i) Foreign currency riskThe company incurs foreign currency risk on transactions that are denominated in currency o<strong>the</strong>r than United States dollars such asSingapore dollars, British pounds and Euro. However, <strong>the</strong> company does not use any hedging instruments to protect against <strong>the</strong> vola<strong>til</strong>ityassociated with foreign currency purchases and o<strong>the</strong>r assets and liabilities created in <strong>the</strong> normal course of business.
168Notes to <strong>the</strong> Financial Statements for <strong>the</strong> Financial year ended 31st March, 201125. FINANCIAL RISK MANAGEMENT (Contd.)The company’s currency exposure to Singapore dollars based on <strong>the</strong> information provided to key management is as follows:Financial AssetsUS$2010-11`2010-11US$2009-10`2009-10Cash & Cash equivalents 114,069 5,202,687 208,120 9,866,969Trade Receivables 412,877 18,831,320 - -O<strong>the</strong>r Receivables 8,797 401,231 - -535,743 24,435,238 208,120 9,866,969Financial LiabilitiesO<strong>the</strong>r Payables 19,138 872,884 - -19,138 872,884 - -Currency Exposure 516,605 23,562,354 208,120 9,866,969If against United States dollar <strong>the</strong> Singapore dollar had streng<strong>the</strong>ned/weakened by 10% (2010 : 9%) respectively with all o<strong>the</strong>r variables including taxrate being held constant, <strong>the</strong> company’s net profit for <strong>the</strong> financial year would have been higher/lower by approximately US$51,700 (2010 : US$18,800)respectively as a result of currency translation gains/losses on <strong>the</strong> remaining Singapore dollars denominated financial assets and liabilities.(ii) Interest rate riskThe company has no significant exposure to market risk for changes in interest rates except for <strong>the</strong> fixed deposit as disclosed in Note 4.(b)Credit riskCredit risk refers to <strong>the</strong> risk that a counterparty will default on its contractual obligations resulting in financial loss to <strong>the</strong> company. The major classesof financial assets of <strong>the</strong> company are trade receivables and amounts owing by immediate holding company. For credit exposures to customer,management assesses <strong>the</strong> credit quality of <strong>the</strong> customer, taking into account its financial position, past experience and o<strong>the</strong>r factors.As <strong>the</strong> company does not hold any collateral, <strong>the</strong> maximum exposure to credit risk for each class of financial instruments is <strong>the</strong> carrying amount ofthat class of financial instruments presented on <strong>the</strong> statement of financial position.The significant trade receivables of <strong>the</strong> company comprise 2 debtors (2010 : 2 debtors) that collectively represent 61% (2010 : 60%) of trade receivables.The credit risk for trade receivables and amounts owing by immediate holding company based on <strong>the</strong> information provided to key management is as follows:US$2010-11`2010-11US$2009-10`2009-10By geographical areaO<strong>the</strong>r 4,880 222,577 - -Singapore 427,826 19,513,144 435,276 20,636,435Myanmar 3,174,742 144,799,983 2,402,084 113,882,8023,607,448 164,535,703 2,837,360 134,519,238By Types of customerNon related Parties 3,607,448 164,535,703 2,837,360 134,519,238The ageing analysis of <strong>the</strong> trade receivables of <strong>the</strong> company that are past due but not impaired is as follows:Due less than 30 days 3,119,770 142,292,710 936,938 44,420,231Due from 30 days to 90 days 487,678 22,242,994 459,918 21,804,712Due more than 90 days - - 1,440,504 68,294,2953,607,448 164,535,703 2,837,360 134,519,238
Over<strong>view</strong> Performance Re<strong>view</strong>s Governance Financials169Annual Report 2010-11Notes to <strong>the</strong> Financial Statements for <strong>the</strong> Financial year ended 31st March, 2011(c)Liquidity riskPrudent liquidity risk management implies maintaining sufficient cash. At <strong>the</strong> end of each reporting period, assets held by <strong>the</strong> company for managingliquidity risk included cash and cash equivalents as disclosed in Note 4.The management monitors rolling forecasts of <strong>the</strong> company’s liquidity reserve (comprising amounts owing to immediate holding company and cashand cash equivalents) on <strong>the</strong> basis of expected cash flow. This is generally carried out at local level of <strong>the</strong> company in accordance with practiceand limits set by <strong>the</strong> company. These limits vary by location to take into account <strong>the</strong> liquidity of <strong>the</strong> market in which <strong>the</strong> entity operates. In addition,<strong>the</strong> company’s liquidity management policy involves projecting cashflows in major currencies and considering <strong>the</strong> level of liquid assets necessary tomeet <strong>the</strong>se; monitoring liquidity ratios; and maintaining debt financing plans.The table below analyzes <strong>the</strong> company’s non-derivative financial liabilities into relevant maturity grouping based on <strong>the</strong> remaining period from <strong>the</strong>end of each reporting period to <strong>the</strong> contractual maturity date. The amounts disclosed in <strong>the</strong> table are <strong>the</strong> contractual undiscounted cash flows.Balances due within 12 months equal <strong>the</strong>ir carrying balances as <strong>the</strong> impact of discounting is not significant.US$2010-11`2010-11US$2009-10`2009-10Less than 1 yearTrade Payables 2,296,554 104,745,828 3,767,212 178,603,521O<strong>the</strong>r Payables 6,392,691 291,570,637 3,415,910 161,948,2938,689,245 396,316,464 7,183,122 340,551,814(d) Fair value measurementThe carrying amounts of cash and cash equivalents, trade and o<strong>the</strong>r receivables and trade and o<strong>the</strong>r payables approximate <strong>the</strong>ir fair values due to<strong>the</strong>ir short-term nature.26. CAPITAL RISK MANAGEMENTThe company’s objectives when managing capital are to safeguard <strong>the</strong> company’s ability to continue as a going concern and to maintain an optimal capitalstructure so as to maximize shareholder value. In order to maintain or achieve an optimal capital structure, <strong>the</strong> company may adjust <strong>the</strong> amount of dividendpayment, return capital to shareholders, issue new shares, buy back issued shares, obtain new borrowings or sell assets to reduce borrowings.The gearing ratio is calculated as net debt divided by total capital. Net debt is calculated trade and o<strong>the</strong>r payable less cash and cash equivalents. Totalcapital is calculated as equity plus net debt.US$2010-11`2010-11US$2009-10`2009-10Net Debt N/A* N/A* N/A* N/A*Total Equity 11,915,430 543,462,762 10,040,881 476,038,168Total Capital 11,915,430 543,462,762 10,040,881 476,038,168Gearing ratio N/A N/A* excess of cash and cash equivalents over trade and o<strong>the</strong>r payableThe company is not subject to externally imposed capital requirements.
170SCHEDULE of Employee Benefits Expenses and O<strong>the</strong>r Operating Expensesfor <strong>the</strong> year ended 31st March, 2011US$2010-11`2010-11US$2009-10`2009-10STAFF AND RELATED COSTSSalaries 54,172 2,470,785 41,413 1,963,390Bonus 17,476 797,080 5,606 265,780CPF Contribution 8,324 379,658 4,590 217,612Incentive 10,514 479,544 4,222 200,16590,486 4,127,066 55,831 2,646,948OPERATING EXPENSESAuditors’ Remuneration 13,500 615,735 13,500 640,035Advertisement 18882 861,208 76 3,603Bank Charges 84192 3,839,997 58719 2,783,868Commission fees 1468161 66,962,823 450439 21,355,313Exchange Loss 8050 367,161 - -Insurance 3227 147,183 4019 190,541General Expenses 89933 4,101,844 4836 229,275Management Fees 126700 5,778,787 107800 5,110,798Office Rent - operating lease 44094 2,011,127 40536 1,921,812Printing & Stationery 1767 80,593 1614 76,520Professional Fees 25932 1,182,759 14261 676,114Prov for Slow moving Inventory 114306 5,213,497 - -Inventory written Off 4497 205,108 - -Plant & Equipment w/off - - 2685 127,296Repairs and maintainance 1128 51,448 7720 366,005Telephone/Fax/email 10499 478,859 9262 439,111Travel 3392 154,709 6765 320,7292,018,260 92,052,839 722,232 34,241,019
Over<strong>view</strong> Performance Re<strong>view</strong>s Governance Financials171Annual Report 2010-11Tractors Nepal Pvt. Ltd., Soaltee Mode, Kalimati(INCORPORATED IN NEPAL)A Subsidiary Company of TIL Limited10th Annual Report 2010-2011BOARD OF DIRECTORSMr. Sumit MazumderMr. Aloke BanerjeeMr. Subir BhattacharyyaMr. G.V.R. MurthyBANKERSNepal Grindlays BankNew Baneswor BranchKathmanduNepalAUDITORSM/s. JBRH and CompanyChartered Accountants,GPO Box : 10228Putali Sadak,Kathmandu,Nepal.Tel : 426 9234, 423 2006Fax : 977-1-4223651E-mail : jbrh@info.com.npREGISTERED OFFICEKathmandu district,Kathmandu Metro, Ward No. 13KalimatiNepalTelefax : 009715550380)
172Directors’ ReportYour Directors have pleasure in presenting to you <strong>the</strong> Tenth Annual Report and Accounts for <strong>the</strong> period ended 31st March, 2011.BUSINESS SCENARIOYour Company has been able to maintain <strong>the</strong> services and support to <strong>the</strong> customers to make <strong>the</strong>m more profitable despite slow recovery of world economy.The profit before taxation for Financial Year 2010-11 is Nepalese Rupees 5,184,222 (Indian Rupees 3,240,139) on 31st March, 2011; whereas <strong>the</strong> Profit beforeTaxation for Financial Year 2009-10 was Nepalese Rupees 21,935,131 (Indian Rupees 1,37,09,457) on 31st March, 2010. It is expected that performance of <strong>the</strong>Company will improve fur<strong>the</strong>r.PRINCIPAL ACTIVITIESThe principal activities of <strong>the</strong> Company are to carry on <strong>the</strong> business of refurbishing, rebuilding and servicing of Earthmoving Equipment, Diesel Generator Sets andMaterial Handling Equipment. There has been no significant change in <strong>the</strong> nature of <strong>the</strong>se activities during <strong>the</strong> year under re<strong>view</strong>.FINANCEDuring <strong>the</strong> year under re<strong>view</strong>, <strong>the</strong> Company has registered a gross turnover including income from operations revenue of Nepalese Rupees 2,81,88,865 (IndianRupees 17,618,041) and earned profit after tax of Nepalese Rupees 3,888,166 (Indian Rupees 2,430,104).DIVIDENDBoard has recommended a Dividend of NRS. 25/- per Equity Share for <strong>the</strong> year under re<strong>view</strong>.DIRECTORSPresently, <strong>the</strong> Board of Directors of <strong>the</strong> Company consists of Mr. Sumit Mazumder, Mr. Aloke Banerjee, Mr. Subir Bhattacharyya and Mr. G.V.R. Murthy.AUDITORSM/s. JBRH & Company, Chartered Accountants, Auditors of <strong>the</strong> Company retires and being eligible offers <strong>the</strong>mselves for re-appointment.ACKNOWLEDGEMENTThe Board of Directors thanks <strong>the</strong> shareholders, customers, bankers and employees for reposing <strong>the</strong>ir support and faith in <strong>the</strong> Company throughout <strong>the</strong> periodunder report.For and on behalf of <strong>the</strong> Board of DirectorsPlace : Kalimati, NepalDate : 21st April, 2011.S. K. BhattacharyaDirectorAloke BanerjeeDirector
Over<strong>view</strong> Performance Re<strong>view</strong>s Governance Financials173Annual Report 2010-11Auditor’s ReportBoard of DirectorsTractors Nepal Private LimitedNepalDear Sirs,1. We have audited <strong>the</strong> accompanying Financial Statements of Tractors Nepal Pvt. Ltd. expressed in Nepalese Nrs. as of 31st March, 2011 and for <strong>the</strong> year<strong>the</strong>n ended.These Standard Forms are <strong>the</strong> responsibility of TIL Limited’s management. Our responsibility is to express an opinion on <strong>the</strong>se Standard Formsbased on our audit.2. We conducted our audit in accordance with International Standards on Auditing generally accepted in India and with your ‘TIL Limited Group AuditInstructions for <strong>the</strong> year ending 31st March, 2011’. Those Standards require that we plan and perform <strong>the</strong> audit to obtain reasonable assurance aboutwhe<strong>the</strong>r <strong>the</strong> Financial Statements are free of material misstatement. An audit includes examining, on a test basis, evidence supporting <strong>the</strong> amounts anddisclosures in Financial Statements. An audit also includes assessing <strong>the</strong> accounting principles used and significant estimates made by management, aswell as, evaluating <strong>the</strong> overall presentation of information in Financial Statements. We believe that our audit provides a reasonable basis for our opinion.3. On <strong>the</strong> basis of our examinations carried out as aforesaid and according to <strong>the</strong> information and explanations obtained, in our opinion:a. <strong>the</strong> accompanying Financial Statements have been properly prepared to give <strong>the</strong> information required for <strong>the</strong> purpose of presentation of ConsolidatedFinancial Statements of <strong>the</strong> Parent Company i.e. TIL Limited; andb. present a true and fair <strong>view</strong> of <strong>the</strong> financial position of Tractors Nepal Private Limited as at 31st March, 2011, and its profit/loss and cash flows for<strong>the</strong> year <strong>the</strong>n ended in conformity with <strong>the</strong> accounting principles generally accepted in India.Date : 21st April, 2011.Raju Kumar Sibakoti, FCAPartner,JBRH and Company,Chartered Accountants
174Balance Sheet as at 31st March, 2011ScheduleAs at31.03.2011(NR) ` (NR) `As at31.03.2011As at31.03.2010As at31.03.2010SOURCES OF FUNDS1. Shareholders’ Funds(a) Capital A 12,000,000 7,500,000 3,680,000 2,300,000(b) Reserves and Surplus B 40,313,424 25,195,890 39,425,257 24,640,7862. Loan Funds CTotal 52,313,424 32,695,890 43,105,257 26,940,786APPLICATIONS OF FUNDS1. Fixed Assets E(a) Gross Block 9,777,885 6,111,178 1,680,125 1,050,078(b) Less : Depreciation 1,621,179 1,013,237 878,955 549,347(c) Net Block 8,156,706 5,097,941 801,170 500,731(d) Capital Work-in-Progress 14,662,268 9,163,918 - -2. Investments F - - - -3. Current Assets,Loans and Advances(a) Inventories G 7,152,197 4,470,123 10,201,942 6,376,214(b) Sundry Debtors H 13,416,410 8,385,256 14,182,977 8,864,361(c) Cash and Bank Balances I 6,154,614 3,846,634 20,252,391 12,657,745(d) O<strong>the</strong>r Current Assets J 9,170,850 5,731,781 4,023,099 2,514,437(e) Loans and Advances K 1,584,866 990,541 1,787,264 1,117,04037,478,937 23,424,336 50,447,674 31,529,796Less : Current Liabilities and ProvisionsD(a) Liabilities 2,010,475 1,256,547 960,190 600,118(b) Provisions 6,019,209 3,762,006 7,228,957 4,518,0988,029,684 5,018,553 8,189,147 5,118,217Net Current Assets 29,449,253 18,405,783 42,258,527 26,411,580Deferred Tax Assets 45,197 28,248 45,560 28,4754. Miscellaneous Expenditure L - - - -(To <strong>the</strong> extent not written off or adjusted )Total 52,313,424 32,695,890 43,105,257 26,940,786NotesPThe Schedules referred to above form part of <strong>the</strong> Balance Sheet.This is <strong>the</strong> Balance Sheet referred to in our report of even date.As Per Our Report of Even DateRaju Sibakoti, FCAPartner,For and on behalf ofJBRH and Company,Chartered AccountantsDate : 21st April, 2011For and on behalf of Board of DirectorsAloke BanerjeeDirectorS. K. BhattacharyaDirector
Over<strong>view</strong> Performance Re<strong>view</strong>s Governance Financials175Annual Report 2010-11Profit & Loss Account for <strong>the</strong> year ended 31st March, 2011Year to31.03.2011NR ` NR `Year to31.03.2011Year to31.03.2010Year to31.03.2010ScheduleINCOMESales 14,662,074 9,163,796 21,785,303 13,615,814Selling Commission 13,167,291 8,229,557 18,362,889 11,476,805O<strong>the</strong>r Income M 359,500 224,687.50 - -28,188,865 17,618,041 40,148,191 25,092,620EXPENDITURECost of Materials and Direct Manufacturing Expenses N 8,612,847 5,383,029 12,703,638 7,939,774Expenses O 13,617,071 8,510,669 5349794 3,343,62122,229,918 13,893,699 18,053,432 11,283,395Profit Before Interest, Depreciation and Taxation 5,958,947 3,724,342 22,094,759 13,809,225Interest on - - - -Depreciation 774,725 484,203 159,629 99,768Profit Before Taxation 5,184,222 3,240,139 21,935,130 13,709,456Less : Provision for Taxation 1,296,055 810,034 4,991,032 3,119,395Profit After Taxation 3,888,167 2,430,104 16,944,098 10,590,061Add : Balance of Profit and Loss Accountbrought forward from previous year 39,425,257 24,640,786 24,321,159 15,200,724Balance Available For Appropriation 43,313,424 27,070,890 41,265,257 25,790,786APPROPRIATIONSInterim Dividend 3,000,000 1,875,000 1,840,000.00 1,150,000Balance Carried Forward 40,313,424 25,195,890 39,425,257 24,640,78643,313,424 27,070,890 41,265,257 25,790,786NotesPThe Schedules referred to above form part of <strong>the</strong> Profit and Loss Account.This is <strong>the</strong> Profit and Loss Account referred to in our report of even date.As Per Our Report of Even DateRaju Sibakoti, FCAPartner,For and on behalf ofJBRH and Company,Chartered AccountantsDate : 21st April, 2011For and on behalf of Board of DirectorsAloke BanerjeeDirectorS. K. BhattacharyaDirector
176Schedule forming part of <strong>the</strong> Balance Sheet as on 31st March, 2011. As at 31.03.2011 As at 31.03.2010SCHEDULE ‘A’Share CapitalAuthorized400,000 Shares of NR 100/- each NR 40,000,000 40,000,000` 25,000,000 25,000,000Issued,Subscribed and Paid up36800 Equity Shares of NR 100/- eachfully called and paid up. NR 12,000,000 3,680,000` 7,500,000 2,300,000Total NR 12,000,000 3,680,000` 7,500,000 2,300,000As per lastAccountAdditions Deductions As at31.03.2011SCHEDULE ‘B’Reserves and SurplusProfit and Loss Account NR 39,425,257 3,888,167 3,000,000 40,313,424` 24,640,786 2,430,104 1,875,000 25,195,890Total NR 39,425,257 3,888,167 3,000,000 40,313,424` 24,640,786 2,430,104 1,875,000 25,195,890
Over<strong>view</strong> Performance Re<strong>view</strong>s Governance Financials177Annual Report 2010-11Schedule forming part of <strong>the</strong> Balance Sheet as on 31st March, 2011As at31.03.2011NR ` NR `As at31.03.2011As at31.03.2010As at31.03.2010SCHEDULE ‘C’Loan FundsSecured Loans - - - -Unsecured Loans - - - -Total - - - -As at31.03.2011NR ` NR `As at31.03.2011As at31.03.2010As at31.03.2010SCHEDULE ‘D’Current Liabilities and ProvisionsCurrent Liabilities :Sundry Creditors 1,020,641 637,901 789,852 493,657Advance by Customers and o<strong>the</strong>rs 50,614 31,634 59,745 37,341O<strong>the</strong>r Liabilities 939,220 587,013 110,593 69,1212,010,475 1,256,547 960,190 600,118Provisions for :Taxation - 2,919,584 1,824,740 5,388,957 3,368,098Proposed Dividend 3,000,000 1,875,000 1,840,000 1,150,000Employees’ benefit 99,625 62,2663,099,625 1,937,266 - -6,019,209 3,762,006 7,228,957 4,518,098Total 8,029,684 5,018,553 8,189,147 5,118,217
178Schedule forming part of <strong>the</strong> Balance Sheet as on 31st March, 2011Cost /Valuationas at01.04.2010Additions /Adjustmentduring<strong>the</strong> yearCost / Valuationof sales /Adjustmentetc. during <strong>the</strong> yearTotal Cost/Valuation as at31.03.2011DepreciationProvidedupto31.03.2010DepreciationProvidedduring<strong>the</strong> yearDepreciationon sales Adjustment,etc. during <strong>the</strong> yearDepreciationProvidedupto31.12.2010SCHEDULE ‘E’Fixed AssetsBuildings :Leasehold NR 265,615 - - 265,615 265,614 - - 265,614 1 1` 166,009 - - 166,009 166,009 - - 166,009 1 1Plant and Machinery NR 216,827 1,819,344 - 2,036,171 71,281 24,823 - 96,104 1,940,067 145,546` 135,517 1,137,090 - 1,272,607 44,551 15,514 60,065 1,212,542 90,966Software NR - 87,000 - 87,000 - - - - 87,000 -` 54,375 54,375 54,375Furnitures NR 488,077 1842189 - 2,330,266 195,374 76,464 - 271,838 2,058,428 292,703` 305,048 1,151,368 1,456,416 122,109 47,790 - 169,899 1,286,518 182,939Office Equipments NR 517,606 1,661,988 - 2,179,594 279,486 133,711 - 413,197 1,766,397 238,120` 323,504 1,038,743 1,362,246 174,679 83,569 - 258,248 1,103,998 148,825Cycle and Motor Vehicles NR 192,000 2,752,239 65,000 2,879,239 67,200 539,727 32,500 574,427 2,304,812 124,800` 120,000 1,720,149 40,625 1,799,524 42,000 337,329 20,313 359,017 1,440,508 78,000Total NR 1,680,125 8,162,760 65,000 9,777,885 878,955 774,725 32,500 1,621,180 8,156,705 801,170` 1,050,078 5,101,725 40,625 6,111,178 549,347 484,203 20,313 1,013,238 5,097,941 500,731Previous year NR 1,586,925 93,200 - 1,680,125 719,326 159,629 - 878,955 801,170 -` 991,228 58,250 - 1,050,078 449,579 99,768 - 549,347 500,731 -Net Valueof Assetsas at31.03.2011Net Valueof Assetsas at01.04.2010
Over<strong>view</strong> Performance Re<strong>view</strong>s Governance Financials179Annual Report 2010-11Schedule forming part of <strong>the</strong> Balance Sheet as on 31st March, 2011As at 31.03.2011 As at 31.03.2010Name Particulars Numbers Value Numbers ValueSCHEDULE ‘F’Investments - Long Term - At Cost - - - -Total - - - - -As at31.03.2011NR ` NR `As at31.03.2011As at31.03.2010As at31.03.2010SCHEDULE ‘G’InventoriesStock-of spare parts-at Weighted average cost 7,152,196 4,470,123 10,201,942 6,376,214Total 7,152,196 4,470,123 10,201,942 6,376,214As at31.03.2011NR ` NR `As at31.03.2011As at31.03.2010As at31.03.2010SCHEDULE ‘H’Sundry Debtors (Unsecured-Considered Good)Debts outstanding for more than six months 662,775 414,234 900,428 562,768O<strong>the</strong>r Debts 12,753,635 7,971,022 13,282,549 8,301,593Total 13,416,410 8,385,256 14,182,977 8,864,361As at31.03.2011NR ` NR `As at31.03.2011As at31.03.2010As at31.03.2010SCHEDULE ‘I’Cash and Bank BalancesCash in hand 77,037 48,148 79,044 49,402Balance with Scheduled BanksOn Current Accounts 6,077,577 3,798,486 20,173,348 12,608,342Total 6,154,614 3,846,634 20,252,391 12,657,745As at31.03.2011NR ` NR `As at31.03.2011As at31.03.2010As at31.03.2010SCHEDULE ‘J’Claims Receivable (Warranty Claim) 5,408,646 3,380,404 3,862,141 2,413,838Vat Receivable 1,906,762 1,191,726 131,594 82,246Deposits 1,855,442 1,159,651 29,364 18,353Total 9,170,850 5,731,781 4,023,099 2,514,437
180Schedule forming part of <strong>the</strong> Balance Sheet as on 31st March, 2011As at31.03.2011NR ` NR `As at31.03.2011As at31.03.2010As at31.03.2010SCHEDULE ‘K’Loans and Advances (Unsecured-Considered Good)Advances recoverable in cash or in kind or for value to be received 217,915 136,197 143,640 89,775Prepaid Expenses 72,236 45,148 93,591 58,494Import Margin Cheque(NRB) - - 54,057 33,786Advance Income Tax (Including Tax deducted at source) 702,830 439,269 1,495,977 934,985Advance to Supplier 591,885 369,928 - -Total 1,584,866 990,541 1,787,264 1,117,040As at31.03.2011NR ` NR `As at31.03.2011As at31.03.2010As at31.03.2010SCHEDULE ‘L’Miscellaneous Expenditure (To <strong>the</strong> extent not written off or adjusted) - - - -Total - - - -As at31.03.2011NR ` NR `As at31.03.2011As at31.03.2010As at31.03.2010SCHEDULE ‘M’O<strong>the</strong>r IncomeMiscellaneous Income 359,500 224,688 - -Total 359,500 224,688 - -As at31.03.2011NR ` NR `As at31.03.2011As at31.03.2010As at31.03.2010SCHEDULE ‘N’Cost of Materials and Direct Manufacturing ExpensesOpening StockStock in trade 10,201,942 6,376,214 4,467,094 2,791,934Add : Purchases-net of Warranty Parts Issued 5,512,656.00 3,445,410 18,438,486 11,524,05415,714,598 9,821,624 22,905,580 14,315,988Less : Closing Stock - Spare PartsStock in trade 7,152,196 4,470,123 10,201,942 6,376,2148,562,402 5,351,501 12,703,638 7,939,774Direct Expenses 50,445 31,528 - -Total 8,612,847 5,383,029 12,703,638 7,939,774
Over<strong>view</strong> Performance Re<strong>view</strong>s Governance Financials181Annual Report 2010-11Schedule forming part of <strong>the</strong> Profit and Loss Account 31st March, 2011As at31.03.2011NR ` NR `As at31.03.2011As at31.03.2010As at31.03.2010SCHEDULE ‘O’ExpensesSalaries, Wages and Bonus 4,381,386 2,738,366 2,379,383 1,487,114Contribution to Provident and o<strong>the</strong>r Funds 79,504 49,690 64,805 40,503Staff Welfare Expenses 65,732 41,083 17,397 10,873Rent (Net) 1,134,983 709,364 659,588 412,243Rates and Taxes 19,730 12,331 53,130 33,206Bank Charges 13,837 8,648 29,056 18,160Insurance 147,585 92,241 62,287 38,929Repairs and Maintenance : O<strong>the</strong>r Assets 76,132 47,583 28,245 17,653Travelling Expenses 1,110,235 693,897 776,315 485,197Stationery and Printing 55,227 34,517 37,574 23,484Postage, Telegrams, Telephones 314,135 196,334 302,709 189,193Advertising 113,435 70,897 - -Gas and Electricity 146,851 91,782 44,681 27,926Discount on Sale 12,046 7,529 - -Miscellaneous Expenses 543,543 339,714 481,368 300,855Staff Medical 83,000 51,875 67,300 42,063Leave Travel Allowance 134,650 84,156 - -Security Guard Expenses 45,600 28,500 - -Motor vehicle expenses 227,285 142,053 159,319 99,574Professional Fee 592,175 370,109 186,637 116,648Debts/Advances/Claims written off - 4,320,000 2,700,000 - -Total 13,617,071 8,510,669 5,349,794 3,343,621
182Schedule forming part of <strong>the</strong> Accounts for <strong>the</strong> year ended 31st March, 2011SCHEDULE ‘P’Significant Accounting Policies and Notes to <strong>the</strong> Accounts1. Accounting PoliciesA. Accounting Convention:The financial statements are prepared under <strong>the</strong> historical cost convention in accordance with <strong>the</strong> relevant Indian/International Accounting Standardsas applicable.B. Fixed Assets:Fixed assets are stated at cost and are inclusive of all expenses to <strong>the</strong> date of commissioning/ putting <strong>the</strong> assets to use. Borrowing cost <strong>til</strong>l <strong>the</strong> dateit comes into use is capitalized as part of expenses.Assets under construction are shown as Capital work-in-progress.C. Depreciation:Depreciation is provided for as prescribed in Schedule XIV of <strong>the</strong> Indian Companies Act 1956 as amended on straight – line method at <strong>the</strong> ratesmentioned below. Depreciation on addition is provided from <strong>the</strong> succeeding month of <strong>the</strong> purchases of fixed assets.Plant & Machineries 4.75%Computer & Accessories 16.21%Furniture 6.33%Building on leased land 20%Vehicle 20%Fixed Assets under construction is shown under Capital work-in-progress.D. Sales and o<strong>the</strong>r incomeRevenue from sales and services is recognized on accrual basis on issuing <strong>the</strong> tax invoice and stated net of VAT. Commission income is recognizedon <strong>the</strong> settlement basis after confirmation.E. Deferred Revenue Expenses:Deferred revenue expenses are written off over <strong>the</strong> period of five years from <strong>the</strong> year of operation/expensed.F. Inventories:(i) Stock of spares and consumable store is valued at cost on weighted average cost basis and stated net of write-off.(ii) Work-in-Progress is valued on <strong>the</strong> percentage of completion basis.G. Tax ProvisionIncome tax provision is based on <strong>the</strong> Nepalese Income Tax Laws which is 25% on taxable income as computed on <strong>the</strong> taxable Profit.H. Employee Benefits1. Short term employee benefits (i.e. benefits payable within one year) are recognized in <strong>the</strong> period in which employee services are rendered.2. Contributions towards provident funds are recognized as expenses.3. Provisions for Gratuity for eligible employees are made on <strong>the</strong> basis of local labour laws.Notes to <strong>the</strong> AccountsA. Contingent liabilities1. One of our past customer, Hetauda Cements Factory Limited had filed a case against our Company relating to wrong parts supply made by TIL fora value of Nrs. 920,415.71, for which <strong>the</strong> appellate court has decided in favor of <strong>the</strong> customer. The Company has filed <strong>the</strong> case at Supreme Courtagainst <strong>the</strong> above decision for which no provision in <strong>the</strong> accounts has been made as <strong>the</strong> case is s<strong>til</strong>l pending.2. Inland Revenue Office has carried out full audit for <strong>the</strong> three fiscal year upto July 16, 2008 demanding Nrs. 5.01 million for VAT and income taxesagainst which we have appealed to Director General for administrative re<strong>view</strong> by depositing Nrs. 1.655 million. DG of IRD has decided <strong>the</strong> case onVAT in our favour but <strong>the</strong> letter of refund of our deposit is yet to receive by us.B. Commission incomeCommission income amounting to Nrs. 10, 988,467.73 as accrued but not yet received calculated on <strong>the</strong> difference between customer invoice and dealerinvoice is subject to confirmation with CAT Singapore.
Over<strong>view</strong> Performance Re<strong>view</strong>s Governance Financials183Annual Report 2010-11Cash Flow Statement for <strong>the</strong> year ended 31st March, 2011NR ` NR `Year EndedYear Ended31st March, 2011 31st March, 2010Year Ended31st March, 2011Year Ended31st March, 2010A. CASH FLOW FROM OPERATINGACTIVITIESNet Profit Before Tax and5,184,222 3,240,139 21,935,130 13,709,456Extra-ordinary ItemsAdjustments for :Depreciation 774,725 484,203 159,629 99,768Profit/Loss on Sale of Fixed Assets (167,500) (104,688) - -Provision for Employee Benefits 99,625 62,266 - -706,850 441,781 159,629 99,768Operating Profit before Working5,891,072 3,681,920 22,094,759 13,809,224Capital ChangesAdjustments for :Trade and O<strong>the</strong>r Receivables 766,566 479,104 (6,575,034) (4,109,396)Inventories 3,049,746 1,906,091 (5,734,848) (3,584,280)Loans and Advances (5,738,500) (3,586,563) (788,491) (492,807)Trade Payable 1,050,286 656,429 170,188 106,368(871,902) (544,939) (12,928,185) (8,080,116)Cash Generated from Operations 5,019,170 3,136,981 9,166,574 5,729,109Direct Taxes Paid (2,971,919) (1,857,449) (3,847,434) (2,404,645)Cash Flow before Extra-ordinary2,047,251 1,279,532 5,319,140 3,324,464ItemsNet Cash from Operating2,047,251 1,279,532 5,319,140 3,324,464ActivitiesB. CASH FLOW FROM INVESTINGACTIVITIESPurchase of Fixed Assets (8,162,759) (5,101,725) (93,200) (58,250)Capital Work-In-Progress (14,662,268) (9,163,917)Proceeds from Sale of Fixed Assets 200,000 125,000 -Net Cash Used in InvestingActivities(22,625,027) (14,140,642) (93,200) (58,250)
184Cash Flow Statement for <strong>the</strong> year ended 31st March, 2011NRS ` NRS `Year EndedYear Ended31st March, 2011 31st March, 2010Year Ended31st March, 2011Year Ended31st March, 2010C. CASH FLOW FROM FINANCINGACTIVITIES *Issue of Share Capital 8,320,000 5,200,000Dividend Paid (1,748,000) (1,092,500)Tax on Dividend (92,000) (57,500)Net Cash Used In Financing6,480,000 4,050,000 - -ActivitiesNet Increase In Cash And Cash(14,097,776) (8,811,110) 5,225,940 3,266,214Equivalents (A+B+C)Cash and Cash Equivalents as at20,252,391 12,657,744 15,026,451 9,391,532<strong>the</strong> beginning of <strong>the</strong> yearCash and Cash Equivalents asat <strong>the</strong> close of <strong>the</strong> year6,154,615 3,846,634 20,252,391 12,657,745Notes : 1) The above Cash Flow Statement has been prepared under <strong>the</strong> ‘Indirect Method’ as set out in <strong>the</strong> Accounting Standard - 3 on Cash Flow Statementissued by <strong>the</strong> Institute of Chartered Accountants of India.NRS ` NRS `31.03.2011 31.03.2011 31.03.2010 31.03.20102) Cash and Cash EquivalentsCash and Cheques in hand 77,037 48,148 79,044 49,402Balance with Scheduled BanksOn Current Accounts 6,077,578 3,798,485 20,173,348 12,608,3426,154,615 3,846,634 20,252,391 12,657,745The above Cash Flow Statement has been compiled from and is based on <strong>the</strong> audited accounts of TNPL for <strong>the</strong> Year ended 31st March, 2011This is <strong>the</strong> Cash Flow Statement referred to in our report of even date.As Per Our Report of Even DateRaju Sibakoti, FCAPartner,For and on behalf ofJBRH and Company,Chartered AccountantsPlace : KathmanduDate : 21st April, 2011For and on behalf of Board of DirectorsAloke BanerjeeDirectorS. K. BhattacharyaDirector
“We make our customers more profitable.”print anderson 09831778971
TIL Limited1, Taratolla Road, Garden Reach, Kolkata 700 024Tel. : +91 33 6633-2000 / 2845, Fax : +91 33 2469-2143 / 3731www.<strong>til</strong><strong>india</strong>.in