Preliminary Assessment of Forest Structure.pdf - Sokoine University ...
Preliminary Assessment of Forest Structure.pdf - Sokoine University ...
Preliminary Assessment of Forest Structure.pdf - Sokoine University ...

Create successful ePaper yourself
Turn your PDF publications into a flip-book with our unique Google optimized e-Paper software.
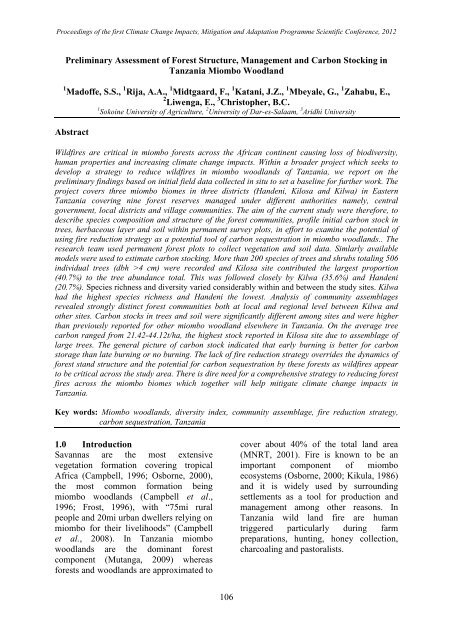
Proceedings <strong>of</strong> the first Climate Change Impacts, Mitigation and Adaptation Programme Scientific Conference, 2012among the study sites (ANOVA, F =3.281; df = 2; P = 0.055) with Kilwacontributing significantly to the observedregional variations (H' = 2.87) (Figure 2)Diameter <strong>of</strong> trees (>10 cm) wassignificantly different among Kilosa foresttypes (Kruskal Wallis χ 2 = 23.438, df = 2;p = 0.001) with Palaulanga forestrecording largest median diameter (mediandbh = 47 cm). Differences were alsoobserved among Kilwa forest types(Kruskal Wallis χ 2 = 12.487, df = 2; p =0.002; Mitundumbeya and Mitaluleforests, median tree diameter = 30 cm) andamong Handeni forest types (KruskalWallis χ 2 = 25.686, df = 2; p = 0.001;Gumba forest median tree diameter = 27cm). Moreover, tree diameter wassignificantly different (Kruskal Wallis χ 2 =8.994, df = 2; p = 0.011; median dbh =17.6 cm) across the study sites with treesin Kilosa miombo forest showing overalllargest median diameter at breast height(median dbh= 105 cm).Figure 1.Species diversity in forest localities in the three study sites. Shannon diversity index wassignificantly different between forest types in Kilwa (a) but not in Handeni (b) and Kilosa (c).See text for test statistics.110
Proceedings <strong>of</strong> the first Climate Change Impacts, Mitigation and Adaptation Programme Scientific Conference, 2012Figure 2. Species diversity across the three study sites (spatial differences). There was an almostsignificant difference between Kilwa & Handeni study areas (F = 3.281; p = 0.055).3.2 Assemblages <strong>of</strong> forestcommunities in the study areaA non-metric multidimensional scaling(NMDS) <strong>of</strong> the tree samples from thestudy sites is shown in Figure 3a. TheSIMPROF test performed under clusteranalysis indicated internal structuring <strong>of</strong>the forest communities among studylocalities (Pi = 2.52; p = 0.1%). One wayanalysis <strong>of</strong> similarity (ANOSIM) alsoshowed strongly distinct assemblages <strong>of</strong>forest communities across the study sites(Global R = 0.673, p = 0.1%; Figure 3b ).The assemblages were particularlydifferent between Kilosa and Kilwa(Global R = 0.802, p = 0.1%) and betweenKilwa and Handeni (Global R = 0.85, p =0.1%) but less so between Kilosa andHandeni (Global R = 0.312, p = 0.1%).Further, analysis <strong>of</strong> similarity percentages(SIMPER) <strong>of</strong> forest communities betweenlocalities indicated the surveyed forestcommunities in Kilwa were similar foronly 27.79 % while Kilosa forestcommunities were similar for 17.35% andHandeni, 26.41%. Further examination <strong>of</strong>species contribution to the observedassemblages showed considerabledifferences between and among forestcommunities in the study area.Pseudolachnostylis glauca was thedominant tree species in Kilwa(contribution, 27.85%) and contributedmost (7.13%; average dissimilarity 6.98 ±1.39) to the observed average dissimilaritybetween Kilwa and Kilosa communityassemblages (97.92%). The dominantspecies in Handeni was Combretum molle(contribution, 25.89%) while Brachystegiaspiciformis dominated in Kilosa forestcommunities (contribution, 30.64%). Onthe contrary, the average dissimilaritybetween Kilwa and Handeni forestcommunity assemblages (91.62%) was dueto Brachystegia spiciformis which had anaverage contribution <strong>of</strong> 6.80% (Averagedissimilarity 6.23 ± 1.46) over otherspecies in the study area.111
Proceedings <strong>of</strong> the first Climate Change Impacts, Mitigation and Adaptation Programme Scientific Conference, 2012Transform: Square rootResemblance: S17 Bray Curtis similarityKH3KH2HH2HH1KH1KP3KP2GM3KP1GM2KM2GM1KM3KG3MT1MT3KW2KK1KW1KW3KK32D Stress: 0.08MT2Sites123Similarity2060KM1KG2KK2HH3KG1Figure 3a. Similarity among forest communities in the study areas, Kilwa (1), Kilosa (2) and Handeni (3).Figure 3b. Assemblages <strong>of</strong> the study forests showing distinct forest communities; 1, 2, and 3 based onBray –Curtis similarity <strong>of</strong> the samples as analyzed under program PIMER v6. There wereclear structuring <strong>of</strong> the species in samples from across the study sites, Kilwa, Kilosa andHandeni (Global R = 0.673, p = 0.1%, see text for details).3.3 Initial carbon stocking in trees,soil and grass biomassInitial carbon stocking in trees, soil andgrass biomass varied among and betweensites (Table 2). Across the study area, therewere no significant differences in treecarbon stocks among trees <strong>of</strong> dbh>4
Proceedings <strong>of</strong> the first Climate Change Impacts, Mitigation and Adaptation Programme Scientific Conference, 2012biomass carbon by loss in ignition methodindicated differences among local forestsin Kilwa (ANOVA, F = 6.102, df = 2, p =0.006). Multiple comparison with a Sidakpost-hoc test revealed differences was onlybetween Kikole and Mitundumbeya forestreserves (p = 0.004) which are managedunder the village and district governmentauthorities respectively. Soil carbonshowed similar pattern (F = 4.734; df = 2;p = 0.056) all across the forest reserves inKilwa. Also, soil carbon content <strong>of</strong> thesurveyed plots indicated significantdifferences between the study sites in thethree districts (ANOVA, F = 125.565, df =2, p = 0.0001) with the differenceoccurring among all sites. The generalpicture from Table 2 is that early burningis better for carbon storage than lateburning or no burning. The only exceptionbeing Handeni, but the result here mightbe caused by the late burning plot onlyconsisting <strong>of</strong> large trees.Table 2. Initial carbon content in trees and soil at the study locations and sites that will form a basis forsubsequent monitoring at the experimental plotsStudyforest sites Tree carbon in tree size classes and burning regime Soil carbonTotal Mean soil CKilwa Fire regime d10 cm d≥10 cm C(t/ha) (SD)RangeEarly burning* 0.92 33.08 34 2.408 ± 0.946 0.90 - 5.48Late burning* 0.76 20.98 21.72No burning* 0.67 27.7 28.36Handeni Early burning* 0.37 21.06 21.43 5.438 ± 1.315 2.48 - 8.75Late burning* 0 24.71 24.71No burning* 0.07 18.83 18.91Kilosa Early burning* 0.18 44.73 44.92 7.311 ± 1.638 4.44 - 10. 9Late burning* 1.23 22.23 23.37No burning* 0 22.09 22.09*This indicates initial data pr<strong>of</strong>iles at the beginning <strong>of</strong> the field experimental treatments. These data will bereferred to as benchmark in subsequent burning treatments over the period <strong>of</strong> the research project.4.0 DiscussionThis study documents composition andstructure as well as carbon stocking <strong>of</strong>miombo forests under differentmanagement regimes based on initial datacollected in situ. Ours is the first studydescribing community assemblages <strong>of</strong>miombo woodland in East and north–eastern Tanzania that receive varyingmanagement efforts.4.1 Tree species and communitystructure <strong>of</strong> the miombo woodlandThe number <strong>of</strong> tree species recorded forthis study was higher than previouslyrecorded for other miombo forestselsewhere in Tanzania (Chamshama et al.,2004; Shirima et al., 2011; Zahabu, 2008).We enumerated more than 200 specieswhile these studies recorded less than 100species although all studies included trees> 4 cm DBH. The difference between thecurrent study and these studies could bedue to high forest productivity in the moistcoastal region as opposed to the hinterlandforest communities. Further, speciescomposition <strong>of</strong> the surveyed forestsdepicted regional variation between Kilosaand other sites (Handeni and Kilwa).Perhaps this was attributable to differentlevels <strong>of</strong> forest disturbances these forestsare being subjected to (Banda et al. 2006).Kilosa in particular recorded highest level<strong>of</strong> forest disturbances such as livestockgrazing, wildfires and loggingcorroborating with previous findings inthis area (Backeus et al., 2006).However, the forest showed secondary113
Proceedings <strong>of</strong> the first Climate Change Impacts, Mitigation and Adaptation Programme Scientific Conference, 2012regeneration with lots <strong>of</strong> trees regeneratingafter disturbances. Further, thedisturbances recorded (particularly due t<strong>of</strong>ires and trees or pole cutting) in the studysites also may in part indicate differentmanagement inputs under which theseforests are given by different authorities.There was generally high level <strong>of</strong> forestdisturbances in the forests managed by thelocal government followed by those undercentral government.The Shannon diversity index <strong>of</strong> the studyforests indicates that all the forestcommunities are relatively diverse in treespecies compared with other miomb<strong>of</strong>orests in the lowland and Eastern Arcmountains forests (Luoga 2000; Pare´2008; Shirima et al. 2011). The spatialdifferences in species composition anddiversity among study sites could be due togeographic locations <strong>of</strong> individual forestsand land use history (Mapaure, 2001;Chidumayo, 2002). Kilwa recordedhighest tree diversity (Shannon index =2.011 over Handeni and Kilosa, 1.503,1.812) perhaps because <strong>of</strong> environmentaland edaphic factors influenced by coastalclimates leading to high productivity incoastal forest than is in other areas(Backeus et al., 2006; Haddad et al.,2008). The local variations in speciesdiversity between forest communitieswithin Kilosa and Handeni study siteswere attributable to local differences indisturbance regimes as has been explainedby an intermediate disturbance hypothesiswhich indicates that habitat disturbanceinfluences species diversity more in drythan in moist forests (Bangor et al., 2009).Both Handeni and Kilosa forestcommunities had many trees <strong>of</strong> the generaCombretum, Kigelia, Chassalia,Markhamia, Pseudolachnostylis, andSyzygium whose presence indicatedisturbance and hydrological influences(Backeus et al. 2006; Banda et al. 2006).Although species diversity increases atintermediate level <strong>of</strong> disturbance (Haddadet al. 2008), this cannot explain thevariation <strong>of</strong> species diversity among thehumid forest communities in KilwaDistrict where disturbances were veryminimal, rather could be a reflection <strong>of</strong>local variability in plant water availabilitydue to environmental factors such as soilfertility, topography and local hydrologyacting to shape the functional dynamics <strong>of</strong>the forest communities (Oksanen &Minchin 2002; Sheil & Burslem 2003; terSteege et al. 2006). Also these factors maypartly explain the observed internalstructuring <strong>of</strong> forest communities amongstudy localities. Similarly these localassemblages could be caused by differingmanagement regimes by the central, localand village governing bodies. Further,there were strongly distinct forestcommunities between the study sitesdepicting differences between Kilwa andKilosa or Handeni. Contributed bydifferent species, these assemblages maybe due to spatial variability in rainfallpattern, soil nutrient dynamics and localdynamics <strong>of</strong> plant communities betweenthe sites.4.2 Carbon stocking in miomb<strong>of</strong>orestsThe carbon content <strong>of</strong> the standing treebiomass was lower in young than in oldtrees (> 10 cm dbh) because the rate <strong>of</strong>carbon accumulation increases with thegrowth stage <strong>of</strong> the plants (Amichev et al.,2008). Also, our data indicated spatial andlocal variability in carbon storage amongstthe study forests reserves because <strong>of</strong>variation in growth forms, as well asspecies composition and abundance (Table4). Kilosa contributed highest to the treeabundance total with most <strong>of</strong> the trees inthe reserves having a dbh <strong>of</strong> > 10 cm, thusresulting in higher carbon stored in Kilosathan other forest sites in Kilwa andHandeni. The range <strong>of</strong> carbon stored intrees (21.42 – 44.92 t/ha) in the studyforest reserves is higher than the rangereported previously for miombo woodlandin the Eastern Arc mountains (13 – 30 MgC/ha, Shirima et al., 2011) as well as for114
Proceedings <strong>of</strong> the first Climate Change Impacts, Mitigation and Adaptation Programme Scientific Conference, 2012the southern highland miombo forests(17.9 – 20.4 t/ha, Munishi et al., 2010).However, this range was lower thanpublished for afromontane forests in theEastern Arc Mountains (Munishi & Shear,2004). Further, the differences in carbonestimates <strong>of</strong> the soil samples among studysites were due to variability in localenvironmental factors such as soil nutrientdynamics as well as rainfall pattern.Differences in ecology and the reasonswhy people lit fires in the different regionswill be addressed in a future article.5.0 ConclusionThis study reports preliminary findings <strong>of</strong>a big research project based on initial dataavailable during the first phase <strong>of</strong> datacollection in the field. We have describedthe structure and composition as well asinitial carbon stocks <strong>of</strong> forest reservesunder different management authorities.The forest reserves are diverse andcomprise <strong>of</strong> distinct forest communitiesdue to various species assemblages inthem. The data reported here will be usedas benchmark to monitor the variability incarbon stocking on study plots set out inKilwa, Handeni and Kilosa forest reserveswhere burning treatments will beperformed and monitored over the threeyears in order to develop a strategy toreducing wildfires in miombo woodlands<strong>of</strong> Tanzania. Preliminarily, it is however,concluded that: There were local differences in treeabundance in the surveyed plots andmore than 200 different species <strong>of</strong>trees and shrubs were recorded andKilosa site contributed to the largestproportion (40.7%) <strong>of</strong> the treeabundance total, followe by Kilwa andHandeni each contributing (35.6%) and(20.7%) Species richness and diversity variedconsiderably within and between thestudy sites, Kilwa and the villageforests giving the highest speciesrichness and diversityOn the average carbon content <strong>of</strong> thestanding tree biomass was lower inyoung than in old trees. Similarly thereis an indication that village forestshave higher stock <strong>of</strong> carbon than thecentral government and localgovernment forests.On the average early burning is betterfor carbon storage than late burning orno burningAcknowledgementThis work is part <strong>of</strong> a large researchproject working towards developing firereduction strategy as a potential tool forcarbon sequestration in miombo woodland,Tanzania. Authors would like to thank theClimate Change Impacts and Mitigation(CCIAM) program for funding theresearch over a three year period. Wethank numerous local botanists and villageleaders for facilitating smooth field workand to Nurman Amanzi and CharlesKilawe and Dr. Ever Mtengeti for helpingin data collection,and analysis.ReferencesAloo, I. 2001. <strong>Forest</strong> fires in Tanzania. Lecturenotes for MNRSA short courseparticipants. SUA, Morogoro, Tanzania(Unpublished)Amichev, B.Y. Burger, J.A. & Rodrigue, J. A.2008. Carbon sequestration by forests andsoils on mined land in the Midwestern andAppalachian coalfields <strong>of</strong> the U.S. <strong>Forest</strong>Ecology and Management 256:1949-1959Campbell, B. 1996. The miombo in transition:Woodlands and welfare in Africa. CIFOR,Bogor, IndonesiaCampbell, B., Frost, P. & Byron, N.1996. Miombowoodlands and their use: overview andkey issues. In: The Miombo in Transition:Woodlands and Welfare in Africa (Ed. B.Campbell). CIFOR, Bogor.Campbell, B.M., Angelsen, A., Cunningham, A.,Katerere, Y., Sitoe, A., and Wunder, S.2008 Miombo woodland: opportunitiesand barriers to sustainable forestmanagement. CIFOR, Bogor.Chamshama, S.A.O., Mugasha, A.G. & Zahabu, E.2004. Stand biomass and volumeestimation for miombo woodlands atKitulangalo, Morogoro, Tanzania. J. S.Afr. For. 200: 59- 64.115
Proceedings <strong>of</strong> the first Climate Change Impacts, Mitigation and Adaptation Programme Scientific Conference, 2012Chidumayo, E.N., 2002. Changes in miombowoodland structure under different landtenure and use systems in central Zambia.J. Biogeogr. 29, 1619–1626.Clarke, K.R. & R.N. Gorley. 2006. PRIMER v6:User Manual/Tutorial. Primer-E Ltd,Plymouth. 190 pp.Clarke, K.R. & R.M. Warwick. 2001. Change inmarine communities: an approach tostatistical analysis and interpretation, 2 ndedition. Primer-E Ltd, PlymouthColwell, R.K. & J.A. Coddington, 1994. Estimatingterrestrial biodiversity throughextrapolation. Philosophical Transactions<strong>of</strong> the Royal Society <strong>of</strong> London B 345:101-118.Backeus I, Petterson B, Stromquist L, Ruffo C.2006. Tree communities and structuraldynamics in Miombo (Brachystegia –Julbernardia) woodland, Tanzania. J. For.Ecol. Manage., 230: 171-178.Banda, T., Schwartz b M.W., and T. Caro. 2006.Woody vegetation structure andcomposition along a protection gradient ina miombo ecosystem <strong>of</strong> western Tanzania.J. For. Ecol. Manage., 230: 179-185.Brown, S. & Lugo, A. E. 1990. Tropical secondaryforests. Journal <strong>of</strong> Tropical Ecology 6:1-32Bongers, F., Poorter, L., Hawthorne, W.D. and D.Sheil. 2009. The intermediate disturbanceEcol. Letters, doi: 10.1111/j.1461-0248.2009.01329.xDixon, R. K., Brown, S., Houghton, R.A.,Solomon, A.M., Trexler, M.C. andWisniewski, J. 1994. Carbon pools andflux <strong>of</strong> global forest ecosystems. Science263:185-190.Frost, P. 1996. The ecology <strong>of</strong> miombo woodlands.In: The Miombo in Transition: Woodlandsand Welfare in Africa (Ed. B.Campbell).CFIOR, Bogor.Haddad, N.M., Holyoak, M., Mata, T.M., Davies,K.F., Melbourne, B.A. & Preston, K.2008. Species traits predict the effects <strong>of</strong>disturbance and productivity on diversity.Ecol. Lett. 11, 348–356.Houghton, R. A., Unruh, J. D. & Lefebvre, P. A.1993. Current land cover in the tropics andits potential for sequestering carbon.Global Biogeochemical Cycles 7:305-320IPCC 2007. Climate Change 2007: The Fourth<strong>Assessment</strong> Report. Impacts, Adaptation,and Vulnerability. Cambridge <strong>University</strong>PressKideghesho J, Røskaft E, and Kaltenborn B. 2007.Factors influencing conservation attitudes<strong>of</strong> local people in western Serengeti,Tanzania. Biodiversity and Conservation16(7):2213-2230.Kikula, I. S. 1989. Spatial changes in forest coveron the East Usambara Mountains. In : A.C.Hamilton & R. Bensted-Smith (Eds).<strong>Forest</strong> Conservation in the East UsambaraMountains Tanzania. IUCN, Gland,Switzerland. Pp 79-86.K¨orner, C. and Arnone III, J. A.1992. Responsesto elevated carbon dioxide in artificialtropical ecosystems. Science 257:1672-1675Lugo, A. E. and Brown, S.1992. Tropical <strong>Forest</strong>sas Sinks <strong>of</strong> Atmospheric Carbon. <strong>Forest</strong>Ecology and Management. 54:239-255.Luoga, E.J. 2000. The effects <strong>of</strong> human disturbanceon diversity and dynamics <strong>of</strong> EasternTanzania miombo arborescent species.Ph.D. Thesis. Witwatersrand <strong>University</strong>.Johannesburg, South Africa.Ludwig, A.J., Reynolds, F.J., 1988. StatisticalEcology: a primer <strong>of</strong> methods andcomputing. Wiley Press, New York. 337pp.Magurran, A.E., 1988. Ecological Diversity and ItsMeasurement. Croom Helm, London, UK.179 pp.Malimbwi, R.E., Solberg, B. & Luoga, E. 1994.Estimate <strong>of</strong> biomass and volume inmiombo woodland at Kitulangalo <strong>Forest</strong>Reserve, Tanzania. J. Trop. For. Sci.7:230–242.Mapaure, I., 2001. Small-scale variation in speciescomposition <strong>of</strong> miombo woodlands inSengwa, Zimbabwe: the influence <strong>of</strong>edaphic factors, fire and elephantherbivory. Syst. Geogr. Pl. 71:935–947.MNRT, 2001. National <strong>Forest</strong> programme inTanzania 2001-2010. Governmentprinter, Dar-es-Salaam, tanzania. 59pp.Mueller-Dombois, D. 2001. Biological invasionsand fire in tropical biomes. In K.E.M.Galley and T.P. Wilson, eds. Proc. <strong>of</strong> theinvasive species workshop, p. 112-121Misc. Pubulications 11. Tallahassee,Florida, USA, Tall Timbers ResearchStationMunishi, P.K.T. & Shear, T.H. 2004. Carbonstorage in afromontane rain forests <strong>of</strong> theeastern arc mountains <strong>of</strong> Tanzania: theirnet contribution to atmospheric carbon. J.Trop. For.Sci. 16, 78–98.Munishi, P.K.T., Mringi, S., Shirima, D.D. &Linda, S.K. 2010. The role <strong>of</strong> the miombowoodlands <strong>of</strong> the southern highlands <strong>of</strong>Tanzania as carbon sinks. J. Ecol. Nat.Environ. 2(12), 261–269.Mutanga, E., 2009. Management <strong>of</strong> miombo forestresources by communities, is it a reality?A discussion <strong>of</strong> corner stones for effectivecommunity forestry management tosupport resource commercialization,116
Proceedings <strong>of</strong> the first Climate Change Impacts, Mitigation and Adaptation Programme Scientific Conference, 2012Southern Alliance for IndigenousResourcesOksanen, J. & Minchin, P.R. 2002. Continuumtheory revisited: what shape are speciesresponses along ecological gradients?Ecol. Mod., 157, 119–129.Osborne, P. L., 2000, Tropical Ecosystems andEcological Concepts, Cambridge<strong>University</strong> Press, Cambridge, UK.Pare´, S. 2008. Land use dynamics, tree diversityand local perception <strong>of</strong> dry forest decline.In: Southern Burkina Faso, West Africa.Thesis (PhD) submitted to Swedish<strong>University</strong> <strong>of</strong> Agricultural Sciences.Salati, E. and Vosep, B. 1984. Amazon Basin: Asystem in equilibrium. Science, 225:129-138.Sheil, D. & Burslem, D.F.R.P. 2003. Disturbinghypotheses in tropical forests. TrendsEcol. Evol., 18, 18–26.Silver, W. L., 1998. The potential effects <strong>of</strong>elevated CO 2 and climate change ontropical forest biogeochemical cycling.Climatic Change 39:337-361Shirima D.D., Munishi P.K.T., Lewis, S.L.,Burgess, N.D., Marshall, A.R., Balmford,A., Swetnam R.D. & E.M. Zahabu. 2011.Carbon storage, structure and composition<strong>of</strong> miombo woodlands in Tanzania’sEastern Arc Mountains. Afr. J. Ecol49:332-342Silver, W. L., Ostertag R., Lugo, A. E., 2000. Thepotential for carbon sequestration throughreforestation <strong>of</strong> abandoned tropicalagricultural and pasture lands.Restoration Ecology 8:394-407.ter Steege, H., Pitman, N.C.A., Phillips, O.L.,Chave, J., Sabatier, D., Duque, A. 2006.Continental-scale patterns <strong>of</strong> canopy treecomposition and function acrossAmazonia. Nature, 443:444–447117