Problem Set 6
Problem Set 6
Problem Set 6

Create successful ePaper yourself
Turn your PDF publications into a flip-book with our unique Google optimized e-Paper software.
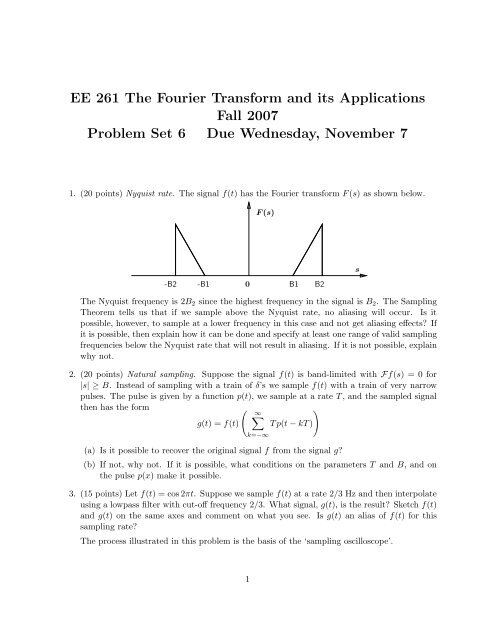
EE 261 The Fourier Transform and its ApplicationsFall 2007<strong>Problem</strong> <strong>Set</strong> 6 Due Wednesday, November 71. (20 points) Nyquist rate. The signal f(t) has the Fourier transform F (s) as shown below.F (s)-B2-B10 B1 B2sThe Nyquist frequency is 2B 2 since the highest frequency in the signal is B 2 . The SamplingTheorem tells us that if we sample above the Nyquist rate, no aliasing will occur. Is itpossible, however, to sample at a lower frequency in this case and not get aliasing effects? Ifit is possible, then explain how it can be done and specify at least one range of valid samplingfrequencies below the Nyquist rate that will not result in aliasing. If it is not possible, explainwhy not.2. (20 points) Natural sampling. Suppose the signal f(t) is band-limited with Ff(s) =0for|s| ≥B. Instead of sampling with a train of δ’s we sample f(t) withatrainofverynarrowpulses. The pulse is given by a function p(t), we sample at a rate T , and the sampled signalthen has the form( ∞)∑g(t) =f(t) Tp(t − kT)k=−∞(a) Is it possible to recover the original signal f from the signal g?(b) If not, why not. If it is possible, what conditions on the parameters T and B, andonthe pulse p(x) make it possible.3. (15 points) Let f(t) =cos2πt. Suppose we sample f(t) atarate2/3 Hz and then interpolateusing a lowpass filter with cut-off frequency 2/3. What signal, g(t), is the result? Sketch f(t)and g(t) on the same axes and comment on what you see. Is g(t) an alias of f(t) forthissampling rate?The process illustrated in this problem is the basis of the ‘sampling oscilloscope’.1
4. (15 points) More on sampling. Let g(t) be an integrable, band-limited signal with Fg(s) =0for |s| ≥p/2. Express the integral∫ ∞−∞g(t) dtin terms of sample values of g. What is the minimum sampling rate that will allow us to dothis?5. (15 points) Matlab Exercise on Sampling: Obtain the image ‘man.eps’ from the class website(http://eeclass.stanford.edu/ee261/). http://see.stanford.edu/materials/lsoftaee261/man.gifThe link is in the ‘<strong>Problem</strong> <strong>Set</strong>s and Solutions’ section.(a) Load the 8-level gray-scale 256x256 image in Matlab using ‘imread’ command. Convertthe matrix image into a vector of length 256 2 (using Matlab’s ‘:’ command) and call itthe ‘time-domain’ signal x(n). Change the values in x(n) from type ‘uint8’ to ‘double’.Normalize it such that the maximum signal value is 1.(b) Find the Fourier transform X(f) ofx(n) using the FFT command, where X(f) haslength the same length as x(n). Plot the ( magnitude ) response of X(f) centered at 0 i.e.on the X-axis, f ranges from − 25622to 256 22− 1 (total 256 2 points).(c) Define the ‘bandwidth’, N B (α), of the signal x(n) as the frequency values that containfraction α of the total energy. Mathematically, this is equivalent toE total E m N B (α) 2p s.t.f= 25622 −1∑f=− 25622f=m∑f=−m|X(f)| 2|X(f)| 2E pE total= αFor the following α values, α =0.9, 0.95, 0.99, sample the signal x(n) atthecorrespondingNyquist rate. In order to sample x(n) atarate 1 r, simply pick every rthvalue in x(n), so that the resulting sampled-signal x s (n) will be of length 2562r. Findthe re-constructed signal ˆx(n) of length 256 2 using interpolation on the sampled-signalx s (n). For each value of α, the methods to be used for interpolation are (i) replicationby nearest-neighbor and (ii) linear. In the two interpolation schemes, reconstruction ofany point has contributions from 1 and 2 nearest neighbors respectively. Display thesignal ˆx(n) as a 256x256 image. Submit the original image, the 6 reconstructed imagesand Matlab code. Briefly explain the artifacts seen in the reconstructed images. Matlabcommandsimagesc(); colormap(’gray’)can be used to display the image.2