Illicit Financial Flows from Developing Countries ... - culturaRSC.com
Illicit Financial Flows from Developing Countries ... - culturaRSC.com
Illicit Financial Flows from Developing Countries ... - culturaRSC.com
- No tags were found...
You also want an ePaper? Increase the reach of your titles
YUMPU automatically turns print PDFs into web optimized ePapers that Google loves.
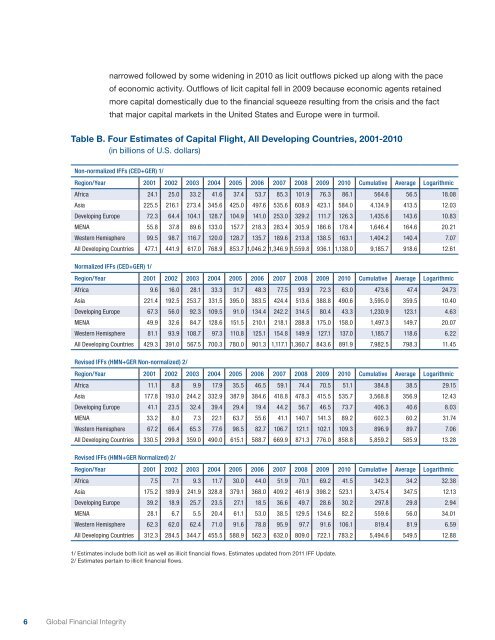
narrowed followed by some widening in 2010 as licit outflows picked up along with the paceof economic activity. Outflows of licit capital fell in 2009 because economic agents retainedmore capital domestically due to the financial squeeze resulting <strong>from</strong> the crisis and the factthat major capital markets in the United States and Europe were in turmoil.Table B. Four Estimates of Capital Flight, All <strong>Developing</strong> <strong>Countries</strong>, 2001-2010(in billions of U.S. dollars)Non-normalized IFFs (CED+GER) 1/Region/Year 2001 2002 2003 2004 2005 2006 2007 2008 2009 2010 Cumulative Average LogarithmicAfrica 24.1 25.0 33.2 41.6 37.4 53.7 85.3 101.9 76.3 86.1 564.6 56.5 18.08Asia 225.5 216.1 273.4 345.6 425.0 497.6 535.6 608.9 423.1 584.0 4,134.9 413.5 12.03<strong>Developing</strong> Europe 72.3 64.4 104.1 128.7 104.9 141.0 253.0 329.2 111.7 126.3 1,435.6 143.6 10.83MENA 55.8 37.8 89.6 133.0 157.7 218.3 283.4 305.9 186.6 178.4 1,646.4 164.6 20.21Western Hemisphere 99.5 98.7 116.7 120.0 128.7 135.7 189.6 213.8 138.5 163.1 1,404.2 140.4 7.07All <strong>Developing</strong> <strong>Countries</strong> 477.1 441.9 617.0 768.9 853.7 1,046.2 1,346.9 1,559.8 936.1 1,138.0 9,185.7 918.6 12.61Normalized IFFs (CED+GER) 1/Region/Year 2001 2002 2003 2004 2005 2006 2007 2008 2009 2010 Cumulative Average LogarithmicAfrica 9.6 16.0 28.1 33.3 31.7 48.3 77.5 93.9 72.3 63.0 473.6 47.4 24.73Asia 221.4 192.5 253.7 331.5 395.0 383.5 424.4 513.6 388.8 490.6 3,595.0 359.5 10.40<strong>Developing</strong> Europe 67.3 56.0 92.3 109.5 91.0 134.4 242.2 314.5 80.4 43.3 1,230.9 123.1 4.63MENA 49.9 32.6 84.7 128.6 151.5 210.1 218.1 288.8 175.0 158.0 1,497.3 149.7 20.07Western Hemisphere 81.1 93.9 108.7 97.3 110.8 125.1 154.8 149.9 127.1 137.0 1,185.7 118.6 6.22All <strong>Developing</strong> <strong>Countries</strong> 429.3 391.0 567.5 700.3 780.0 901.3 1,117.1 1,360.7 843.6 891.9 7,982.5 798.3 11.45Revised IFFs (HMN+GER Non-normalized) 2/Region/Year 2001 2002 2003 2004 2005 2006 2007 2008 2009 2010 Cumulative Average LogarithmicAfrica 11.1 8.8 9.9 17.9 35.5 46.5 59.1 74.4 70.5 51.1 384.8 38.5 29.15Asia 177.8 193.0 244.2 332.9 387.9 384.6 418.8 478.3 415.5 535.7 3,568.8 356.9 12.43<strong>Developing</strong> Europe 41.1 23.5 32.4 39.4 29.4 19.4 44.2 56.7 46.5 73.7 406.3 40.6 8.03MENA 33.2 8.0 7.3 22.1 63.7 55.6 41.1 140.7 141.3 89.2 602.3 60.2 31.74Western Hemisphere 67.2 66.4 65.3 77.6 98.5 82.7 106.7 121.1 102.1 109.3 896.9 89.7 7.06All <strong>Developing</strong> <strong>Countries</strong> 330.5 299.8 359.0 490.0 615.1 588.7 669.9 871.3 776.0 858.8 5,859.2 585.9 13.28Revised IFFs (HMN+GER Normalized) 2/Region/Year 2001 2002 2003 2004 2005 2006 2007 2008 2009 2010 Cumulative Average LogarithmicAfrica 7.5 7.1 9.3 11.7 30.0 44.0 51.9 70.1 69.2 41.5 342.3 34.2 32.38Asia 175.2 189.9 241.9 328.8 379.1 368.0 409.2 461.9 398.2 523.1 3,475.4 347.5 12.13<strong>Developing</strong> Europe 39.2 18.9 25.7 23.5 27.1 18.5 36.6 49.7 28.6 30.2 297.8 29.8 2.94MENA 28.1 6.7 5.5 20.4 61.1 53.0 38.5 129.5 134.6 82.2 559.6 56.0 34.01Western Hemisphere 62.3 62.0 62.4 71.0 91.6 78.8 95.9 97.7 91.6 106.1 819.4 81.9 6.59All <strong>Developing</strong> <strong>Countries</strong> 312.3 284.5 344.7 455.5 588.9 562.3 632.0 809.0 722.1 783.2 5,494.6 549.5 12.881/ Estimates include both licit as well as illicit financial flows. Estimates updated <strong>from</strong> 2011 IFF Update.2/ Estimates pertain to illicit financial flows.6 Global <strong>Financial</strong> Integrity


