Illicit Financial Flows from Developing Countries ... - culturaRSC.com
Illicit Financial Flows from Developing Countries ... - culturaRSC.com
Illicit Financial Flows from Developing Countries ... - culturaRSC.com
- No tags were found...

Create successful ePaper yourself
Turn your PDF publications into a flip-book with our unique Google optimized e-Paper software.
fGlobal <strong>Financial</strong> Integrity
hGlobal <strong>Financial</strong> Integrity
Executive SummaryTwo main issues, which arose in the past year, encouraged us to supplement our standardmethodology used to estimate illicit flows based on the World Bank Residual method adjusted fortrade misinvoicing.First, we investigated the net measurement of inward <strong>from</strong> outward capital flight traditionally usedby economists in academic journals. We reaffirm our <strong>com</strong>mitment to a gross outflow approach,rather than a net approach, because only a return of licit capital that is recorded can offset loss ofcapital. The return of unrecorded and illicit capital cannot be used for productive purposes. In otherwords, the gross/net issue is linked to the nature of the capital.Second, we explored the effect of the global financial crisis on both illicit and licit flows, determiningthat the residual method of estimating illicit flows adjusted for trade misinvoicing may include somelicit capital as well as illicit. Moreover, if the CED+GER method includes licit capital, the support fora gross outflows approach is strengthened, as one cannot be sure whether the inward capital flightis licit or illicit in nature. Therefore, we present estimates of illicit flows using both the CED+GERmethod and the conservatively focused Hot Money Narrow method adjusted for trade misinvoicing(HMN+GER).A firm judgment as to which method provides a more accurate method for estimating illicit flowsis somewhat premature at this stage. While the HMN+GER method provides more conservativeestimates of illicit outflows, it may exclude certain illicit transactions such as round-tripped FDIwhich could be erroneously recorded as private sector flows. We invite readers to <strong>com</strong>ment on theappropriateness of the two methodologies for estimating illicit flows including reasons why oneshould be preferred over the other.Using robust (non-normalized) estimates for both measures, we found that in 2010 developingcountries lost between US$858.8 billion to US$1,138 billion, implying that as much as US$279 billionof the higher figure could be licit capital flows of the private sector—outflows that took place as aresult of “normal” portfolio maximizing considerations. While the two estimates were quite close inthe early 2000s, capital market liberalization in many large emerging markets may have encouragedmore licit or “normal” capital flight over the years. The gap between the HMN+GER and CED+GERestimates widened, reaching a peak in 2008 at the onset of the global economic crisis. In thefollowing year, outflows of legal capital flight dropped more sharply than illicit outflows. The lattershowed a steady upward trend for all developing countries more or less immune to macroeconomicshocks and adjustments.<strong>Illicit</strong> <strong>Financial</strong> <strong>Flows</strong> <strong>from</strong> <strong>Developing</strong> <strong>Countries</strong>: 2001-2010i
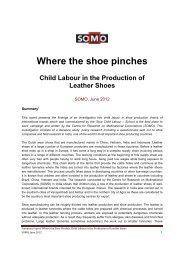
are relatively high imply that estimates of illicit flows <strong>from</strong> these countries must be interpreted withcaution due to the risk of significant measurement errors.lGlobal <strong>Financial</strong> Integrity
Table A. The United States and China: Balance of PaymentsComponents, 1991 1/(in U.S. dollars)Balance of Payments ComponentsScaleUnited States(US$ billions)China(US$ millions)A. Current Account -3.69 13,765.00Capital Account (B+C+D+E+F+H) 4.81 -14,298.00B. Net Equity <strong>Flows</strong> -36.64 4,038.00FDI abroad -27.15 -913.00FDI in the country 11.50 4,366.00Portfolio invest. (corporate equities) -20.99 585.00C. Other short-term capital 6.40 -196.00Other sectors -6.17 -196.00Resident official sector 12.57 0.00D. Portfolio investmentOther bonds 31.64 -8,143.00E. Change in DMB foreign assets -8.80 1,655.00Short-term capital -15.50 558.00Long-term capital 6.70 1,097.00F. Reserves 5.76 -14,537.00H. Other long-term capital 6.45 2,885.00Resident official sector 6.45 2,236.00Other sectors 0.00 649.00G. Net errors and omissions -1.12 533.00Memoranda ItemsBalance of payments check 2/ 0.00 0.00Private sector flows +NEO (C+D+E+G) 28.12 -6,151.00World Bank Residual (A+B+F+H) -28.12 6,151.001/ Corresponds to the format and figures published in the Balance of Payments Yearbook, Part 1, 1992, IMF.The position of items H and G are not in the order that they appear in Recent Estimates of Capital Flight, StijnClaessens and David Naude (1993). As item H is classified under the capital account, the order was switched withitem G.2/ The balance of payments check consists of the fact that the current account plus the capital account and the neterrors and omissions must sum to zero.3/ According to the BOP identity, as pointed out by Claessens and Naude, the BOP equation implies that C+D+E+G= -(A+B+F+H). The last two line items verify this for the United States and China.8. One could estimate capital flight using either the left- or right-hand side of the above equation—the result will be equivalent. Table A demonstrates that the World Bank Residual estimatesof capital flight can be derived using the 1991 balance of payments data reported by Chinaand the United States to the IMF. Because the classification of the balance of payments itemsis consistent with those used by Claessens and Naudé in accordance with the Balance ofPayments Manual in effect at the time, we had to use the data published in the 1992 Balance ofPayments Yearbook. The reported data show that, in fact, the right hand side of the equation(private sector capital flows plus the NEO) is equal to the World Bank Residual estimate basedon change in external debt (with sign reversed). This implies that the illicit <strong>com</strong>ponent of the CEDmethod (i.e., the NEO) is simply the difference between the CED estimates and private sector licitflows. Hence, more conservative estimates of illicit flows are based on the illicit <strong>com</strong>ponent of theCED plus trade misinvoicing based on the gross excluding reversals (GER) method.4 Global <strong>Financial</strong> Integrity
9. According to the above formulation, a narrower version of illicit flows can be derived simply byadding the NEO to the GER estimates of trade misinvoicing. The NEO has been traditionallyused by economists as the Hot Money Narrow (HMN) method. As we pointed out in our 2008study, there are three versions of the Hot Money method, starting with the Narrow version andprogressively including more types of private sector flows. 3 The broader Hot Money measuresyield larger estimates of capital flight. However, the broader Hot Money method suffers<strong>from</strong> the same drawback as the World Bank Residual method: both methodologies produceestimates that could include both licit and illicit flows. This goes against the purpose of GFIstudies, which is to look solely at illicit flows.Chart 1. Volume of <strong>Illicit</strong> <strong>Financial</strong> <strong>Flows</strong> in Nominal Terms<strong>from</strong> All <strong>Developing</strong> <strong>Countries</strong> 2001-2010 1/!"#$%&'(&)*+,-.&*/&0++121%&314#421#+&3+*56&14&7*-14#+&8.$-6&/$*-&9++&(in millions of U.S. dollars):.;.+*??'@>?'?&'A&B14&-1++1*46&*/&C(D(&E*++#$6F&($&!!$!!!"($%!!$!!!"($#!!$!!!"($!!!$!!!"'!!$!!!"&!!$!!!"%!!$!!!"#!!$!!!"!"#!!(" #!!#" #!!)" #!!%" #!!*" #!!&" #!!+" #!!'" #!!," #!(!"-./0/.12345678"9::;"?@A>BC"-.12345678"9::;"?@A>BC"B7D5;78"9::;"B"-.//.12C"B7D5;78"9::;"B"-.12C"10. Licit capital flight can be simply estimated as the difference between the World Bank Residualestimates and the HMN. Chart 1 plots normalized and non-normalized estimates basedon the CED+GER and the HMN+GER methods. The green and the purple lines representnon-normalized CED+GER and HMN+GER estimates which are also presented in TableB. 4 We can see that in the early 2000s, the two lines were quite close. The gap betweenthe two lines, representing licit capital flight, increased as capital controls were eased inmany large emerging markets such as in Brazil, China, India, Mexico, and Russia. The gapis widest in 2008, at the onset of the global economic crisis. Then in the following year, asoutflows of legal capital flight dropped much more sharply than did illicit outflows, the gap3Reference, <strong>Illicit</strong> <strong>Financial</strong> <strong>Flows</strong> <strong>from</strong> <strong>Developing</strong> <strong>Countries</strong>: 2002-2006, Dev Kar and Devon Cartwright-Smith,Global <strong>Financial</strong> Integrity, December 2008, pp. 4-5.4See Kar, Dev, and Sarah Freitas, <strong>Illicit</strong> <strong>Financial</strong> <strong>Flows</strong> <strong>from</strong> <strong>Developing</strong> <strong>Countries</strong> Over the Decade Ending 2009,Global <strong>Financial</strong> Integrity, 2011 for details on the process of normalization.<strong>Illicit</strong> <strong>Financial</strong> <strong>Flows</strong> <strong>from</strong> <strong>Developing</strong> <strong>Countries</strong>: 2001-20105
narrowed followed by some widening in 2010 as licit outflows picked up along with the paceof economic activity. Outflows of licit capital fell in 2009 because economic agents retainedmore capital domestically due to the financial squeeze resulting <strong>from</strong> the crisis and the factthat major capital markets in the United States and Europe were in turmoil.Table B. Four Estimates of Capital Flight, All <strong>Developing</strong> <strong>Countries</strong>, 2001-2010(in billions of U.S. dollars)Non-normalized IFFs (CED+GER) 1/Region/Year 2001 2002 2003 2004 2005 2006 2007 2008 2009 2010 Cumulative Average LogarithmicAfrica 24.1 25.0 33.2 41.6 37.4 53.7 85.3 101.9 76.3 86.1 564.6 56.5 18.08Asia 225.5 216.1 273.4 345.6 425.0 497.6 535.6 608.9 423.1 584.0 4,134.9 413.5 12.03<strong>Developing</strong> Europe 72.3 64.4 104.1 128.7 104.9 141.0 253.0 329.2 111.7 126.3 1,435.6 143.6 10.83MENA 55.8 37.8 89.6 133.0 157.7 218.3 283.4 305.9 186.6 178.4 1,646.4 164.6 20.21Western Hemisphere 99.5 98.7 116.7 120.0 128.7 135.7 189.6 213.8 138.5 163.1 1,404.2 140.4 7.07All <strong>Developing</strong> <strong>Countries</strong> 477.1 441.9 617.0 768.9 853.7 1,046.2 1,346.9 1,559.8 936.1 1,138.0 9,185.7 918.6 12.61Normalized IFFs (CED+GER) 1/Region/Year 2001 2002 2003 2004 2005 2006 2007 2008 2009 2010 Cumulative Average LogarithmicAfrica 9.6 16.0 28.1 33.3 31.7 48.3 77.5 93.9 72.3 63.0 473.6 47.4 24.73Asia 221.4 192.5 253.7 331.5 395.0 383.5 424.4 513.6 388.8 490.6 3,595.0 359.5 10.40<strong>Developing</strong> Europe 67.3 56.0 92.3 109.5 91.0 134.4 242.2 314.5 80.4 43.3 1,230.9 123.1 4.63MENA 49.9 32.6 84.7 128.6 151.5 210.1 218.1 288.8 175.0 158.0 1,497.3 149.7 20.07Western Hemisphere 81.1 93.9 108.7 97.3 110.8 125.1 154.8 149.9 127.1 137.0 1,185.7 118.6 6.22All <strong>Developing</strong> <strong>Countries</strong> 429.3 391.0 567.5 700.3 780.0 901.3 1,117.1 1,360.7 843.6 891.9 7,982.5 798.3 11.45Revised IFFs (HMN+GER Non-normalized) 2/Region/Year 2001 2002 2003 2004 2005 2006 2007 2008 2009 2010 Cumulative Average LogarithmicAfrica 11.1 8.8 9.9 17.9 35.5 46.5 59.1 74.4 70.5 51.1 384.8 38.5 29.15Asia 177.8 193.0 244.2 332.9 387.9 384.6 418.8 478.3 415.5 535.7 3,568.8 356.9 12.43<strong>Developing</strong> Europe 41.1 23.5 32.4 39.4 29.4 19.4 44.2 56.7 46.5 73.7 406.3 40.6 8.03MENA 33.2 8.0 7.3 22.1 63.7 55.6 41.1 140.7 141.3 89.2 602.3 60.2 31.74Western Hemisphere 67.2 66.4 65.3 77.6 98.5 82.7 106.7 121.1 102.1 109.3 896.9 89.7 7.06All <strong>Developing</strong> <strong>Countries</strong> 330.5 299.8 359.0 490.0 615.1 588.7 669.9 871.3 776.0 858.8 5,859.2 585.9 13.28Revised IFFs (HMN+GER Normalized) 2/Region/Year 2001 2002 2003 2004 2005 2006 2007 2008 2009 2010 Cumulative Average LogarithmicAfrica 7.5 7.1 9.3 11.7 30.0 44.0 51.9 70.1 69.2 41.5 342.3 34.2 32.38Asia 175.2 189.9 241.9 328.8 379.1 368.0 409.2 461.9 398.2 523.1 3,475.4 347.5 12.13<strong>Developing</strong> Europe 39.2 18.9 25.7 23.5 27.1 18.5 36.6 49.7 28.6 30.2 297.8 29.8 2.94MENA 28.1 6.7 5.5 20.4 61.1 53.0 38.5 129.5 134.6 82.2 559.6 56.0 34.01Western Hemisphere 62.3 62.0 62.4 71.0 91.6 78.8 95.9 97.7 91.6 106.1 819.4 81.9 6.59All <strong>Developing</strong> <strong>Countries</strong> 312.3 284.5 344.7 455.5 588.9 562.3 632.0 809.0 722.1 783.2 5,494.6 549.5 12.881/ Estimates include both licit as well as illicit financial flows. Estimates updated <strong>from</strong> 2011 IFF Update.2/ Estimates pertain to illicit financial flows.6 Global <strong>Financial</strong> Integrity
11. Charts 2a-2e show the gap between two estimates representing possible legal capital flight<strong>from</strong> the various regions of the developing world. We observe that in the case of developingEurope, the MENA region, and Western Hemisphere (charts 2c -2e)—the gap tends to widenover time, reaching a peak in 2008. In all three regions, licit outflows plunged in 2009 dueto the effects of the crisis in domestic and foreign capital markets noted above. In contrast,Chart 2b indicates that the gap in Asia, which was almost nonexistent in the early 2000s,Chart 2. <strong>Illicit</strong> <strong>Financial</strong> <strong>Flows</strong> by Region, 2001-2010 1/(in millions of U.S. dollars)(#!$!!!"!"#$%&'#(&)*+,-.&*/&0++121%&314#421#+&3+*56&14&Chart 2a. Volume of <strong>Illicit</strong> <strong>Financial</strong> <strong>Flows</strong> in7*-14#+&8.$-6&/$*-&9/$12#:&';;
egan to widen in 2005 and reached a peak in 2008 at the onset of the crisis, closing almost<strong>com</strong>pletely in 2009 as both licit and illicit outflows fell in tandem. In the last year, both typesof flows recovered along with increase in global economic activity. China, Malaysia, thePhilippines, and India led Asia as the major drivers of licit and illicit flows. The relaxation ofcapital controls by these countries over the years perhaps encouraged more legal or “normal”capital flight accounting for the widening regional gap between the CED+GER and HMN+GERmeasures through 2008. Further research is needed in order to analyze the factors driving licitcapital flows <strong>from</strong> the various regions. For instance, legal capital flight seems to be drivingthe widening gap between the two measures in the case of developing Europe. In fact, theCentral Bank of Russia as well as the IMF corroborates the existence of large capital flight<strong>from</strong> the country, which are predominantly recorded private sector outflows.a. Normalization through use of filters12. As Chart 1 showed, the HMN+GER approach to estimating illicit flows is more conservativethan the CED+GER approach, which may include some legitimate private sector capital flows.Chart 3. Normalized vs. Non-normalized GER, 2001-2010(in millions of U.S. dollars)!"#$%&'(&)*$+#,-./0&12(&)*343*$+#,-./0&5678&9::;49:;:&(?(&0*,,#$2@&*!!$!!!")!!$!!!"(!!$!!!"'!!$!!!"&!!$!!!"%!!$!!!"#!!$!!!"!"%!!#" %!!%" %!!&" %!!'" %!!(" %!!)" %!!*" %!!+" %!!," %!#!"-./0/.12345678"9:;" -.12345678"9:;"Moreover, Chart 3 shows that the conservative or normalized GER estimates are so closeto the non-normalized estimates that not much would be gained by generating a range.Therefore, non-normalized GER estimates will be used throughout the remainder of the reportin generating both the HMN+GER and CED+GER estimates.8 Global <strong>Financial</strong> Integrity
III. Trends in <strong>Illicit</strong> <strong>Financial</strong> <strong>Flows</strong> <strong>from</strong><strong>Developing</strong> <strong>Countries</strong> and Regions13. Table B shows estimates of illicit financial flows <strong>from</strong> developing countries based on theHMN+GER and CED+GER methods. Using non-normalized estimates, the data indicatethat on average, developing countries lost between US$585.9 billion to US$918.6 billion perannum over the period 2001-2010. In 2010, they lost a minimum of US$858.8 billion and asmuch as US$1,138.0 billion.14. We also observe that the HMN+GER measure has increased at a faster pace than theCED+GER measure (13.3 percent vs. 12.6 percent). The relatively faster rate of increasein purely illicit outflows is worrisome given that there is no reason for human statisticalerrors (included in both the CED and the HMN measures) to have increased in a systematicmanner throughout the decade. In fact, with the increasing availability and adoption of newtechnologies, and the provision of technical assistance by the IMF to developing countries inorder to build their statistical capacities, one would expect the proportion of statistical errorsto decline over the past decade. 5 The implication is that the significant increase in illicit flowsis likely to result <strong>from</strong> a worsening of governance-related drivers.15. It is somewhat premature to make a definitive judgment as to which method provides amore accurate method for estimating illicit flows. While the HMN+GER method is the mostconservative measure, it may exclude some illicit transactions (such as round-tripped FDI)which show up as recorded private sector flows. We invite our readers to provide <strong>com</strong>mentson the two alternative methodologies and the reasons why one of them should be preferredover the other.16. For the sake of brevity and sharper focus on illicit flows, we shall henceforth confinethe discussion of trends, shares, and country rankings in terms of the HMN+GERestimates. Going by that measure, the increase in illicit flows of over US$500 billion since2001 implies a nominal growth rate of 13.3 percent per annum (Table C). In inflation-adjustedor real terms, illicit flows grew by 8.6 percent per annum on average (Table D), whichexceeded their average rate of economic growth (6.3 percent per annum). About 20.0 percentof total outflows were channeled through balance of payments leakages while the bulk(approximately 80.0 percent) was transferred through the deliberate misinvoicing of externaltrade. Over the decade, the shares of outflows <strong>from</strong> trade misinvoicing and the balance ofpayments have fluctuated. In 2004, trade misinvoicing reached a peak of 86.1 percent of totalIFFs, dropping to a low of 62.3 percent in 2009. However, in 2010 outflows through trademisinvoicing picked up again to reach 64.2 percent of the total (Table C).5There is no evidence that net errors and omissions have a clear increasing pattern to them; reference IMF Committee on Balance ofPayments Statistics, Annual Report 2011, IMF, Table 1, pp. 17-18.<strong>Illicit</strong> <strong>Financial</strong> <strong>Flows</strong> <strong>from</strong> <strong>Developing</strong> <strong>Countries</strong>: 2001-20109
Table C. <strong>Illicit</strong> <strong>Financial</strong> <strong>Flows</strong> by Region in Nominal Terms 1/(millions of U.S. dollars, unless otherwise indicated)HMN (Hot Money Narrow, Balance of Payments <strong>com</strong>ponent)Region/Year 2001 2002 2003 2004 2005 2006 2007Africa 2,597.64 3,221.96 4,147.09 1,705.94 20,296.96 17,871.45 17,825.18Asia 11,425.56 6,430.32 6,696.46 6,656.05 15,306.33 16,869.06 17,679.33<strong>Developing</strong> Europe 12,932.53 11,479.23 15,647.52 10,397.39 16,150.18 9,754.15 27,928.90MENA 12,844.44 4,248.36 4,243.83 2,841.25 51,940.31 44,103.30 31,300.12Western Hemisphere 13,725.55 13,030.16 10,447.70 12,129.15 22,021.10 7,101.79 8,805.86All <strong>Developing</strong> <strong>Countries</strong> 53,525.72 38,410.03 41,182.60 33,729.78 125,714.88 95,699.75 103,539.39GER (Gross Excluding Reversals, Trade Mispricing <strong>com</strong>ponent)Region/Year 2001 2002 2003 2004 2005 2006 2007Africa 8,500.58 5,615.80 5,752.05 16,223.58 15,223.01 28,613.35 41,239.88Asia 166,408.68 186,549.71 237,461.31 326,277.67 372,635.85 367,754.60 401,161.88<strong>Developing</strong> Europe 28,196.78 12,030.67 16,711.71 29,026.61 13,298.00 9,606.50 16,245.02MENA 20,385.49 3,796.51 3,025.28 19,278.57 11,775.39 11,467.04 9,841.22Western Hemisphere 53,459.84 53,411.79 54,841.52 65,463.52 76,459.43 75,583.04 97,921.87All <strong>Developing</strong> <strong>Countries</strong> 258,803.00 246,137.54 303,518.10 421,816.06 463,176.89 466,563.29 528,479.34Total HMN + GERRegion/Year 2001 2002 2003 2004 2005 2006 2007Africa 11,098.22 8,837.76 9,899.14 17,929.52 35,519.97 46,484.80 59,065.06Asia 177,834.24 192,980.03 244,157.77 332,933.72 387,942.18 384,623.66 418,841.21<strong>Developing</strong> Europe 41,129.31 23,509.90 32,359.23 39,424.00 29,448.18 19,360.65 44,173.92MENA 33,229.92 8,044.87 7,269.11 22,119.82 63,715.70 55,570.33 41,141.34Western Hemisphere 67,185.39 66,441.95 65,289.21 77,592.67 98,480.53 82,684.82 106,727.73All <strong>Developing</strong> <strong>Countries</strong> 330,477.08 299,814.50 358,974.46 489,999.73 615,106.56 588,724.27 669,949.26HMN Percent of Total 16.2 12.8 11.5 6.9 20.4 16.3 15.5GER Percent of Total 78.3 82.1 84.6 86.1 75.3 79.2 78.9Source: Staff estimates, Global <strong>Financial</strong> Integrity, based on official balance of payments and trade data reported to the IMF by member countries.1/ Based on cumulative outflows <strong>from</strong> the region in total outflows <strong>from</strong> developing countries over the period 2001-201010 Global <strong>Financial</strong> Integrity
2008 2009 2010 TotalShare of Region inTotal (in %) 1/Percent Change2009-2010Logarithmic Growth2001-201023,488.48 30,941.93 20,755.05 142,851.68 12.23 -49.08 35.5022,225.26 66,647.09 91,726.77 261,662.22 22.41 27.34 30.6743,109.26 18,469.56 23,145.48 189,014.21 16.19 20.20 10.25114,750.53 100,655.75 67,021.29 433,949.18 37.17 -50.18 44.331,804.47 22,249.87 28,820.58 140,136.22 12.00 22.80 -0.27205,378.00 238,964.21 231,469.16 1,167,613.50 100.00 -3.24 25.212008 2009 2010 TotalsShare of Region inTotal (in %) 1/Percent Change2009-2010Logarithmic Growth2001-201050,915.87 39,584.24 30,301.94 241,970.30 5.16 -30.63 27.00456,103.67 348,866.43 443,945.48 3,307,165.27 70.49 21.42 10.9113,624.66 28,039.81 50,525.16 217,304.91 4.63 44.50 5.0225,978.67 40,684.36 22,167.25 168,399.77 3.59 -83.53 17.11119,301.74 79,868.07 80,433.72 756,744.54 16.13 0.70 7.27603,580.03 483,156.50 551,710.80 4,691,584.79 100 12.43 9.952008 2009 2010 TotalsShare of Region inTotal (in %) 1/Percent Change2009-2010Logarithmic Growth2001-201074,404.35 70,526.16 51,056.99 384,821.97 6.57 -38.13 29.15478,328.93 415,513.52 535,672.25 3,568,827.49 60.91 22.43 12.4356,733.92 46,509.37 73,670.64 406,319.12 6.93 36.87 8.03140,729.20 141,340.11 89,188.53 602,348.95 10.28 -58.47 31.74121,106.21 102,117.94 109,254.30 896,880.76 15.31 6.53 7.06871,302.61 776,007.11 858,842.70 5,859,198.29 100.00 9.65 13.2823.6 30.8 27.0 19.9 Ave. HMN % (2001-2010) 18.169.3 62.3 64.2 80.1 Ave. GER % (2001-2010) 76.0<strong>Illicit</strong> <strong>Financial</strong> <strong>Flows</strong> <strong>from</strong> <strong>Developing</strong> <strong>Countries</strong>: 2001-201011
Table D. <strong>Illicit</strong> <strong>Financial</strong> <strong>Flows</strong> by Region in Real Terms 1/(millions of 2005 U.S. dollars, unless otherwise indicated)HMN (Hot Money Narrow, Balance of Payments <strong>com</strong>ponent)Region/Year 2001 2002 2003 2004 2005 2006 2007Africa 3,046.90 3,867.83 4,725.81 1,830.78 20,296.96 17,074.15 16,249.92Asia 13,401.60 7,719.32 7,630.93 7,143.15 15,306.33 16,116.48 16,116.95<strong>Developing</strong> Europe 15,169.20 13,780.33 17,831.09 11,158.29 16,150.18 9,318.99 25,460.74MENA 15,065.87 5,099.98 4,836.05 3,049.18 51,940.31 42,135.72 28,534.03Western Hemisphere 16,099.37 15,642.15 11,905.65 13,016.79 22,021.10 6,784.96 8,027.66All <strong>Developing</strong> <strong>Countries</strong> 62,782.94 46,109.61 46,929.53 36,198.18 125,714.88 91,430.29 94,389.30GER (Gross Excluding Reversals, Trade Mispricing <strong>com</strong>ponent)Region/Year 2001 2002 2003 2004 2005 2006 2007Africa 9,970.75 6,741.53 6,554.74 17,410.85 15,223.01 27,336.82 37,595.39Asia 195,188.91 223,945.02 270,598.45 350,155.26 372,635.85 351,347.94 365,710.00<strong>Developing</strong> Europe 33,073.39 14,442.30 19,043.78 31,150.83 13,298.00 9,177.93 14,809.40MENA 23,911.14 4,557.54 3,447.45 20,689.41 11,775.39 10,955.46 8,971.52Western Hemisphere 62,705.67 64,118.59 62,494.51 70,254.26 76,459.43 72,211.05 89,268.22All <strong>Developing</strong> <strong>Countries</strong> 324,849.86 313,804.99 362,138.93 489,660.62 489,391.68 471,029.19 516,354.53Total HMN + GERRegion/Year 2001 2002 2003 2004 2005 2006 2007Africa 13,017.64 10,609.36 11,280.54 19,241.63 35,519.97 44,410.97 53,845.31Asia 208,590.52 231,664.35 278,229.38 357,298.41 387,942.18 367,464.42 381,826.96<strong>Developing</strong> Europe 48,242.59 28,222.64 36,874.88 42,309.12 29,448.18 18,496.92 40,270.14MENA 38,977.01 9,657.52 8,283.50 23,738.59 63,715.70 53,091.17 37,505.56Western Hemisphere 78,805.05 79,760.74 74,400.16 83,271.04 98,480.53 78,996.00 97,295.88All <strong>Developing</strong> <strong>Countries</strong> 387,632.81 359,914.60 409,068.46 525,858.80 615,106.56 562,459.49 610,743.84HMN Percent of Total 16.2 12.8 11.5 6.9 20.4 16.3 15.5GER Percent of Total 83.8 87.2 88.5 93.1 79.6 83.7 84.5Source: Staff estimates, Global <strong>Financial</strong> Integrity, based on official balance of payments and trade data reported to the IMF by member countries.1/ Current dollar estimates are deflated by the U.S. Producer Price Index base 2005 (<strong>from</strong> IMF IFS online database).2/ Based on cumulative outflows <strong>from</strong> the region in total outflows <strong>from</strong> developing countries over the period 2001-2010.12 Global <strong>Financial</strong> Integrity
2008 2009 2010 TotalsShare of Region inTotal (in %) 2/Percent Change2009-2010Logarithmic Growth2001-201019,500.26 28,166.71 17,684.04 132,443.35 12.16 -59.28 29.9218,451.53 60,669.44 78,154.46 240,710.20 22.11 22.37 25.3035,789.54 16,813.01 19,720.77 181,192.13 16.64 14.74 5.7195,266.49 91,627.83 57,104.52 394,659.98 36.25 -60.46 38.391,498.08 20,254.26 24,556.16 139,806.16 12.84 17.52 -4.38170,505.90 217,531.25 197,219.94 1,088,811.83 100.00 -10.30 20.062008 2009 2010 TotalsShare of Region inTotal (in %) 2/Percent Change2009-2010Logarithmic Growth2001-201042,270.63 36,033.88 25,818.43 224,956.03 4.95 -39.57 21.78378,659.67 317,576.23 378,258.85 3,204,076.19 70.52 16.04 6.3511,311.26 25,524.89 43,049.40 214,881.19 4.73 40.71 0.7021,567.63 37,035.34 18,887.36 161,798.24 3.56 -96.09 12.2999,044.93 72,704.62 68,532.67 737,793.96 16.24 -6.09 2.85552,854.12 488,874.95 534,546.71 4,543,505.60 100.00 8.54 6.132008 2009 2010 TotalsShare of Region inTotal (in %) 2/Percent Change2009-2010Logarithmic Growth2001-201061,770.88 64,200.60 43,502.47 357,399.38 6.35 -47.58 23.83397,111.19 378,245.67 456,413.32 3,444,786.39 61.16 17.13 7.8147,100.80 42,337.90 62,770.17 396,073.32 7.03 32.55 3.59116,834.12 128,663.17 75,991.87 556,458.22 9.88 -69.31 26.32100,543.02 92,958.88 93,088.82 877,600.12 15.58 0.14 2.65723,360.02 706,406.21 731,766.65 5,632,317.42 100.00 3.47 8.6223.6 30.8 27.0 19.3 Ave. HMN % (2001-2010) 18.176.4 69.2 73.0 80.7 Ave. GER % (2001-2010) 81.9<strong>Illicit</strong> <strong>Financial</strong> <strong>Flows</strong> <strong>from</strong> <strong>Developing</strong> <strong>Countries</strong>: 2001-201013
17. Adjusting the outflow estimates for inflation or for private sector flows marginally alters theregional shares found previously. Chart 4 shows the shares of cumulative illicit outflows <strong>from</strong>the various regions of the developing world over the decade ending 2010 under the HMN+GERmethod. We note that Asia still remains the main driver of illicit outflows <strong>from</strong> developingcountries regardless of the method of estimation. On a cumulative basis, the regionaccounted for 61.2 percent of total outflows, mostly due to massive outflows <strong>from</strong> mainlandChina and India. The Western Hemisphere follows at 15.6 percent, with the Middle East andNorth Africa (MENA) at 9.9 percent. The MENA region has a smaller share than the WesternHemisphere in this study <strong>com</strong>pared to the 2011 Update due to the fact that Algeria, Iran,and Iraq have not fully reported the balance of payments data necessary for the HMN+GERmethod. <strong>Developing</strong> Europe follows MENA in share size, making up 7.0 percent of illicit flows,with the balance flowing out of Africa (6.3 percent). The relative increase in outflows <strong>from</strong>Africa can be mainly attributed to a larger number of countries for which we were able tocollect basic data on the balance of payments and bilateral trade flows. The relative shares aresubject to the caveat that restricted data availability on important countries of certain regionsmay understate the regional shares and overstate others.Chart 4. <strong>Illicit</strong> <strong>Flows</strong> in Real Terms 2001-2010; Regional Shares,-./0%1"%2334540%63789%4:%;
+0#&'12',"03',0&"4')5'(#)*&+')5'6774'5#)8'9::;
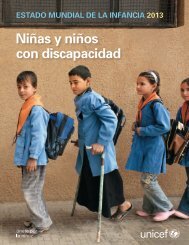
21. The countries with the ten highest illicit outflows are China, Mexico, Malaysia, Saudi Arabia,the Russian Federation, the Philippines, Nigeria, India, Indonesia, and the United ArabEmirates, in declining order of magnitude (see Chart 7). Cumulative illicit outflows <strong>from</strong> China(US$2,742 billion) exceed total cumulative outflows <strong>from</strong> all other nine countries on the list(US$1,728 billion).22. Chart 7 shows the cumulative illicit outflows <strong>from</strong> the top 20 countries over the period 2001-2010. Together, the top 10 exporters of illicit capital account for 76 percent of cumulative illicitoutflows <strong>from</strong> developing countries over the period (Table E). The group’s share in total illicitoutflows <strong>from</strong> developing countries, which was 73 percent in 2001, grew to 80 percent in2006, and averaged 75.2 percent in 2009-2010.Chart 7. Top 20 <strong>Countries</strong>’ Cumulative <strong>Illicit</strong> <strong>Flows</strong>,Nominal !"#$%&'(&)*+&,-&!*./%$0123&!.4.5#671&855090%&:5*;2?=@ABC&=*/D/*$4#50E1F>/10%D989B1E%G/H9B/1%I08/1%I08/1%J0/K98%AB1C%LM/B1K9>%?171M%$#&%!'(%!)*%)(!%)+'%)!,%)!+%)*,%)*#%'$%&$%&$%&$%(&%()%$)%$*%+'%+#%!"#$!%23. Given that illicit flows are mainly driven by macroeconomic issues captured by corruptionperceptions indicators, the size of the underground economy, and weak regulatory institutions,we can expect governance related drivers to take a back seat in explaining such outflows.Rather, to the extent that the HMN+GER method only captures illicit flows, if the HMN+GERmethod did in fact capture only illicit flows, we would expect to see a stronger correlationbetween such outflows and governance-related indicators, noted above. We plan to study thisissue in more detail in the context a case study on Russia (to be published in early 2013).16 Global <strong>Financial</strong> Integrity
Table E. Total <strong>Illicit</strong> <strong>Financial</strong> <strong>Flows</strong> <strong>from</strong> the Top Ten <strong>Developing</strong> <strong>Countries</strong> 1/(in billions of U.S.dollars)Country/Region 2001 2002 2003 2004 2005 2006 2007 2008 2009 2010Total<strong>Illicit</strong>OutflowsAverageofOutflows(wheredata isavailable)China, Mainland 142.20 153.80 183.53 251.06 283.48 296.08 326.66 348.42 336.11 420.36 2,741.70 274.17Non-normalized HMN 4.73 0.00 0.00 0.00 0.00 0.00 0.00 0.00 41.38 52.94 99.05 9.91Non-normalized GER 137.47 153.80 183.53 251.06 283.48 296.08 326.66 348.42 294.73 367.43 2,642.65 264.26China's Percent of all country IFF 43% 51% 51% 51% 46% 50% 49% 40% 43% 49% 47%Mexico 36.30 36.71 38.43 41.21 48.10 49.51 61.97 61.13 51.07 51.17 475.61 47.56Non-normalized HMN 3.30 1.90 4.41 4.82 3.87 1.13 2.46 0.00 16.50 17.74 56.13 5.61Non-normalized GER 33.00 34.81 34.02 36.39 44.23 48.38 59.51 61.13 34.58 33.43 419.48 41.95Mexico's Percent of all country IFF 11% 12% 11% 8% 8% 8% 9% 7% 7% 6% 8%Malaysia 13.07 12.54 17.73 19.58 28.08 29.62 32.48 37.35 30.41 64.38 285.24 28.52Non-normalized HMN 2.39 0.39 0.00 0.00 6.63 7.46 5.20 8.59 5.24 21.66 57.58 5.76Non-normalized GER 10.67 12.15 17.73 19.58 21.45 22.16 27.28 28.76 25.17 42.72 227.66 22.77Malaysia's Percent of all country IFF 4% 4% 5% 4% 5% 5% 5% 4% 4% 7% 5%Saudi Arabia 0.00 0.00 0.00 0.00 36.44 21.02 16.34 32.97 64.89 38.30 209.96 21.00Non-normalized HMN 0.00 0.00 0.00 0.00 34.75 20.56 15.63 30.03 60.75 34.38 196.10 19.61Non-normalized GER 0.00 0.00 0.00 0.00 1.69 0.46 0.72 2.94 4.13 3.92 13.86 1.39Saudi Arabia's Percent of all country IFF 0% 0% 0% 0% 6% 4% 2% 4% 8% 4% 4%Russian Federation 28.70 6.08 11.68 20.36 7.91 0.00 13.35 11.28 8.60 43.64 151.59 15.16Non-normalized HMN 9.56 6.08 9.18 5.87 7.91 0.00 13.35 11.28 1.73 8.29 73.23 7.32Non-normalized GER 19.14 0.00 2.50 14.49 0.00 0.00 0.00 0.00 6.88 35.35 78.35 7.84Russian Federation's Percent of all country IFF 9% 2% 3% 4% 1% 0% 2% 1% 1% 5% 3%Philippines 6.54 7.09 11.18 12.24 17.48 17.80 22.46 18.11 8.29 16.62 137.82 13.78Non-normalized HMN 0.00 0.00 0.90 0.27 1.80 1.59 2.08 1.12 0.00 1.99 9.75 0.98Non-normalized GER 6.54 7.09 10.29 11.97 15.68 16.21 20.38 16.99 8.29 14.63 128.07 12.81Philippines' Percent of all country IFF 2% 2% 3% 2% 3% 3% 3% 2% 1% 2% 2%Nigeria 0.91 0.00 0.00 1.70 17.83 19.14 19.30 24.18 26.33 19.65 129.04 12.90Non-normalized HMN 0.00 0.00 0.00 0.00 17.34 17.15 14.40 20.74 26.33 15.35 111.31 11.13Non-normalized GER 0.91 0.00 0.00 1.70 0.48 1.98 4.90 3.44 0.00 4.30 17.73 1.77Nigeria's Percent of all country IFF 0% 0% 0% 0% 3% 3% 3% 3% 3% 2% 2%India 7.88 8.29 9.45 22.61 30.94 10.51 4.92 26.82 0.28 1.61 123.32 12.33Non-normalized HMN 0.71 0.19 0.00 0.00 0.54 0.00 0.00 0.00 0.28 1.61 3.33 0.33Non-normalized GER 7.17 8.10 9.45 22.61 30.40 10.51 4.92 26.82 0.00 0.00 119.99 12.00India's Percent of all country IFF 2% 3% 3% 5% 5% 2% 1% 3% 0% 0% 2%Indonesia 0.32 2.87 15.12 17.64 11.38 12.72 15.49 16.54 11.56 5.21 108.86 10.89Non-normalized HMN 0.00 1.76 3.51 3.09 0.18 0.00 1.37 0.24 2.97 1.48 14.61 1.46Non-normalized GER 0.32 1.11 11.61 14.54 11.20 12.72 14.12 16.30 8.59 3.73 94.25 9.43Indonesia's Percent of all country IFF 0% 1% 4% 4% 2% 2% 2% 2% 1% 1% 2%United Arab Emirates 4.60 0.00 0.80 1.00 5.50 11.80 0.00 51.70 23.50 7.60 106.50 10.65Non-normalized HMN 4.60 0.00 0.80 1.00 5.50 11.80 0.00 51.70 23.50 7.60 106.50 10.65Non-normalized GER 0.00 0.00 0.00 0.00 0.00 0.00 0.00 0.00 0.00 0.00 0.00 0.00U.A.E.'s percent of All Country IFF 1% 0% 0% 0% 1% 2% 0% 6% 3% 1% 2%Total of top 10 <strong>Countries</strong> 240.52 227.39 287.92 387.39 487.16 468.19 512.98 628.50 561.05 668.55 4,469.65 446.96Top 10 <strong>Countries</strong> as percentof all country IFFs73% 76% 80% 79% 79% 80% 77% 72% 72% 78% 76%<strong>Developing</strong> World total 330.48 299.81 358.97 490.00 615.11 588.72 669.95 871.30 776.01 858.84 5,859.20 585.921/ Top 10 country rankings based on cumulative illicit outflows (non-normalized HMN+GER) over the period 2001-2010.<strong>Illicit</strong> <strong>Financial</strong> <strong>Flows</strong> <strong>from</strong> <strong>Developing</strong> <strong>Countries</strong>: 2001-201017
Chart 10. Heat Map of Cumulative <strong>Illicit</strong> <strong>Financial</strong> <strong>Flows</strong> <strong>from</strong> <strong>Developing</strong> <strong>Countries</strong>, 2001-2010(in millions of U.S dollars)> 500,000100,000 - 499,99938,000 - 99,99933,000 - 37,99927,000 - 32,99921,000 - 26,99916,000 - 20,99911,000 - 15,9996,000 - 10,9991,000 - 5,999< 999No Data or Advanced EconomyChart design by E.J. Fagan.<strong>Illicit</strong> <strong>Financial</strong> <strong>Flows</strong> <strong>from</strong> <strong>Developing</strong> <strong>Countries</strong>: 2001-201021
22 Global <strong>Financial</strong> Integrity
IV. Special Issues: Sovereign Wealth Funds29. This section presents a discussion of whether and how the large sovereign wealth funds(SWFs) of certain countries can impact estimates of illicit financial flows <strong>from</strong> them. Thepurpose of this discussion is to shed light on how estimates of unrecorded capital flows canbe subject to significant errors in measurement for certain countries that maintain large SWFs.30. SWFs are government-owned long-term investment funds that are typically funded by thetransfer of foreign exchange assets. While the SWFs of some countries are relatively new,others have existed for decades. There have always been different reasons for governmentsto establish SWFs. Kiribati, a small Pacific island country, set up the Revenue EqualizationReserve Fund in 1956 to stabilize mining receipts. Today, however, the objective of Kiribati’sSWF is to “save for a rainy day,” i.e. to ride out global economic downturns that can haveparticularly adverse impacts on small open economies. Norway, on the other hand, viewsits SWF as a pension fund. Oil exporting countries like Saudi Arabia, Kuwait, Qatar, and theUnited Arab Emirates set up SWFs in order to make provisions for the day when their primaryresource finally runs out. So the SWFs in the case of countries mainly dependent on oilexports tend to work as an insurance fund in the long run and as a stabilization fund in themedium term to smooth out fluctuations in revenues <strong>from</strong> oil exports.31. Appendix Table 14 presents basic information on the major SWFs by country of ownership,name of investment funds, the size of assets under management, date of inception, origin offunds, and the average illicit flows <strong>from</strong> the country in question. This is not to suggest thatillicit outflows have anything to do with SWFs—the intention of placing the data in the sametable is to facilitate the discussion of statistical issues. Concerns about the transparency ofoperations and transactions of SWFs have increased in recent years along with the risingimportance of SWFs in the international financial system. Assets under management in SWFsare expected to grow further as the reserve assets of countries in current account surplusgrow. The IMF, in a recent staff study, has noted this concern and suggested some steps toimprove transparency. 632. The lack of transparency and of an agreed accounting framework that is consistent acrossSWFs militates against the achievement of high-quality balance of payments statistics,which in turn detracts <strong>from</strong> the reliability of illicit flow estimates. Note that only the portionattributable to the CED <strong>com</strong>ponent (based on the World Bank Residual method) is impactedby the in<strong>com</strong>plete or incorrect recording of SWF-related transactions in the balance ofpayments. SWF-related statistical issues do not affect estimates of trade misinvoicing.6Reference, Sovereign Wealth Funds—A Work Agenda, Prepared by the Monetary and Capital Markets and Policy Development andReview Departments, International Monetary Fund, February 29, 2008.<strong>Illicit</strong> <strong>Financial</strong> <strong>Flows</strong> <strong>from</strong> <strong>Developing</strong> <strong>Countries</strong>: 2001-201023
funds own direct investment equity and debt securities that could be classified ineither direct investment or reserves assets, as general guidance, in the hierarchy ofthe balance of payments and IIP between direct investment and reserve assets, theequity securities should be classified as direct investment ahead of reserve assets,and debt securities should be classified as reserve assets ahead of direct investment.”(paragraphs 6.97-6.98).38. It should be noted that if SWF transactions are not recorded properly, or are recordeddifferently by two agencies that have not coordinated their data <strong>com</strong>pilation systems, then theerrors in classification and/or recording will show up as larger net errors and omissions (NEO)in the balance of payments.39. Note also that there are many reasons for NEOs, including statistical errors in recording,valuation changes, illicit flows, SWFs, etc. One cannot say that larger NEOs are only causedby the in<strong>com</strong>plete recording of SWF-related transactions. Nevertheless, the informationpresented in the following table provides an indication of whether countries with sizeableSWFs tend to have larger NEOs than those that do not or those that have much strongerstatistical systems.40. Appendix Table 15 presents data on net errors and omissions (NEOs) and the financialaccount balance for ten countries with the largest SWFs. The purpose is to explore whetherthere is a link between SWFs and NEOs given statistical capacity. Normally, we would expectcountries with strong statistical systems to do a better job of capturing SWF transactions.Caution must be exercised in interpreting the data in that table. We must bear in mind thefact that the NEO is impacted by many factors not just the accuracy and coverage of SWFtransactions. Nevertheless, keeping this caveat in mind, the balance of payments of certaincountries with large SWFs and <strong>com</strong>paratively weaker statistical systems such as the UnitedArab Emirates, Saudi Arabia, and Qatar show relatively high NEOs which range <strong>from</strong> 40-120percent of the financial account balance on average over the period 2001 to 2010. On theother hand, there are other oil producing countries among the ten highest exporters of illicitcapital, such as Kuwait and Russia, where the impact of SWF accounting seems to be morelimited (ranging <strong>from</strong> 16 to 24 percent). Norway, an oil-exporting country with the third largestSWF but a strong statistical system has a relatively high NEO, averaging nearly 33 percent ofits financial account balance. Singapore and the United States, with strong statistical systemsin place and significantly large SWFs, record NEOs that range <strong>from</strong> 9-13 percent on average.China, with the largest SWF, records an NEO that is not unreasonably large. This leads us tobelieve that its SWF transactions do not seem to adversely impact the NEO.26 Global <strong>Financial</strong> Integrity
V. Conclusions41. This report adds to the World Bank Residual methodology a second, more narrowly focused,methodology for estimating illicit financial flows. The methodology is based on the Hot MoneyNarrow method adjusted for the misinvoicing of trade (HMN+GER) using non-normalized andnormalized estimates for the GER <strong>com</strong>ponent. In accordance with the rationale for excludingillicit inflows, both the HMN+GER and CED+GER methods consider illicit outflows only andset inflows to zero. We then showed that normalization to arrive at a conservative estimate ofillicit flows through the HMN+GER method would not produce an estimate substantially lowerthan the non-normalized one. The main reason for the close proximity of the range is that trademisinvoicing <strong>from</strong> most countries including China and India is larger than 10 percent of exportsin almost all years, so that the normalized and non-normalized GER estimates are nearly equal.42. A <strong>com</strong>parison of illicit flows <strong>from</strong> developing countries under the CED+GER and HMN+GERmethods showed them to be reasonably correlated. According to the non-normalizedCED+GER method, illicit outflows over the period 2001-2010 averaged US$918 billion perannum, while under the non-normalized HMN+GER method they averaged US$586 billion perannum. The gap between the estimates <strong>com</strong>prising of licit outflows widened during the threeyears prior to the global economic crisis (2006-2008), but fell sharply in the last two years aslegal capital flight plunged in the wake of the crisis as a result of lower growth and the tightersqueeze on the availability of capital domestically. In 2010, the CED+GER approach showsthat developing countries lost US$1.13 trillion through illicit financial flows while the HMN+GERshows that they lost US$859 billion. The following trends and patterns are based on theHMN+GER method.43. Asia still remains the primary driver of illicit flows <strong>from</strong> developing countries led by China. Infact, five of the ten countries with the highest illicit outflows are in Asia (China, Malaysia, thePhilippines, India, and Indonesia). The Western Hemisphere follows at 15.6 percent of totaloutflows while the MENA region contributed 9.9 percent of total outflows. In inflation-adjustedterms, outflows <strong>from</strong> MENA grew the fastest at 26.3 percent followed by Africa (23.8 percent),Asia (7.8 percent), developing Europe (3.6 percent), and Western Hemisphere (2.7 percent). Therapid growth in illicit outflows <strong>from</strong> the MENA region can be traced to the increase in crude oilprices.44. According to our estimates, trade misinvoicing is the preferred method of transferring illicitcapital <strong>from</strong> all regions except the MENA region, where it accounted for just 37 percent of totaloutflows over the decade ending 2010. Large current account surpluses are the main drivers ofillicit outflows <strong>from</strong> the balance of payments of countries in that region.<strong>Illicit</strong> <strong>Financial</strong> <strong>Flows</strong> <strong>from</strong> <strong>Developing</strong> <strong>Countries</strong>: 2001-201027
45. The countries with the ten highest outflows are China, Mexico, Malaysia, Saudi Arabia,Russia, the Philippines, Nigeria, India, Indonesia, and the United Arab Emirates in decliningorder of magnitude. Cumulative outflows <strong>from</strong> China (US$2,742 billion) exceed totalcumulative outflows <strong>from</strong> all other nine countries (US$1,728 billion). The top ten countriesaccount for 76.2 percent of cumulative illicit flows <strong>from</strong> all developing countries over thisperiod. The Philippines, India, Indonesia, and Nigeria in the current list of the top tenexporters of illicit capital displace Kuwait, Venezuela, Qatar, and Poland respectively. Indoing so, the Hot Money Narrow list accentuates the impact of illicit flows on povertybecause the four new entrants (the Philippines, India, Indonesia, and Nigeria) have a muchhigher <strong>com</strong>bined population with a significantly larger share of people living on less thanUS$2 a day than the ones they displaced (Kuwait, Venezuela, Qatar, and Poland).46. The special issues section of the report highlighted the problem of estimating illicit flows<strong>from</strong> some developing countries with large SWFs. The discussion pointed out that if SWFtransactions are not properly recorded or are recorded in an inconsistent manner bydifferent government agencies, then the errors in classification or recording will show upas larger net errors and omissions (NEOs) in the balance of payments (in relation to theirfinancial account balance. Based on data presented in Appendix Table 15, we show thatthe balance of payments of certain countries with large SWFs and <strong>com</strong>paratively weakerstatistical systems such as the United Arab Emirates, Saudi Arabia, and Qatar showrelatively high NEOs, which range <strong>from</strong> 40-120 percent of the financial account balanceon average over the period 2001 to 2010. On the other hand, there are other oil producingcountries among the ten highest exporters of illicit capital, such as Kuwait and Russia,where the impact of SWF accounting seems to be more limited (ranging <strong>from</strong> 16 to 24percent). Norway, an oil-exporting country with the third largest SWF but a strong statisticalsystem has a surprisingly high NEO which averaged nearly 33 percent of its financialaccount balance. Singapore and the United States with the fifth and tenth largest SWFsrespectively show much smaller SWFs ranging <strong>from</strong> 9-13 percent on average. China withthe largest SWF records an NEO that is not unreasonably large which lead us to believe thatits SWF transactions are, for the most part, properly reflected in its balance of payments.28 Global <strong>Financial</strong> Integrity
ReferencesAlbalkin, A. and Whalley J. “The Problem of Capital Flight <strong>from</strong> Russia.” The World Economy 22, no.3 May 1999: 412-444.Almounsor, Abdullah. “A Development Comparative Approach to Capital Flight: The Case ofthe Middle East and North Africa, 1970-2002.” In Capital Flight and Capital Controls inDevelopling <strong>Countries</strong>, by Gerald A. Epstein (ed.), 234-261. Cheltenham, UK: Edward Elgar,2005.Baker, Raymond. Capitalism’s Achilles Heel: Dirty Money and How to Renew the Free MarketSystem. Hoboken, NJ: John Wiley & Sons, 2005.Beja, Edsel. “Capital Flight and the Hollowing Out of the Philippine Economy in the NeoliberalRegime.” Philippine Journal of Third World Studies 21, no. 1 2006: 55-74.Cerra, Valerie, Meenakshi Rishis and Sweta Saxena. “Robbing the Riches: Capital Flight,Institutions and Instability.” IMF Working Paper 199, October 2005.Chang, Kevin, Stijn Claessens and Robert Cumby. “Conceptual and methodological Issues in theMeasurement of Capital Flight”. International Journal of <strong>Financial</strong> Economics, Vol. 2, 101-119,1997.Claessens, Stijn and David Naude. “Recent Estimates of Capital Flight”, World Bank internationalEconomics Department Working Paper 1186, 1993.Cumby, Robert and Richard M. Levich. “On the Definition and Magnitude of Capital Flight”, NBERWorking Paper (National Bureau of Economic Research),no. 2275, 1987.Dooley, Michael P. and Kenneth M. Kletzer. “Capital Flight, External Debt and Domestic Policies.”NBER Working Paper (National Bureau of Economic Research), no. 4793 1994.Dornbusch, Rudiger. “Capital Flight: Theory, Measurement and Policy Issues.” IADB Working Paper,no. 2 1990.Gunter, Frank R. “Capital Flight <strong>from</strong> China.” China Economic Review 15, 2004: 63-85.International Monetary Fund. Annual Report on Balance of Payments Statistics. Washington DC:IMF, 2011.International Monetary Fund, Balance of Payments Manual, Sixth Edition, Washington DC: IMF,2012.International Monetary Fund. Balance of Payments Manual, Part I, Washington DC: IMF, 1992.International Monetary Fund. Sovereign Wealth Funds—A Work Agenda, prepared by the Monetaryand Capital Markets and Policy Development and Review Departments, Washington DC: IMF,February 29, 2008Kant, Chander. “Foreign Direct Investment and Capital Flight.” Princeton Studies in InternationalFinance 80, 1996.<strong>Illicit</strong> <strong>Financial</strong> <strong>Flows</strong> <strong>from</strong> <strong>Developing</strong> <strong>Countries</strong>: 2001-201029
Kar, Dev and Devon Cartwrigh-Smith. <strong>Illicit</strong> <strong>Financial</strong> <strong>Flows</strong> <strong>from</strong> Africa: Hidden Resource forDevelopment. Washington DC: Global <strong>Financial</strong> Integrity, 2010.Kar, Dev and Devon Cartwright-Smith. <strong>Illicit</strong> <strong>Financial</strong> <strong>Flows</strong> <strong>from</strong> <strong>Developing</strong> <strong>Countries</strong>: 2002-2006.Washington DC: Global <strong>Financial</strong> Integrity, 2008.Kar, Dev, Devon Cartwright-Smith and Ann Hollingshead. The Absorption of <strong>Illicit</strong> <strong>Financial</strong> <strong>Flows</strong><strong>from</strong> <strong>Developing</strong> <strong>Countries</strong>: 2002-2006. Washington, DC: Global <strong>Financial</strong> Integrity, 2010Kar, Dev and Sarah Freitas. <strong>Illicit</strong> <strong>Financial</strong> <strong>Flows</strong> <strong>from</strong> <strong>Developing</strong> <strong>Countries</strong> Over the DecadeEnding 2009. Washington DC: Global <strong>Financial</strong> Integrity, 2011.Khan, Mohsin S. and Nadeem Ul Haque. “Foreign Borrowing and Capital Flight: A Formal Analysis.”IMF Staff Papers 32, December 1985.Le, Quan V. and Paul J. Zak. “Political Risk and Capital Flight.” Journal of International Money andFinance 20, no. 4 2006: 308-329.Le, Quan and Rishi Meenakshi. “Corruption and Capital Flight: An Empirical Assessment.”International Economic Journal 20, no. 4 December 2006: 534-540.Moghadam, Mashaallah Rahnama, Hedayeh Samavati and David A. Dilts. “An Examination ofCapital Flight <strong>from</strong> East Asian Emerging Economies: Paradise Lost.” Journal of Asia-PacificBusiness 45, no. 1 November 2003: 33-49.Ndikumana, Leonce and James, K. Boyce. “New Estimates of Capital Flight <strong>from</strong> sub-SaharanAfrican <strong>Countries</strong>: Linkages with External Borrowing and Policy Options.” Working Paper(University of Massachussets), April 2008.NGO Documents for the Earth Summit. “Treaty 15: Capital Flight and Corruption.”Non-governmental Organization Alternative Treaties at the Global Forum, 1992.Reuter, Peter. Draining Development? : Controlling <strong>Flows</strong> of <strong>Illicit</strong> Funds <strong>from</strong> <strong>Developing</strong> <strong>Countries</strong>.Washington, DC: World Bank, 2012.Schneider, Benu. “Measuring Capital Flight: Estimates and Interpretations.” Overseas DevelopmentInstitute Working Paper, no. 194 1997.Thee, Kian Wie. “Policies for Private Sector Development in Asia.” ADB Institute Discussion Paper46, March 2006.Zhu, Andong, Chunxiang Li and Gerald Epstein. “Capital Flight <strong>from</strong> China, 1982-2001.” In CapitalFlight and Capital Controls in <strong>Developing</strong> <strong>Countries</strong>, by Gerald A. (ed.) Epstein, 262-285.Cheltenham, UK: Edward Elgar,2005.30 Global <strong>Financial</strong> Integrity
includes gross illicit outflows <strong>from</strong> a country, occurring when source of funds is greater than use offunds (in other words, calculations have a positive sign). Thus, when the use of funds exceeds thesource of funds, that is, when there are inward transfers of illicit capital (calculations have a negativesign), the CED method sets illicit flows to zero for that year. In contrast, economists have typicallynetted out illicit inflows <strong>from</strong> outflows under the traditional World Bank Residual method.Current Account Balance: Covered in the current account are all transactions (other than those infinancial items) that involve economic values and occur between resident and nonresident entities.Also covered are offsets to current economic values provided or acquired without a quid pro quo.Specifically, the major classifications are goods and services, in<strong>com</strong>e, and current transfers.Export Under-invoicing: A country’s exports to the world are <strong>com</strong>pared to world imports <strong>from</strong>that country, adjusted for cost of insurance and freight. <strong>Illicit</strong> outflows <strong>from</strong> a country are indicatedwhenever exports of goods <strong>from</strong> that country are understated relative to the reporting of worldimports <strong>from</strong> that country adjusted for the cost of insurance and freight.External Debt: (World Bank definition) measure of debt owed to nonresidents repayable in foreigncurrency, goods, or services. Total external public and publicly guaranteed debt includes long-termdebt, use of IMF credit, and short-term debt. While private non-guaranteed debt is also included intotal debt, the data are not <strong>com</strong>prehensive for some developing countries.Foreign Direct Investment: measure of all net transactions between a direct investor in oneeconomy and a direct investment enterprise (recipient) in another economy.Gross Excluding Reversals (GER): method of calculating gross illicit outflows defined as exportunder-invoicing and import over-invoicing. In other words, GER calculations are based on thesum of discrepancies between (i) a country’s exports and world imports <strong>from</strong> that country and(ii) a country’s imports and world exports to that country. The absolute value of the export underinvoicing,which is a negative estimate under (i), is added to import over-invoicing to arrive at a GERestimate.Hot Money Narrow (HMN): more conservative measure of illicit financial flows <strong>from</strong> the balance ofpayments than the CED.<strong>Illicit</strong> <strong>Financial</strong> <strong>Flows</strong>: funds that are illegally earned, transferred, or utilized and cover allunrecorded private financial outflows that drive the accumulation of foreign assets by residents incontravention of applicable laws and regulatory frameworks.Import Over-invoicing: A country’s imports <strong>from</strong> the world (adjusted for cost of insurance andfreight) are <strong>com</strong>pared to world exports to that country. <strong>Illicit</strong> outflows <strong>from</strong> a country will beindicated if the country’s imports are overstated with respect to world exports to that country.32 Global <strong>Financial</strong> Integrity
Non-normalized: Change in External Debt (CED) or Gross Excluding Reversals (GER) calculationswhich have not been subjected to the normalization process. Non-normalized estimates representthe upper bound (robust estimate) of the possible range of illicit flows.Normalized: Under the CED+GER method, the normalization process subjects both the Changein External Debt (CED) calculations and the Gross Excluding Reversals (GER) calculations for theentire list of developing countries, for which data are available, to two filters: (i) estimates must havethe right sign (indicating outflow, rather than inflow) in the majority of the years covering the sampleperiod and (ii) exceed the threshold (10 percent) with respect to exports valued at free-on-board (orf.o.b.) basis. Normalized estimates represent a lower bound (conservative estimate) of the possiblerange of illicit flows. Normalization is not required under the HMN+GER method, because it isalready much more conservative than the normalized CED+GER method.Change in Reserves: According to the IMF, net “transactions in assets that are considered by themonetary authorities of an economy to be available for use in funding payments imbalances, and, insome instances, meeting other financial needs”.Trade Misinvoicing: Traditional method in which a country’s exports (respectively, imports) to theworld are <strong>com</strong>pared to world imports (respectively, exports) <strong>from</strong> that country to determine exportor import under- and over-statement. Export under-invoicing and Import over-invoicing reflect illicitoutflows, while export-over-invoicing and import under-invoicing reflect illicit inflows. Traditionally,economists have netted out illicit inflows <strong>from</strong> outflows thereby understating the adverse impact ofillicit flows on developing countries. As illicit inflows are also unrecorded, they cannot be taxed bythe government and are generally unusable for legitimate productive purposes. Hence, only grossoutflows through trade mispricing as considered in the GER method (see definition of GER).World Bank Residual Method: measures a country’s source of funds (inflows of capital) vis-àvisits recorded use of funds (outflows and/or expenditures of capital). Source of funds includesincreases in net external indebtedness and the net inflow of foreign direct investment. Use of fundsincludes the current account deficit that is financed by the capital account flows and additions tocentral bank reserves. <strong>Illicit</strong> outflows (inflows) exist when the source of funds exceeds (falls shortof) the uses of funds. Traditionally, economists have netted out illicit inflows <strong>from</strong> outflows therebyunderstating the adverse impact of illicit flows on developing countries. As illicit inflows are alsounrecorded, they cannot be taxed by the government and are generally unusable for legitimateproductive purposes. Hence, only gross outflows are considered in the Change in External Debt(CED) method (see definition of CED).<strong>Illicit</strong> <strong>Financial</strong> <strong>Flows</strong> <strong>from</strong> <strong>Developing</strong> <strong>Countries</strong>: 2001-201033
34 Global <strong>Financial</strong> Integrity
Table 2. Country Rankings: by Largest Average IFF Estimates, 2001-2010(in millions of U.S. dollars)RankCountryAverage ofall years(where datais available)1 China, P.R.: Mainland 274,1702 Mexico 47,5613 Malaysia 28,5244 Saudi Arabia 20,9965 Russian Federation 15,1596 Philippines 13,7827 Nigeria 12,9048 India 12,3329 Indonesia 10,88610 United Arab Emirates 10,65011 Iraq 10,59712 South Africa 8,39013 Thailand 6,42614 Costa Rica 6,37015 Qatar 5,61116 Serbia, Republic of 5,14417 Poland 4,07718 Panama 3,98719 Venezuela, Republica Bolivariana de 3,79120 Brunei Darussalam 3,70421 Brazil 3,51022 Syrian Arab Republic 3,26023 Egypt 3,09924 Honduras 3,08125 Turkey 2,89626 Sudan 2,63727 Kuwait 2,41928 Chile 2,41729 Aruba 2,35430 Lebanon 2,10531 Kazakhstan 1,91632 Trinidad and Tobago 1,88433 Vietnam 1,75334 Dominican Republic 1,69535 Ethiopia 1,685RankCountryAverage ofall years(where datais available)36 Argentina 1,67037 Guatemala 1,62238 Bulgaria 1,58539 Croatia 1,52540 Congo, Republic of 1,50341 Algeria 1,47142 Hungary 1,44243 Bahamas, The 1,40844 Bangladesh 1,40645 Morocco 1,28346 Colombia 1,25447 Ecuador 1,13548 Nicaragua 1,09349 Liberia 1,08350 Montenegro 1,04251 Equatorial Guinea 1,00352 Bahrain, Kingdom of 97153 Peru 95254 Libya 90255 Romania 88456 El Salvador 86757 Bosnia and Herzegovina 83658 Nepal 80159 Paraguay 75460 Oman 74161 Uruguay 73662 Myanmar 72863 Lithuania 69264 Cote d'Ivoire 68865 Latvia 68066 Uganda 68067 Cameroon 67468 Turkmenistan 65969 Botswana 60470 Zambia 54871 Armenia, Republic of 526Source: Source: Staff estimates, Global <strong>Financial</strong> Integrity, based on official balance of payments and trade data reported to the IMF bymember countries and external debt data reported by those countries to the World Bank.Note: <strong>Countries</strong> below rank 143 either had missing data (see Table 9) or have received only illicit inflows over the period 2001-2010.Note: IFF estimates calculated using the HMN+GER non-normalized methodology.36 Global <strong>Financial</strong> Integrity
RankCountryAverage ofall years(where datais available)72 Cambodia 49873 Angola 48374 Georgia 47775 Malawi 46976 Macedonia, FYR 46177 Ukraine 46078 Congo, Democratic Republic of 43879 Azerbaijan, Republic of 42980 Madagascar 42381 Namibia 42082 Jamaica 41583 Bolivia 38684 Zimbabwe 36585 Lao People's Democratic Republic 34286 Tanzania 33387 Swaziland 30888 Guinea 30689 Djibouti 29290 Gabon 28991 Mali 28992 Fiji 27093 Moldova 25294 Pakistan 25195 Yemen, Republic of 24996 Burkina Faso 24297 Afghanistan, Islamic Republic of 24098 Ghana 21899 Papua New Guinea 203100 Barbados 198101 Togo 196102 Guyana 188103 Lesotho 179104 Rwanda 158105 Sri Lanka 153106 Albania 136107 Samoa 125RankCountryAverage ofall years(where datais available)108 Niger 122109 Mauritius 114110 Kenya 112111 Mongolia 112112 Belize 107113 Suriname 104114 Solomon Islands 91115 Tajikistan 91116 Jordan 88117 Mozambique 85118 Belarus 78119 Kyrgyz Republic 71120 Dominica 64121 Seychelles 62122 Haiti 57123 Sierra Leone 53124 Maldives 52125 Burundi 49126 Gambia, The 47127 Guinea-Bissau 46128 Tunisia 31129 Bhutan 27130 Tonga 27131 Cape Verde 27132 Benin 23133 Central African Republic 18134 Comoros 16135 Vanuatu 13136 Antigua and Barbuda 12137 St. Vincent and the Grenadines 7138 Sao Tome and Principe 6139 Timor-Leste, Dem. Rep. of 5140 St. Lucia 4141 Grenada 4142 St. Kitts and Nevis 3143 Senegal 1<strong>Illicit</strong> <strong>Financial</strong> <strong>Flows</strong> <strong>from</strong> <strong>Developing</strong> <strong>Countries</strong>: 2001-201037
Table 3. HMN ( Balance of Payments)(in millions of U.S. dollars)Country Names 2001 2002 2003 2004 2005 2006 2007 2008 2009 2010 Cumulative AverageAfghanistan . . . . . . . . . . . .Albania 0 0 0 0 0 0 0 0 0 0 0 0Algeria . . . . 203 1,962 500 3,358 2,673 1,265 9,961 1,660Angola 309 68 822 0 574 0 1,641 1,236 0 181 4,830 483Antigua and Barbuda 16 40 5 19 11 11 7 4 7 0 120 12Argentina 2,810 1,890 1,428 0 0 0 0 0 0 1,036 7,164 716Armenia, Republic of 0 4 2 6 0 16 2 0 0 0 29 3Aruba 5 0 0 0 0 0 0 12 14 0 31 3Azerbaijan, Republic of 1 87 112 50 126 256 361 845 1,461 990 4,288 429Bahamas, The 0 0 0 0 150 0 0 0 53 283 485 49Bahrain, Kingdom of 0 0 700 0 0 0 0 30 66 0 796 80Bangladesh 106 349 0 25 629 623 905 120 649 56 3,462 346Barbados 0 0 0 0 0 0 0 7 0 65 71 7Belarus 1 289 13 0 0 286 0 194 0 0 784 78Belize 0 9 35 4 8 8 39 12 5 0 120 12Benin 0 0 0 10 0 0 0 0 6 0 16 2Bhutan . . . . . 0 137 0 0 0 137 27Bolivia 203 640 174 625 372 105 112 0 454 802 3,485 349Bosnia and Herzegovina 0 0 0 0 0 0 68 74 0 0 142 14Botswana 744 0 161 293 0 0 0 0 0 0 1,198 120Brazil 498 154 933 2,145 201 0 3,152 0 347 3,292 10,722 1,072Brunei Darussalam 2,205 2,329 1,838 1,190 3,969 5,786 5,860 8,232 5,420 . 36,829 4,092Bulgaria 0 716 889 0 1,218 986 3,052 4,229 0 0 11,089 1,109Burkina Faso 0 4 4 0 2 9 0 0 0 . 20 2Burundi 31 0 14 19 75 0 37 0 12 0 189 19Cambodia 0 0 40 46 14 72 45 45 8 29 300 30Cameroon 162 177 0 0 48 0 0 0 0 0 388 39Cape Verde 24 8 12 0 0 9 0 108 40 68 268 27Central African Republic . . . . . . . . . . . .Chad . . . . . . . . . . . .Chile 861 952 724 270 1,324 1,526 450 0 0 558 6,665 666China, Mainland 4,732 0 0 0 0 0 0 0 41,383 52,936 99,051 9,905Colombia 151 0 0 0 0 0 0 127 0 0 278 28Comoros . . . . . . . . . . . .Congo, Democratic Republic of 0 236 0 0 46 17 170 0 0 0 468 47Congo, Republic of 12 220 116 93 0 0 199 . . . 639 91Costa Rica 0 51 0 0 0 0 0 48 0 197 296 30Cote d'Ivoire 0 26 888 0 38 38 0 44 37 25 1,096 110Croatia 474 638 1,355 1,305 1,288 1,722 1,659 2,263 1,637 1,010 13,352 1,335Djibouti 0 0 0 16 45 54 0 55 0 117 286 29Dominica 0 0 0 0 0 0 0 0 0 6 6 138 Global <strong>Financial</strong> Integrity
Country Names 2001 2002 2003 2004 2005 2006 2007 2008 2009 2010 Cumulative AverageDominican Republic 452 139 1,568 981 458 123 0 16 129 961 4,827 483Ecuador 514 317 0 0 0 0 0 1 131 0 963 96Egypt 1,146 0 0 45 2,431 0 0 2,896 0 2,145 8,663 866El Salvador 457 615 143 0 449 485 0 0 0 0 2,149 215Equatorial Guinea . . . . . . . . . . . .Eritrea . . . . . . . . . . . .Ethiopia 229 915 390 354 0 0 158 0 501 3,075 5,623 562Fiji 0 135 47 0 101 153 0 0 72 0 508 51Gabon 104 125 260 357 439 . . . . . 1,285 257Gambia, The . . 0 3 34 7 42 31 0 87 203 25Georgia 0 0 6 0 0 62 33 44 0 20 166 17Ghana 51 0 0 0 0 0 37 374 1,259 0 1,721 172Grenada 0 0 10 1 25 0 0 0 0 0 36 4Guatemala 0 65 61 0 0 0 0 0 0 359 485 48Guinea 2 0 157 0 0 2 0 0 0 0 161 16Guinea-Bissau 0 3 0 4 5 1 0 5 9 4 32 3Guyana 45 1 20 43 68 53 82 56 0 177 545 54Haiti 0 0 0 0 0 0 0 0 46 0 46 5Honduras 43 0 0 0 204 332 353 0 346 0 1,278 128Hungary 0 0 0 2,100 2,580 2,744 349 3,373 771 2,187 14,104 1,410India 711 190 0 0 541 0 0 0 279 1,613 3,335 333Indonesia 0 1,763 3,510 3,094 179 0 1,368 238 2,974 1,480 14,605 1,461Iran, Islamic Republic of . . . . . . . . . . . .Iraq . . . . 0 0 3,660 9,245 6,116 7,951 26,971 4,495Jamaica 14 61 0 22 0 0 0 350 0 0 447 45Jordan 154 130 0 0 0 206 0 0 0 0 490 49Kazakhstan 654 0 932 1,016 1,800 3,128 2,966 5,746 783 0 17,025 1,703Kenya 0 0 277 67 234 0 258 0 0 0 835 83Kiribati . . . . . . . . . . . .Kosovo, Republic of . . . . 0 0 0 0 0 0 0 0Kuwait 2,869 1,869 574 0 0 0 4,732 10,049 0 0 20,092 2,009Kyrgyz Republic 0 22 0 19 0 0 356 0 241 71 711 71Lao PDR 51 130 82 0 0 403 735 409 523 402 2,735 273Latvia 0 71 13 0 296 0 212 577 0 0 1,169 117Lebanon . 0 0 734 610 2,818 5,997 1,746 3,042 0 14,946 1,661Lesotho 0 179 71 0 0 0 0 0 117 0 368 37Liberia . . . . 39 98 76 43 288 106 651 108Libya 1,206 0 0 0 1,450 0 0 1,753 0 2,137 6,545 655Lithuania 0 0 0 0 49 289 54 0 0 0 392 39Macedonia, FYR 1 10 33 0 6 0 52 31 0 0 133 13Madagascar 57 0 0 35 0 . . . . . 92 18Malawi 221 0 27 0 24 40 0 153 55 0 520 52<strong>Illicit</strong> <strong>Financial</strong> <strong>Flows</strong> <strong>from</strong> <strong>Developing</strong> <strong>Countries</strong>: 2001-201039
Table 3. HMN ( Balance of Payments) (cont)(in millions of U.S. dollars)Country Names 2001 2002 2003 2004 2005 2006 2007 2008 2009 2010 Cumulative AverageMalaysia 2,394 391 4 0 6,633 7,460 5,201 8,592 5,242 21,663 57,580 5,758Maldives 4 0 0 0 0 0 0 0 0 0 4 0Mali 0 6 0 26 24 37 0 0 74 0 168 17Mauritania . . . . . . . . . . . .Mauritius 86 0 0 0 0 0 0 0 0 0 86 9Mexico 3,304 1,903 4,411 4,816 3,870 1,128 2,458 0 16,496 17,739 56,126 5,613Moldova 0 24 0 0 0 0 0 0 0 0 24 2Mongolia 32 0 6 0 81 14 212 775 0 0 1,120 112Montenegro . . . . . . 0 0 0 0 0 0Morocco 0 182 297 282 404 521 0 412 521 160 2,778 278Mozambique 60 60 0 0 0 0 0 0 0 0 120 12Myanmar 14 19 78 141 604 626 336 1,362 1,010 2,132 6,322 632Namibia 18 0 89 0 0 0 0 0 0 317 424 42Nepal 0 67 0 0 0 0 0 107 0 181 355 36Nicaragua 0 327 100 405 63 401 34 314 79 300 2,024 202Niger 0 9 15 0 0 0 18 57 5 . 104 12Nigeria 0 0 0 0 17,345 17,151 14,399 20,740 26,330 15,350 111,315 11,131Oman 555 842 565 396 859 9 0 0 1,031 0 4,258 426Pakistan 0 0 44 0 202 0 0 51 0 729 1,026 103Panama 499 0 0 0 359 0 474 0 0 0 1,332 133Papua New Guinea 2 0 0 0 59 15 0 73 0 91 239 24Paraguay 0 263 41 0 214 0 212 0 0 0 729 73Peru 0 0 0 0 0 407 138 123 596 0 1,265 126Philippines 0 0 898 274 1,799 1,592 2,082 1,119 0 1,988 9,752 975Poland 0 981 1,961 0 798 0 3,302 12,161 10,045 10,462 39,710 3,971Qatar 1,031 1,260 0 5,568 4,703 0 2,310 2,206 11,384 0 28,462 2,846Romania 0 856 289 0 0 0 1,320 2,065 1,729 119 6,378 638Russian Federation 9,558 6,078 9,179 5,870 7,913 0 13,347 11,277 1,726 8,285 73,234 7,323Rwanda 0 0 0 9 0 0 0 6 0 6 20 2Samoa . . . 3 0 0 2 39 0 0 44 6Sao Tome and Principe 0 0 0 0 0 6 10 32 6 10 64 6Saudi Arabia 0 0 0 0 34,751 20,560 15,629 30,026 60,754 34,380 196,100 19,610Senegal 0 0 0 0 0 0 0 0 0 0 0 0Serbia, Republic of . . . . . . 0 212 76 0 288 72Seychelles 0 10 5 0 1 0 0 0 0 0 15 2Sierra Leone 0 16 50 54 62 28 15 32 7 4 267 27Solomon Islands 0 0 0 6 0 0 0 2 0 12 21 2Somalia . . . . . . . . . . . .South Africa 0 485 0 0 0 0 0 0 804 0 1,289 129Sri Lanka 0 0 114 189 72 106 165 0 0 881 1,527 153St. Kitts and Nevis 6 0 0 8 0 1 0 19 0 0 34 3St. Lucia 0 2 0 0 15 0 1 10 9 0 37 440 Global <strong>Financial</strong> Integrity
Country Names 2001 2002 2003 2004 2005 2006 2007 2008 2009 2010 Cumulative AverageSt. Vincent and the Grenadines 11 0 0 17 23 16 0 0 0 0 67 7Sudan 24 0 14 0 0 88 0 131 733 861 1,851 185Suriname 0 0 0 0 0 0 0 100 19 168 287 29Swaziland 0 0 92 0 41 238 701 0 55 0 1,127 113Syrian Arab Republic 0 160 0 256 137 1,488 746 1,226 747 0 4,761 476Tajikistan . 56 30 32 77 265 337 18 0 0 815 91Tanzania 297 551 340 96 704 0 0 443 380 480 3,290 329Thailand 327 0 0 710 0 0 0 0 0 3,837 4,874 487Timor-Leste, Dem. Rep. of . . . . . 3 9 7 0 5 25 5Togo 5 0 10 0 0 0 0 0 0 0 16 2Tonga 0 0 14 38 12 12 39 9 27 . 151 17Trinidad and Tobago 235 425 0 269 444 143 75 0 0 0 1,591 159Tunisia 0 34 47 128 27 37 37 0 0 0 311 31Turkey 2,091 759 0 0 0 0 0 0 0 0 2,849 285Turkmenistan . . . . . . . . . . . .Uganda 7 124 164 270 454 9 7 0 161 0 1,196 120Ukraine 152 889 834 0 0 0 458 0 0 0 2,334 233United Arab Emirates 0 800 1,000 5,500 11,800 0 51,700 23,500 7,600 0 101,900 10,190Uruguay 0 2,394 0 0 174 152 279 0 0 565 3,564 356Uzbekistan . . . . . . . . . . . .Vanuatu 0 21 22 25 17 4 5 0 37 0 130 13Venezuela, Rep. Bolivariana de 3,601 2,781 795 2,503 13,589 2,211 939 608 3,520 2,313 32,861 3,286Vietnam 847 1,038 0 915 396 0 578 1,045 9,022 3,690 17,530 1,753Yemen, Republic of 110 0 0 0 0 0 0 0 0 0 110 11Zambia 154 0 169 0 64 40 58 0 62 65 611 61Zimbabwe 0 0 0 0 . . 0 0 0 0 0 0Source: Staff estimates, Global <strong>Financial</strong> Integrity, based on official balance of payments and external debt data reported to the IMF andWorld Bank respectively by member countries.<strong>Illicit</strong> <strong>Financial</strong> <strong>Flows</strong> <strong>from</strong> <strong>Developing</strong> <strong>Countries</strong>: 2001-201041
Table 4. CED Normalized (Change in External Debt - Balance of Payments)(in millions of U.S. dollars)Country Names 2001 2002 2003 2004 2005 2006 2007 2008 2009 2010 Cumulative AverageAfghanistan . . 0 0 13,934 0 761 0 535 0 15,230 1,904Albania 0 0 0 0 0 0 0 0 0 0 0 0Algeria 0 1,942 2,699 0 0 0 0 0 0 0 4,642 464Angola 0 2,155 2,455 1,982 4,269 0 7,777 0 0 0 18,637 1,864Antigua and Barbuda 63 53 98 0 16 101 0 0 0 0 332 33Argentina 17,984 12,366 20,898 3,479 0 0 0 16,666 11,678 12,331 95,401 9,540Armenia, Republic of 225 182 155 306 0 129 459 284 235 517 2,491 249Aruba 0 42 224 260 74 532 724 0 88 0 1,944 194Azerbaijan, Republic of 0 462 482 0 0 1,664 3,269 14,215 11,573 16,456 48,122 4,812Bahamas, The 0 0 0 0 0 0 0 0 0 0 0 0Bahrain, Kingdom of 0 738 909 1,101 1,883 4,574 2,168 4,534 3,103 3,268 22,280 2,228Bangladesh 0 2,081 1,257 787 0 2,535 1,402 2,289 0 3,254 13,605 1,361Barbados 0 0 0 0 0 0 0 0 0 0 0 0Belarus 0 0 0 0 0 0 0 0 0 0 0 0Belize 0 0 48 0 37 58 78 0 0 0 222 22Benin 0 0 0 0 0 0 0 0 0 0 0 0Bhutan . . . . 0 0 174 0 0 0 174 29Bolivia 0 938 914 663 604 0 0 0 1,123 0 4,242 424Bosnia and Herzegovina 0 0 0 0 0 0 0 0 0 0 0 0Botswana 868 0 876 1,238 559 824 901 790 2,059 1,360 9,476 948Brazil 0 8,136 9,582 0 0 0 0 0 0 0 17,718 1,772Brunei Darussalam 2,019 1,945 2,585 2,925 . 5,261 4,958 7,116 4,468 6,048 37,325 4,147Bulgaria 0 953 1,991 1,676 0 5,085 9,344 11,471 4,961 0 35,481 3,548Burkina Faso 0 0 0 0 0 0 0 0 0 0 0 0Burundi 0 0 0 0 0 0 0 0 0 0 0 0Cambodia 0 0 0 0 0 0 0 0 0 0 0 0Cameroon 0 0 0 0 0 0 0 0 0 0 0 0Cape Verde 3 0 3 0 0 38 0 25 0 20 89 9Central African Republic 0 0 0 0 0 0 0 0 0 0 0 0Chad 0 0 0 0 384 1,222 2,020 2,366 637 0 6,628 663Chile 3,452 4,009 3,884 8,862 6,209 15,044 26,629 0 15,251 19,590 102,930 10,293China, Mainland 45,733 0 0 0 0 0 0 0 0 0 45,733 4,573Colombia 2,555 0 3,794 0 0 2,848 3,136 0 3,333 0 15,667 1,567Comoros 6 17 14 8 . . . . . . 46 12Congo, Democratic Republic of 170 0 1,744 528 0 928 3,440 1,370 0 0 8,181 818Congo, Republic of 0 1,033 1,205 1,726 0 1,056 0 0 0 0 5,019 502Costa Rica 0 0 0 0 0 0 0 0 0 0 0 0Cote d'Ivoire 0 591 1,696 1,298 0 1,364 923 0 0 0 5,871 587Croatia 509 2,054 0 0 0 0 0 2,562 2,058 2,721 9,903 990Djibouti 17 94 89 77 35 125 217 0 38 70 762 76Dominica 0 0 0 0 0 0 0 0 0 0 0 042 Global <strong>Financial</strong> Integrity
Country Names 2001 2002 2003 2004 2005 2006 2007 2008 2009 2010 Cumulative AverageDominican Republic 422 1,777 2,409 1,859 0 934 407 0 0 0 7,808 781Ecuador 847 1,737 785 967 0 2,115 0 0 0 0 6,451 645Egypt 0 2,501 4,511 4,989 0 9,294 9,304 3,740 2,913 0 37,252 3,725El Salvador 1,131 639 1,443 0 715 358 0 0 0 720 5,006 501Equatorial Guinea 398 0 410 0 . . . . . . 808 202Eritrea . . . . . . . . . . . .Ethiopia 0 1,141 687 0 0 0 275 0 1,402 3,113 6,617 662Fiji 0 0 0 0 0 0 0 0 0 0 0 0Gabon 0 375 1,159 1,370 1,667 1,652 885 2,652 1,409 1,688 12,857 1,286Gambia, The 36 69 71 32 0 48 13 0 126 114 509 51Georgia 0 0 62 80 0 0 0 3,219 0 246 3,607 361Ghana 0 362 0 0 0 0 0 855 0 0 1,218 122Grenada 0 0 0 0 0 0 0 0 0 0 0 0Guatemala 0 0 0 3,121 0 0 980 0 0 0 4,100 410Guinea 0 0 0 0 0 0 0 0 0 0 0 0Guinea-Bissau 0 55 52 34 0 8 11 0 0 . 160 18Guyana 0 0 0 0 0 0 0 0 0 0 0 0Haiti 0 0 0 0 0 0 0 0 0 0 0 0Honduras 0 0 0 0 0 0 0 0 0 0 0 0Hungary 3,841 0 9,715 8,296 0 12,000 32,333 18,506 0 0 84,692 8,469India 0 0 0 0 0 0 0 0 0 0 0 0Indonesia 0 0 8,909 0 0 0 0 19,263 15,979 0 44,151 4,415Iran, Islamic Republic of 3,320 2,654 6,992 0 . . . . . . 12,965 3,241Iraq . . . . . . . 0 0 0 0 0Jamaica 0 0 392 189 0 912 1,516 0 0 1,672 4,680 468Jordan 663 393 802 605 0 961 0 0 0 0 3,424 342Kazakhstan 3,541 3,698 5,193 11,821 13,667 22,554 25,772 28,991 7,344 8,229 130,811 13,081Kenya 0 0 0 0 0 0 0 0 0 0 0 0Kiribati . . . . . . . . . . . .Kosovo, Republic of . . . . . . . . . . . .Kuwait 7,517 7,320 16,110 15,595 29,297 44,241 55,232 53,405 0 19,878 248,595 24,860Kyrgyz Republic 0 66 112 403 0 0 0 306 308 0 1,194 119Lao PDR 0 624 0 152 93 893 1,674 826 647 312 5,221 522Latvia 0 1,139 1,259 1,967 0 3,248 11,082 0 1,035 0 19,729 1,973Lebanon 1,956 866 0 1,062 0 2,222 2,034 0 0 0 8,140 814Lesotho 0 0 0 0 0 0 0 0 0 0 0 0Liberia . 0 0 0 0 0 0 0 0 0 0 0Libya 1,875 0 0 0 0 4,291 9,157 21,015 4,383 11,326 52,047 5,205Lithuania 0 0 0 1,926 0 3,964 5,373 0 0 0 11,262 1,126Macedonia, FYR 151 0 0 790 0 336 838 0 341 0 2,456 246Madagascar 0 0 0 0 0 0 0 0 0 0 0 0Malawi 0 0 0 0 0 0 0 0 0 0 0 0<strong>Illicit</strong> <strong>Financial</strong> <strong>Flows</strong> <strong>from</strong> <strong>Developing</strong> <strong>Countries</strong>: 2001-201043
Table 4. CED Normalized (Change in External Debt - Balance of Payments) (cont)(in millions of U.S. dollars)Country Names 2001 2002 2003 2004 2005 2006 2007 2008 2009 2010 Cumulative AverageMalaysia 9,792 0 0 0 17,272 22,426 20,426 39,206 21,506 38,512 169,140 16,914Maldives 0 0 0 0 0 0 0 0 0 0 0 0Mali 0 0 0 0 0 0 0 0 0 0 0 0Mauritania . . . . . . . . . . . .Mauritius 0 0 0 0 0 0 0 0 0 0 0 0Mexico 0 0 0 0 0 0 0 0 0 0 0 0Moldova 0 201 0 0 0 118 0 0 0 498 817 82Mongolia 0 66 566 168 0 290 485 537 0 0 2,111 211Montenegro . . . . . . 0 0 988 0 988 247Morocco 0 0 0 0 0 0 0 0 0 0 0 0Mozambique 0 0 0 0 0 0 0 0 0 0 0 0Myanmar 0 1,166 973 0 0 901 1,831 1,278 1,140 0 7,290 729Namibia 365 296 1,269 1,149 524 1,719 916 0 522 1,431 8,190 819Nepal 0 532 149 116 0 0 220 0 0 0 1,017 102Nicaragua 0 0 0 0 0 0 0 0 0 0 0 0Niger 0 0 0 0 0 0 0 0 0 . 0 0Nigeria 2,846 5,135 9,751 12,333 14,454 12,791 24,690 37,403 27,732 28,573 175,709 17,571Oman 0 0 0 0 3,822 5,569 0 7,378 0 5,300 22,069 2,207Pakistan 0 2,026 3,522 1,852 0 0 0 3,384 0 0 10,783 1,078Panama 876 0 875 557 0 2,773 0 0 2,170 0 7,251 725Papua New Guinea 0 0 0 0 0 0 0 0 0 0 0 0Paraguay 0 379 0 376 0 0 0 0 0 0 754 75Peru 0 894 1,567 0 0 2,910 0 0 5,189 0 10,560 1,056Philippines 0 0 0 0 0 0 0 0 0 0 0 0Poland 0 10,609 20,005 20,201 0 31,781 42,867 0 14,180 0 139,643 13,964Qatar 4,923 4,108 4,537 9,771 15,382 23,255 26,026 44,960 23,623 40,994 197,579 19,758Romania 0 1,851 3,291 0 0 6,825 10,620 8,057 11,933 0 42,577 4,258Russian Federation 18,443 12,546 35,579 37,046 66,388 0 48,593 203,251 0 0 421,845 42,185Rwanda 0 0 0 0 0 0 0 0 0 0 0 0Samoa 0 0 0 0 0 0 0 0 0 0 0 0Sao Tome and Principe 0 0 0 0 0 0 0 0 0 0 0 0Saudi Arabia 7,740 0 27,627 50,755 47,657 52,217 58,963 39,726 81,186 61,987 427,857 42,786Senegal 0 0 0 0 0 0 0 0 0 . 0 0Serbia, Republic of . . . . . . 0 0 0 0 0 0Seychelles 0 0 83 0 109 368 297 0 123 0 981 98Sierra Leone 0 0 0 0 0 0 0 0 0 0 0 0Solomon Islands 0 0 0 0 0 0 0 0 0 0 0 0Somalia . . . . . . . . . . . .South Africa 0 0 0 0 0 0 0 0 0 0 0 0Sri Lanka 0 524 0 0 0 0 958 0 0 0 1,482 148St. Kitts and Nevis 0 0 0 0 0 0 0 0 0 0 0 0St. Lucia 0 0 0 0 0 0 0 0 0 0 0 044 Global <strong>Financial</strong> Integrity
Table 5. CED Non-normalized (Change in External Debt - Balance of Payments)(in millions of U.S. dollars)Country Names 2001 2002 2003 2004 2005 2006 2007 2008 2009 2010 Cumulative AverageAfghanistan . . 0 0 13,934 0 761 0 535 0 15,230 1,904Albania 0 0 38 0 34 0 0 0 0 0 72 7Algeria 0 1,942 2,699 1,132 667 1,800 2,635 0 0 0 10,875 1,088Angola 207 2,155 2,455 1,982 4,269 2,699 7,777 3,239 773 0 25,555 2,556Antigua and Barbuda 63 53 98 0 16 101 0 0 1 0 332 33Argentina 17,984 12,366 20,898 3,479 0 0 679 16,666 11,678 12,331 96,080 9,608Armenia, Republic of 225 182 155 306 0 129 459 284 235 517 2,491 249Aruba 0 42 224 260 74 532 724 0 88 0 1,944 194Azerbaijan, Republic of 68 462 482 0 589 1,664 3,269 14,215 11,573 16,456 48,779 4,878Bahamas, The 0 0 0 0 0 0 0 0 0 0 0 0Bahrain, Kingdom of 145 738 909 1,101 1,883 4,574 2,168 4,534 3,103 3,268 22,425 2,242Bangladesh 0 2,081 1,257 787 0 2,535 1,402 2,289 874 3,254 14,479 1,448Barbados 0 0 81 0 0 137 589 0 185 0 993 99Belarus 0 581 92 0 931 0 991 127 0 2,107 4,829 483Belize 0 8 48 0 37 58 78 0 5 20 255 26Benin 0 83 0 29 0 0 0 0 0 0 112 11Bhutan . . . . 0 0 174 0 0 0 174 29Bolivia 0 938 914 663 604 0 0 664 1,123 124 5,030 503Bosnia and Herzegovina 0 0 0 0 0 0 1,099 0 520 0 1,619 162Botswana 868 0 876 1,238 559 824 901 790 2,059 1,360 9,476 948Brazil 0 8,136 9,582 2,975 0 0 0 17,986 0 10,564 49,244 4,924Brunei Darussalam 2,019 1,945 2,585 2,925 4,234 5,261 4,958 7,116 4,468 6,048 41,559 4,156Bulgaria 0 953 1,991 1,676 276 5,085 9,344 11,471 4,961 0 35,758 3,576Burkina Faso 0 0 0 0 0 0 0 0 0 0 0 0Burundi 0 87 81 28 0 0 0 0 0 0 196 20Cambodia 59 146 86 123 66 90 184 0 0 32 787 79Cameroon 0 322 873 0 0 0 0 0 0 0 1,195 119Cape Verde 3 0 3 0 0 38 0 25 0 20 89 9Central African Republic 0 285 10 41 0 0 0 0 0 0 337 34Chad 0 0 0 0 384 1,222 2,020 2,366 637 0 6,628 663Chile 3,452 4,009 3,884 8,862 6,209 15,044 26,629 6,586 15,251 19,590 109,515 10,952China, Mainland 45,733 8,108 8,094 0 9,521 87,023 81,895 62,539 0 68,175 371,087 37,109Colombia 2,555 0 3,794 413 1,814 2,848 3,136 1,843 3,333 0 19,737 1,974Comoros 6 17 14 8 . . . . . . 46 12Congo, Democratic Republic of 170 0 1,744 528 0 928 3,440 1,370 0 0 8,181 818Congo, Republic of 0 1,033 1,205 1,726 126 1,056 0 336 478 0 5,959 596Costa Rica 28 0 0 0 302 0 250 423 0 469 1,472 147Cote d'Ivoire 0 591 1,696 1,298 0 1,364 923 0 647 0 6,518 652Croatia 509 2,054 595 0 291 1,011 82 2,562 2,058 2,721 11,883 1,188Djibouti 17 94 89 77 35 125 217 0 38 70 762 76Dominica 11 0 34 0 0 0 0 0 0 0 45 546 Global <strong>Financial</strong> Integrity
Country Names 2001 2002 2003 2004 2005 2006 2007 2008 2009 2010 Cumulative AverageDominican Republic 422 1,777 2,409 1,859 0 934 407 0 123 0 7,930 793Ecuador 847 1,737 785 967 124 2,115 1,135 1,284 0 400 9,394 939Egypt 0 2,501 4,511 4,989 217 9,294 9,304 3,740 2,913 966 38,435 3,844El Salvador 1,131 639 1,443 262 715 358 0 0 0 720 5,268 527Equatorial Guinea 398 118 410 0 . . . . . . 926 231Eritrea . . . . . . . . . . 0 .Ethiopia 0 1,141 687 0 0 0 275 0 1,402 3,113 6,617 662Fiji 0 91 0 0 0 161 0 0 0 0 251 25Gabon 115 375 1,159 1,370 1,667 1,652 885 2,652 1,409 1,688 12,972 1,297Gambia, The 36 69 71 32 0 48 13 0 126 114 509 51Georgia 0 16 62 80 0 0 0 3,219 0 246 3,623 362Ghana 0 362 37 0 0 0 126 855 284 682 2,347 235Grenada 0 24 0 8 0 0 0 0 0 0 33 3Guatemala 0 0 0 3,121 255 102 980 0 0 130 4,588 459Guinea 0 73 103 0 0 67 56 0 0 0 299 30Guinea-Bissau 0 55 52 34 0 8 11 0 0 . 160 18Guyana 0 30 37 0 0 0 0 10 0 380 458 46Haiti 0 0 84 0 27 144 0 0 0 0 256 26Honduras 0 215 130 0 0 0 0 0 529 0 875 87Hungary 3,841 2,696 9,715 8,296 6,102 12,000 32,333 18,506 2,496 0 95,987 9,599India 0 0 0 0 0 5,597 0 11,633 5,698 0 22,928 2,293Indonesia 0 0 8,909 4,429 3,442 0 8,535 19,263 15,979 2,179 62,736 6,274Iran, Islamic Republic of 3,320 2,654 6,992 0 . . . . . . 12,965 3,241Iraq . . . . 0 0 53,545 2,718 0 0 56,263 9,377Jamaica 0 0 392 189 0 912 1,516 0 52 1,672 4,732 473Jordan 663 393 802 605 0 961 0 0 0 0 3,424 342Kazakhstan 3,541 3,698 5,193 11,821 13,667 22,554 25,772 28,991 7,344 8,229 130,811 13,081Kenya 0 508 540 0 0 0 0 0 0 0 1,048 105Kiribati . . . . . . . . . . 0 .Kosovo, Republic of . . . . . . . . . 0 0 0Kuwait 7,517 7,320 16,110 15,595 29,297 44,241 55,232 53,405 0 19,878 248,595 24,860Kyrgyz Republic 0 66 112 403 0 61 0 306 308 0 1,255 126Lao PDR 0 624 0 152 93 893 1,674 826 647 312 5,221 522Latvia 0 1,139 1,259 1,967 0 3,248 11,082 0 1,035 0 19,729 1,973Lebanon 1,956 866 0 1,062 0 2,222 2,034 0 0 0 8,140 814Lesotho 0 264 205 212 0 0 0 0 194 0 876 88Liberia 0 157 187 137 0 113 0 0 0 0 593 59Libya 1,875 0 0 0 1,968 4,291 9,157 21,015 4,383 11,326 54,015 5,401Lithuania 110 433 0 1,926 0 3,964 5,373 0 1,643 0 13,448 1,345Macedonia, FYR 151 64 74 790 0 336 838 0 341 142 2,736 274Madagascar 0 0 93 0 0 0 0 0 0 0 93 9Malawi 0 2 66 50 0 0 0 0 0 0 119 12<strong>Illicit</strong> <strong>Financial</strong> <strong>Flows</strong> <strong>from</strong> <strong>Developing</strong> <strong>Countries</strong>: 2001-201047
Table 5. CED Non-normalized (Change in External Debt - Balance of Payments) (cont)(in millions of U.S. dollars)Country Names 2001 2002 2003 2004 2005 2006 2007 2008 2009 2010 Cumulative AverageMalaysia 9,792 8,003 4,576 0 17,272 22,426 20,426 39,206 21,506 38,512 181,719 18,172Maldives 42 0 0 0 0 0 0 0 0 0 42 4Mali 0 0 0 63 0 0 0 0 0 0 63 6Mauritania 0 20 133 0 . . . . . . 153 38Mauritius 199 0 10 0 0 0 0 0 0 12,886 13,095 1,309Mexico 13,424 0 4,618 11,723 8,457 6,180 20,967 11,318 0 10,131 86,819 8,682Moldova 15 201 66 0 0 118 60 0 0 498 958 96Mongolia 0 66 566 168 29 290 485 537 0 153 2,294 229Montenegro . . . . . . 0 0 988 0 988 247Morocco 0 478 2,451 0 0 2,373 2,772 0 0 0 8,074 807Mozambique 0 0 0 83 0 0 0 0 0 0 83 8Myanmar 0 1,166 973 202 206 901 1,831 1,278 1,140 19 7,716 772Namibia 365 296 1,269 1,149 524 1,719 916 0 522 1,431 8,190 819Nepal 0 532 149 116 0 27 220 0 67 0 1,111 111Nicaragua 0 0 0 0 0 0 0 0 0 0 0 0Niger 0 60 105 0 0 0 0 0 0 . 165 18Nigeria 2,846 5,135 9,751 12,333 14,454 12,791 24,690 37,403 27,732 28,573 175,709 17,571Oman 530 428 22 0 3,822 5,569 722 7,378 0 5,300 23,771 2,377Pakistan 0 2,026 3,522 1,852 0 0 0 3,384 0 482 11,265 1,127Panama 876 14 875 557 0 2,773 0 0 2,170 0 7,265 726Papua New Guinea 0 0 58 0 572 0 0 886 0 3,253 4,769 477Paraguay 0 379 76 376 0 101 0 149 0 321 1,401 140Peru 0 894 1,567 751 45 2,910 0 0 5,189 0 11,356 1,136Philippines 0 3,101 3,512 1,749 2,714 3,979 3,570 1,500 2,464 4,518 27,108 2,711Poland 2,786 10,609 20,005 20,201 0 31,781 42,867 0 14,180 812 143,241 14,324Qatar 4,923 4,108 4,537 9,771 15,382 23,255 26,026 44,960 23,623 40,994 197,579 19,758Romania 0 1,851 3,291 920 519 6,825 10,620 8,057 11,933 0 44,016 4,402Russian Federation 18,443 12,546 35,579 37,046 66,388 4,603 48,593 203,251 8,756 36,415 471,619 47,162Rwanda 0 4 21 0 0 0 0 0 0 0 25 2Samoa 0 27 33 0 0 0 0 5 0 0 65 7Sao Tome and Principe 0 0 0 0 0 0 0 0 0 0 0 0Saudi Arabia 7,740 2,680 27,627 50,755 47,657 52,217 58,963 39,726 81,186 61,987 430,537 43,054Senegal 0 54 0 0 0 0 0 0 0 . 54 6Serbia, Republic of . . . . . . 899 0 0 0 899 225Seychelles 0 0 83 12 109 368 297 0 123 0 993 99Sierra Leone 0 55 115 24 51 0 0 0 0 0 246 25Solomon Islands 0 0 0 27 0 0 0 0 0 0 27 3Somalia . . . . . . . . . . 0 .South Africa 10,339 4,138 1,148 0 0 0 0 0 0 0 15,624 1,562Sri Lanka 0 524 218 355 0 0 958 0 0 513 2,568 257St. Kitts and Nevis 31 0 9 0 12 4 0 0 0 0 56 6St. Lucia 0 0 0 0 25 0 14 190 0 0 229 2348 Global <strong>Financial</strong> Integrity
Country Names 2001 2002 2003 2004 2005 2006 2007 2008 2009 2010 Cumulative AverageSt. Vincent and the Grenadines 0 0 0 0 0 0 0 0 0 0 0 0Sudan 0 218 1,140 1,018 0 0 495 1,814 0 3,374 8,060 806Suriname 0 0 0 0 0 0 0 89 0 429 518 52Swaziland 0 250 154 164 0 48 304 0 0 172 1,092 109Syrian Arab Republic 0 0 0 448 0 2,404 1,213 1,558 1,088 0 6,711 671Tajikistan 0 104 0 58 0 254 148 1,761 0 0 2,327 233Tanzania 0 607 0 956 0 0 0 0 0 71 1,635 163Thailand 0 0 887 1,254 0 0 6,320 0 6,488 0 14,949 1,495Timor-Leste, Dem. Rep. of . . . . . 619 1,039 2,081 1,335 1,588 6,663 1,333Togo 0 68 29 0 0 0 0 0 0 0 97 10Tonga . . 525 3,327 0 0 33 0 0 8 3,893 487Trinidad and Tobago 558 883 1,316 2,564 2,721 6,499 5,445 8,205 3,014 4,423 35,629 3,563Tunisia 917 2,476 2,327 334 0 1,296 1,716 0 0 0 9,066 907Turkey 5,482 10,715 4,242 2,339 0 16,869 21,636 7,618 0 0 68,901 6,890Turkmenistan . . . . . . . . . . 0 .Uganda 0 305 575 260 0 0 0 57 0 0 1,197 120Ukraine 8,885 3,975 4,479 11,866 2,779 20,852 21,247 15,256 15,311 7,657 112,306 11,231United Arab Emirates 5,700 7,208 16,966 27,131 44,290 50,825 45,068 97,739 24,792 8,691 328,409 32,841Uruguay 328 3,810 0 633 0 0 241 0 963 2,062 8,036 804Uzbekistan . . 606 792 728 1,356 2,988 3,134 4,787 3,825 18,216 2,277Vanuatu 18 20 1 5 0 0 6 0 26 0 75 8Venezuela, Rep. Bolivariana de 4,300 9,329 8,527 14,862 30,789 18,386 28,866 29,122 14,944 18,885 178,009 17,801Vietnam 1,471 1,085 25 1,876 305 0 0 264 12,968 11,049 29,044 2,904Yemen, Republic of 98 233 0 0 0 127 0 0 0 0 458 46Zambia 0 0 52 538 0 0 750 96 244 2,289 3,971 397Zimbabwe 0 337 197 0 . . . . . . 534 133Source: Staff estimates, Global <strong>Financial</strong> Integrity, based on official balance of payments and external debt data reported to the IMF andWorld Bank respectively by member countries.<strong>Illicit</strong> <strong>Financial</strong> <strong>Flows</strong> <strong>from</strong> <strong>Developing</strong> <strong>Countries</strong>: 2001-201049
Table 6. GER Normalized (Gross Excluding Reversals - Trade Misinvoicing)(in millions of U.S. dollars)Country Names 2001 2002 2003 2004 2005 2006 2007 2008 2009 2010 Cumulative AverageAfghanistan . 1,289 513 203 0 0 0 0 41 110 2,157 240Albania 0 0 0 0 91 103 315 405 233 164 1,312 131Algeria 0 0 0 0 0 0 0 0 0 0 0 0Angola . . . . . . . . . . . .Antigua and Barbuda . . . . . . . . . . . .Argentina 0 0 0 0 0 0 0 0 0 0 0 0Armenia, Republic of 273 170 248 97 316 204 445 1,210 1,071 1,192 5,226 523Aruba 1,259 805 1,224 2,188 3,537 3,708 3,933 4,907 1,829 123 23,513 2,351Azerbaijan, Republic of . . . . . . . . . . . .Bahamas, The 484 772 1,001 1,063 1,694 1,331 1,622 2,086 1,616 1,925 13,595 1,360Bahrain, Kingdom of 0 609 0 1,468 2,215 2,256 1,629 0 0 0 8,178 818Bangladesh 758 0 967 920 0 2,154 1,833 0 0 2,311 8,943 894Barbados 0 300 329 572 532 64 54 0 0 0 1,852 185Belarus . . . . . . . . . . . .Belize 109 66 86 88 94 80 134 122 101 75 954 95Benin 0 0 0 0 0 0 0 0 0 0 0 0Bhutan . . . . . . . . . . . .Bolivia 0 0 0 0 0 0 0 0 0 0 0 0Bosnia and Herzegovina 459 591 748 903 1,232 371 919 1,162 939 900 8,222 822Botswana 0 0 0 0 0 611 1,157 1,146 1,082 0 3,996 400Brazil 0 0 0 0 0 0 0 0 0 0 0 0Brunei Darussalam 0 0 0 0 . 0 0 0 0 0 0 0Bulgaria 539 0 0 0 0 0 0 0 0 0 539 54Burkina Faso 166 132 111 295 196 174 321 408 214 380 2,397 240Burundi 0 6 0 0 30 119 28 32 47 37 300 30Cambodia 254 280 327 403 412 511 0 742 729 1,027 4,685 469Cameroon 325 0 279 896 473 980 1,221 1,480 0 0 5,653 565Cape Verde . . . . . . . . . . . .Central African Republic 33 78 14 0 14 0 0 0 35 0 174 17Chad . . . . . . . . . . . .Chile 0 0 0 0 0 0 0 0 0 0 0 0China, Mainland 137,470 153,797 183,530 251,058 283,483 296,078 326,661 348,421 294,726 367,426 2,642,648 264,265Colombia 1,350 0 1,316 1,808 0 0 0 0 0 0 4,474 447Comoros 21 9 6 16 16 26 20 21 11 11 158 16Congo, Democratic Republic of 346 345 412 598 922 547 0 0 0 0 3,170 317Congo, Republic of 1,142 0 918 2,961 672 2,149 1,529 2,636 620 1,761 14,388 1,439Costa Rica 1,913 2,375 3,423 4,690 5,757 5,831 6,258 6,992 8,854 17,310 63,403 6,340Cote d'Ivoire 0 0 612 916 1,508 934 0 0 0 0 3,971 397Croatia 484 0 0 0 0 0 0 0 0 0 484 48Djibouti 205 172 212 214 233 304 279 345 301 364 2,629 263Dominica 17 12 18 26 41 46 75 150 127 121 632 6350 Global <strong>Financial</strong> Integrity
Country Names 2001 2002 2003 2004 2005 2006 2007 2008 2009 2010 Cumulative AverageDominican Republic 1,097 536 345 0 0 746 371 1,125 3,834 4,064 12,118 1,212Ecuador 972 0 0 860 1,317 0 0 4,738 0 0 7,887 789Egypt 1,124 1,492 1,217 3,073 2,533 4,200 4,515 3,103 0 0 21,256 2,126El Salvador 0 515 552 730 587 371 956 827 944 908 6,390 639Equatorial Guinea 450 0 0 0 0 0 0 1,968 2,876 2,904 8,198 820Eritrea . . . . . . . . . . . .Ethiopia 672 321 97 0 787 1,148 1,288 1,755 2,543 2,567 11,177 1,118Fiji 147 70 206 249 158 254 239 390 203 280 2,197 220Gabon 0 0 0 0 0 0 0 0 0 0 0 0Gambia, The 17 19 11 28 20 24 31 33 41 47 271 27Georgia 244 248 380 450 403 612 411 854 517 488 4,607 461Ghana 0 0 0 0 0 0 0 0 0 0 0 0Grenada . . . . . . . . . . . .Guatemala 1,998 1,339 1,301 1,350 1,489 808 950 878 3,366 2,257 15,736 1,574Guinea 304 116 161 451 295 291 644 261 0 378 2,901 290Guinea-Bissau 15 42 0 34 19 13 194 0 32 69 419 42Guyana 81 59 60 84 140 90 209 202 182 230 1,336 134Haiti 0 0 0 40 0 88 95 121 0 62 405 41Honduras 2,524 2,679 2,722 2,920 2,985 3,031 3,048 3,297 2,857 3,465 29,527 2,953Hungary 0 0 0 0 0 0 0 0 0 0 0 0India 7,172 8,102 9,447 22,609 30,404 0 0 26,820 0 0 104,554 10,455Indonesia 0 0 11,610 14,542 11,204 12,724 14,122 16,302 0 0 80,504 8,050Iran, Islamic Republic of 0 0 0 0 0 0 0 0 0 0 0 0Iraq . . . . . . . 10,404 11,944 14,263 36,611 12,204Jamaica 235 303 428 413 823 225 212 582 457 0 3,679 368Jordan 0 0 0 0 0 0 0 0 0 0 0 0Kazakhstan 0 0 0 0 0 0 0 0 0 0 0 0Kenya 0 0 0 0 0 0 0 0 0 0 0 0Kiribati . . . . . . . . . . . .Kosovo, Republic of . . . . . . . . . . . .Kuwait 0 0 0 0 0 0 0 0 0 0 0 0Kyrgyz Republic . . . . . . . . . . . .Lao PDR 0 0 0 0 0 114 115 182 182 0 594 59Latvia 836 649 761 1,197 791 665 0 0 0 0 4,899 490Lebanon 1,034 309 0 280 0 0 1,070 1,255 1,068 960 5,976 598Lesotho 0 0 0 0 74 176 314 330 358 0 1,253 125Liberia . 897 815 851 948 1,480 1,828 608 1,040 631 9,098 1,011Libya 0 0 0 0 0 0 0 0 0 0 0 0Lithuania 0 0 0 0 0 0 0 0 0 0 0 0Macedonia, FYR 0 168 247 381 477 287 713 994 582 630 4,480 448Madagascar 0 128 0 797 460 1,643 0 682 185 0 3,896 390Malawi 135 112 183 159 470 418 453 860 696 684 4,171 417<strong>Illicit</strong> <strong>Financial</strong> <strong>Flows</strong> <strong>from</strong> <strong>Developing</strong> <strong>Countries</strong>: 2001-201051
Table 6. GER Normalized (Gross Excluding Reversals - Trade Misinvoicing) (cont)(in millions of U.S. dollars)Country Names 2001 2002 2003 2004 2005 2006 2007 2008 2009 2010 Cumulative AverageMalaysia 10,674 12,153 17,727 19,579 21,447 22,156 27,277 28,756 25,172 42,719 227,659 22,766Maldives 109 148 103 68 38 44 0 0 0 0 510 51Mali 0 0 274 102 145 187 186 967 393 373 2,626 263Mauritania . . . . . . . . . . . .Mauritius 0 0 0 0 0 0 0 0 301 423 724 72Mexico 32,999 34,811 34,022 36,392 44,231 48,380 59,508 61,132 34,578 33,429 419,482 41,948Moldova 209 108 226 337 241 192 446 507 228 0 2,494 249Mongolia 0 0 0 0 0 0 0 0 0 0 0 0Montenegro . . . . 925 860 1,198 1,473 902 896 6,254 1,042Morocco 0 0 0 0 3,382 0 0 0 1,931 0 5,312 531Mozambique 0 189 0 0 0 330 0 0 0 0 520 52Myanmar 0 0 0 0 0 0 0 0 0 0 0 0Namibia 0 0 0 0 0 444 807 841 1,104 0 3,195 320Nepal 603 479 356 421 501 683 584 776 1,551 1,703 7,658 766Nicaragua 436 443 525 650 954 1,120 1,174 1,213 1,130 1,256 8,902 890Niger 50 0 0 87 100 0 0 0 276 554 1,067 107Nigeria 0 0 0 0 0 0 0 0 0 0 0 0Oman 0 0 0 0 0 2,450 0 0 0 0 2,450 245Pakistan 0 0 0 0 0 0 0 0 0 0 0 0Panama 1,732 2,223 2,406 2,705 3,571 4,617 5,072 5,786 5,082 5,343 38,536 3,854Papua New Guinea 0 0 0 0 0 0 0 0 480 899 1,379 138Paraguay 156 305 158 0 0 1,123 627 1,579 1,447 1,412 6,808 681Peru 1,147 0 0 0 0 0 0 0 0 0 1,147 115Philippines 6,540 7,091 10,286 11,968 15,685 16,206 20,380 16,992 8,292 14,631 128,072 12,807Poland 0 0 0 0 0 0 0 0 0 0 0 0Qatar 0 0 0 0 0 0 0 0 18,981 0 18,981 1,898Romania 0 0 0 0 0 0 0 0 0 0 0 0Russian Federation 19,140 0 0 0 0 0 0 0 0 0 19,140 1,914Rwanda 50 53 37 221 35 90 126 88 371 490 1,560 156Samoa 51 59 84 79 322 116 142 137 103 115 1,209 121Sao Tome and Principe . . . . . . . . . . . .Saudi Arabia 0 0 0 0 0 0 0 0 0 0 0 0Senegal 0 0 0 0 0 0 0 0 0 0 0 0Serbia, Republic of 4,080 5,469 7,409 9,776 6,434 5,407 4,194 0 5,637 2,750 51,156 5,116Seychelles 82 210 149 82 75 0 0 0 0 0 598 60Sierra Leone 24 53 45 40 32 0 53 0 0 0 247 25Solomon Islands 28 25 35 70 88 94 136 171 91 153 891 89Somalia . . . . . . . . . . . .South Africa 0 0 0 0 0 10,927 19,838 21,006 18,117 0 69,887 6,989Sri Lanka 0 0 0 0 0 0 0 0 0 0 0 0St. Kitts and Nevis . . . . . . . . . . . .St. Lucia . . . . . . . . . . . .52 Global <strong>Financial</strong> Integrity
Country Names 2001 2002 2003 2004 2005 2006 2007 2008 2009 2010 Cumulative AverageSt. Vincent and the Grenadines . . . . . . . . . . . .Sudan 376 272 0 0 0 0 1,124 9,158 5,663 7,721 24,314 2,431Suriname 56 106 74 120 115 0 0 185 0 0 657 66Swaziland 0 0 0 0 0 300 467 389 410 0 1,565 157Syrian Arab Republic 13,085 0 0 12,761 1,078 0 0 0 0 0 26,924 2,692Tajikistan . . . . . . . . . . . .Tanzania 0 0 0 0 0 0 0 0 0 0 0 0Thailand 0 0 0 0 0 0 0 0 0 0 0 0Timor-Leste, Dem. Rep. of . . . . . . . . . . . .Togo 154 61 292 151 168 131 227 438 200 120 1,940 194Tonga 17 15 13 13 9 13 9 19 6 5 120 12Trinidad and Tobago 0 1,003 1,576 1,848 1,749 0 2,246 0 2,917 4,326 15,665 1,566Tunisia 0 0 0 0 0 0 0 0 0 0 0 0Turkey 0 0 0 0 0 0 0 0 0 0 0 0Turkmenistan . . . . . . . . . . . .Uganda 0 0 140 238 362 456 676 1,130 1,309 1,261 5,572 557Ukraine 0 0 0 0 0 0 0 0 0 0 0 0United Arab Emirates 0 0 0 0 0 0 0 0 0 0 0 0Uruguay 0 294 353 346 0 0 522 0 0 1,008 2,523 252Uzbekistan . . . . . . . . . . . .Vanuatu . . . . . . . . . . . .Venezuela, Rep. Bolivariana de 0 0 0 0 0 0 0 0 0 0 0 0Vietnam 0 0 0 0 0 0 0 0 0 0 0 0Yemen, Republic of 0 0 0 0 0 0 0 0 0 0 0 0Zambia 0 0 387 583 1,279 465 1,249 0 0 0 3,962 396Zimbabwe 342 655 0 297 360 1,787 0 0 0 0 3,442 344Source: Staff estimates, Global <strong>Financial</strong> Integrity, based on trade data reported to the IMF by member countries.<strong>Illicit</strong> <strong>Financial</strong> <strong>Flows</strong> <strong>from</strong> <strong>Developing</strong> <strong>Countries</strong>: 2001-201053
Table 7. GER Non-normalized (Gross Excluding Reversals - Trade Misinvoicing)(in millions of U.S. dollars)Country Names 2001 2002 2003 2004 2005 2006 2007 2008 2009 2010 Cumulative AverageAfghanistan . 1,289 513 203 0 0 0 0 41 110 2,157 240Albania 14 0 14 15 91 103 315 405 233 164 1,356 136Algeria 1,626 490 497 746 0 298 0 0 1,094 0 4,752 475Angola . . . . . . . . . . . .Antigua and Barbuda . . . . . . . . . . . .Argentina 888 598 0 1,166 760 0 1,380 4,748 0 0 9,539 954Armenia, Republic of 273 170 248 97 316 204 445 1,210 1,071 1,192 5,226 523Aruba 1,259 805 1,224 2,188 3,537 3,708 3,933 4,907 1,829 123 23,513 2,351Azerbaijan, Republic of . . . . . . . . . . . .Bahamas, The 484 772 1,001 1,063 1,694 1,331 1,622 2,086 1,616 1,925 13,595 1,360Bahrain, Kingdom of 146 609 588 1,468 2,215 2,256 1,629 0 0 0 8,912 891Bangladesh 758 391 967 920 533 2,154 1,833 729 0 2,311 10,597 1,060Barbados 24 300 329 572 532 64 54 0 0 30 1,905 191Belarus . . . . . . . . . . . .Belize 109 66 86 88 94 80 134 122 101 75 954 95Benin 0 0 62 114 35 0 0 0 0 0 212 21Bhutan . . . . . . . . . . . .Bolivia 164 215 0 0 0 0 0 0 0 0 379 38Bosnia and Herzegovina 459 591 748 903 1,232 371 919 1,162 939 900 8,222 822Botswana 71 79 0 206 277 611 1,157 1,146 1,082 213 4,841 484Brazil 0 0 1,190 1,464 1,702 0 5,435 7,792 5,795 994 24,373 2,437Brunei Darussalam 0 0 0 0 . 0 0 0 0 212 212 24Bulgaria 539 441 657 425 502 0 1,166 510 526 0 4,765 477Burkina Faso 166 132 111 295 196 174 321 408 214 380 2,397 240Burundi 0 6 3 0 30 119 28 32 47 37 303 30Cambodia 254 280 327 403 412 511 0 742 729 1,027 4,685 469Cameroon 325 113 279 896 473 980 1,221 1,480 227 362 6,355 636Cape Verde . . . . . . . . . . . .Central African Republic 33 78 14 7 14 0 2 0 35 0 183 18Chad . . . . . . . . . . . .Chile 1,085 1,051 949 1,289 1,522 1,337 2,178 5,750 939 1,410 17,509 1,751China, Mainland 137,470 153,797 183,530 251,058 283,483 296,078 326,661 348,421 294,726 367,426 2,642,648 264,265Colombia 1,350 1,079 1,316 1,808 1,379 540 628 2,760 1,355 51 12,266 1,227Comoros 21 9 6 16 16 26 20 21 11 11 158 16Congo, Democratic Republic of 346 345 412 598 922 547 207 0 277 260 3,914 391Congo, Republic of 1,142 0 918 2,961 672 2,149 1,529 2,636 620 1,761 14,388 1,439Costa Rica 1,913 2,375 3,423 4,690 5,757 5,831 6,258 6,992 8,854 17,310 63,403 6,340Cote d'Ivoire 45 0 612 916 1,508 934 761 427 506 76 5,786 579Croatia 484 359 595 308 150 0 0 0 0 0 1,896 190Djibouti 205 172 212 214 233 304 279 345 301 364 2,629 263Dominica 17 12 18 26 41 46 75 150 127 121 632 6354 Global <strong>Financial</strong> Integrity
Country Names 2001 2002 2003 2004 2005 2006 2007 2008 2009 2010 Cumulative AverageDominican Republic 1,097 536 345 0 0 746 371 1,125 3,834 4,064 12,118 1,212Ecuador 972 295 23 860 1,317 608 692 4,738 267 611 10,383 1,038Egypt 1,124 1,492 1,217 3,073 2,533 4,200 4,515 3,103 0 1,066 22,322 2,232El Salvador 135 515 552 730 587 371 956 827 944 908 6,525 653Equatorial Guinea 450 59 0 322 175 360 917 1,968 2,876 2,904 10,030 1,003Eritrea . . . . . . . . . . . .Ethiopia 672 321 97 52 787 1,148 1,288 1,755 2,543 2,567 11,230 1,123Fiji 147 70 206 249 158 254 239 390 203 280 2,197 220Gabon 720 387 243 259 0 0 0 0 0 0 1,609 161Gambia, The 17 19 11 28 20 24 31 33 41 47 271 27Georgia 244 248 380 450 403 612 411 854 517 488 4,607 461Ghana 461 0 0 0 0 0 0 0 0 0 461 46Grenada . . . . . . . . . . . .Guatemala 1,998 1,339 1,301 1,350 1,489 808 950 878 3,366 2,257 15,736 1,574Guinea 304 116 161 451 295 291 644 261 0 378 2,901 290Guinea-Bissau 15 42 6 34 19 13 194 4 32 69 428 43Guyana 81 59 60 84 140 90 209 202 182 230 1,336 134Haiti 2 11 31 40 41 88 95 121 34 62 524 52Honduras 2,524 2,679 2,722 2,920 2,985 3,031 3,048 3,297 2,857 3,465 29,527 2,953Hungary 0 0 0 0 0 0 0 0 318 0 318 32India 7,172 8,102 9,447 22,609 30,404 10,512 4,923 26,820 0 0 119,989 11,999Indonesia 320 1,110 11,610 14,542 11,204 12,724 14,122 16,302 8,586 3,733 94,253 9,425Iran, Islamic Republic of 0 0 0 0 0 0 0 0 0 0 0 0Iraq . . . . . . . 10,404 11,944 14,263 36,611 12,204Jamaica 235 303 428 413 823 225 212 582 457 26 3,705 371Jordan 0 0 0 162 0 0 0 97 132 0 391 39Kazakhstan 411 1,000 135 0 0 0 0 0 0 589 2,136 214Kenya 72 0 36 136 0 43 0 0 0 0 287 29Kiribati . . . . . . . . . . . .Kosovo, Republic of . . . . . . . . . . . .Kuwait 251 447 0 18 744 884 351 0 1,403 0 4,098 410Kyrgyz Republic . . . . . . . . . . . .Lao PDR 0 0 0 8 0 114 115 182 182 86 688 69Latvia 836 649 761 1,197 791 665 572 161 0 0 5,632 563Lebanon 1,034 309 0 280 130 0 1,070 1,255 1,068 960 6,106 611Lesotho 18 19 0 66 74 176 314 330 358 62 1,417 142Liberia . 897 815 851 948 1,480 1,828 608 1,040 631 9,098 1,011Libya 2,414 59 0 0 0 0 0 0 0 0 2,473 247Lithuania 0 0 0 0 0 0 0 2,540 1,239 2,752 6,532 653Macedonia, FYR 0 168 247 381 477 287 713 994 582 630 4,480 448Madagascar 24 128 66 797 460 1,643 121 682 185 32 4,139 414Malawi 135 112 183 159 470 418 453 860 696 684 4,171 417<strong>Illicit</strong> <strong>Financial</strong> <strong>Flows</strong> <strong>from</strong> <strong>Developing</strong> <strong>Countries</strong>: 2001-201055
Table 7. GER Non-normalized (Gross Excluding Reversals - Trade Misinvoicing) (cont)(in millions of U.S. dollars)Country Names 2001 2002 2003 2004 2005 2006 2007 2008 2009 2010 Cumulative AverageMalaysia 10,674 12,153 17,727 19,579 21,447 22,156 27,277 28,756 25,172 42,719 227,659 22,766Maldives 109 148 103 68 38 44 4 0 0 0 514 51Mali 52 45 274 102 145 187 186 967 393 373 2,723 272Mauritania . . . . . . . . . . . .Mauritius 16 2 107 40 0 0 0 166 301 423 1,057 106Mexico 32,999 34,811 34,022 36,392 44,231 48,380 59,508 61,132 34,578 33,429 419,482 41,948Moldova 209 108 226 337 241 192 446 507 228 0 2,494 249Mongolia 0 0 0 0 0 0 0 0 0 0 0 0Montenegro . . . . 925 860 1,198 1,473 902 896 6,254 1,042Morocco 343 153 300 700 3,382 271 688 1,465 1,931 821 10,054 1,005Mozambique 9 189 75 0 0 330 126 0 0 0 730 73Myanmar 366 0 62 533 0 0 0 0 0 0 961 96Namibia 47 41 0 129 168 444 807 841 1,104 194 3,774 377Nepal 603 479 356 421 501 683 584 776 1,551 1,703 7,658 766Nicaragua 436 443 525 650 954 1,120 1,174 1,213 1,130 1,256 8,902 890Niger 50 0 0 87 100 0 46 0 276 554 1,113 111Nigeria 906 0 0 1,702 485 1,984 4,905 3,444 0 4,305 17,730 1,773Oman 28 144 332 70 0 2,450 129 0 0 0 3,152 315Pakistan 0 0 0 0 0 0 505 677 298 0 1,480 148Panama 1,732 2,223 2,406 2,705 3,571 4,617 5,072 5,786 5,082 5,343 38,536 3,854Papua New Guinea 0 52 124 93 0 0 33 111 480 899 1,791 179Paraguay 156 305 158 0 0 1,123 627 1,579 1,447 1,412 6,808 681Peru 1,147 718 728 614 972 651 534 1,309 1,577 0 8,250 825Philippines 6,540 7,091 10,286 11,968 15,685 16,206 20,380 16,992 8,292 14,631 128,072 12,807Poland 0 322 106 632 0 0 0 0 0 0 1,060 106Qatar 335 0 0 0 0 175 168 4,807 18,981 978 25,443 2,544Romania 30 0 0 0 0 0 2,434 0 0 0 2,465 246Russian Federation 19,140 0 2,497 14,487 0 0 0 0 6,876 35,353 78,352 7,835Rwanda 50 53 37 221 35 90 126 88 371 490 1,560 156Samoa 51 59 84 79 322 116 142 137 103 115 1,209 121Sao Tome and Principe . . . . . . . . . . . .Saudi Arabia 0 0 0 0 1,694 461 716 2,939 4,131 3,921 13,862 1,386Senegal 9 0 0 0 6 0 0 0 0 0 15 1Serbia, Republic of 4,080 5,469 7,409 9,776 6,434 5,407 4,194 0 5,637 2,750 51,156 5,116Seychelles 82 210 149 82 75 4 0 0 0 0 602 60Sierra Leone 24 53 45 40 32 0 53 18 0 0 266 27Solomon Islands 28 25 35 70 88 94 136 171 91 153 891 89Somalia . . . . . . . . . . . .South Africa 984 961 0 3,052 4,113 10,927 19,838 21,006 18,117 3,615 82,613 8,261Sri Lanka 0 0 0 0 0 0 0 0 0 0 0 0St. Kitts and Nevis . . . . . . . . . . . .St. Lucia . . . . . . . . . . . .56 Global <strong>Financial</strong> Integrity
Country Names 2001 2002 2003 2004 2005 2006 2007 2008 2009 2010 Cumulative AverageSt. Vincent and the Grenadines . . . . . . . . . . . .Sudan 376 272 0 0 139 70 1,124 9,158 5,663 7,721 24,523 2,452Suriname 56 106 74 120 115 31 9 185 53 0 750 75Swaziland 38 32 0 119 133 300 467 389 410 67 1,954 195Syrian Arab Republic 13,085 93 91 12,761 1,078 468 108 0 0 158 27,842 2,784Tajikistan . . . . . . . . . . . .Tanzania 0 0 0 0 0 0 0 0 40 0 40 4Thailand 1,898 1,490 2,070 3,461 8,352 6,095 4,198 14,880 8,406 8,534 59,384 5,938Timor-Leste, Dem. Rep. of . . . . . . . . . . . .Togo 154 61 292 151 168 131 227 438 200 120 1,940 194Tonga 17 15 13 13 9 13 9 19 6 5 120 12Trinidad and Tobago 75 1,003 1,576 1,848 1,749 620 2,246 888 2,917 4,326 17,248 1,725Tunisia 0 0 0 0 0 0 0 0 0 0 0 0Turkey 784 1,822 2,088 18 1,736 906 3,432 3,519 8,244 3,558 26,106 2,611Turkmenistan 694 685 600 . . . . . . . 1,978 659Uganda 26 6 140 238 362 456 676 1,130 1,309 1,261 5,604 560Ukraine 0 0 0 0 0 0 0 290 727 1,253 2,271 227United Arab Emirates 0 0 0 0 0 0 0 0 0 0 0 0Uruguay 191 294 353 346 286 139 522 132 528 1,008 3,799 380Uzbekistan . . . . . . . . . . . .Vanuatu . . . . . . . . . . . .Venezuela, Rep. Bolivariana de 2,332 496 0 2,039 181 0 0 0 0 0 5,048 505Vietnam 0 0 0 0 0 0 0 0 0 0 0 0Yemen, Republic of 0 0 0 0 0 4 468 1,910 0 0 2,382 238Zambia 95 0 387 583 1,279 465 1,249 260 206 342 4,864 486Zimbabwe 342 655 0 297 360 1,787 96 14 103 0 3,655 365Source: Staff estimates, Global <strong>Financial</strong> Integrity, based on trade data reported to the IMF by member countries.<strong>Illicit</strong> <strong>Financial</strong> <strong>Flows</strong> <strong>from</strong> <strong>Developing</strong> <strong>Countries</strong>: 2001-201057
Table 8. <strong>Illicit</strong> <strong>Financial</strong> <strong>Flows</strong> (HMN+GER Normalized)(in millions of U.S. dollars)Country Names 2001 2002 2003 2004 2005 2006 2007 2008 2009 2010 Cumulative AverageAfghanistan . 1,289 513 203 0 0 0 0 41 110 2,157 240Albania 0 0 0 0 91 103 315 405 233 164 1,312 131Algeria 0 0 0 0 203 1,962 500 3,358 2,673 1,265 9,961 996Angola 309 68 822 0 574 0 1,641 1,236 0 181 4,830 483Antigua and Barbuda 16 40 5 19 11 11 7 4 7 0 120 12Argentina 2,810 1,890 1,428 0 0 0 0 0 0 1,036 7,164 716Armenia, Republic of 273 175 250 103 316 220 447 1,210 1,071 1,192 5,255 526Aruba 1,264 805 1,224 2,188 3,537 3,708 3,933 4,919 1,842 123 23,544 2,354Azerbaijan, Republic of 1 87 112 50 126 256 361 845 1,461 990 4,288 429Bahamas, The 484 772 1,001 1,063 1,843 1,331 1,622 2,086 1,669 2,208 14,080 1,408Bahrain, Kingdom of 0 609 700 1,468 2,215 2,256 1,629 30 66 0 8,974 897Bangladesh 864 349 967 945 629 2,778 2,737 120 649 2,367 12,406 1,241Barbados 0 300 329 572 532 64 54 7 0 65 1,923 192Belarus 1 289 13 0 0 286 0 194 0 0 784 78Belize 109 75 121 92 102 88 172 134 106 75 1,074 107Benin 0 0 0 10 0 0 0 0 6 0 16 2Bhutan . . . . . 0 137 0 0 0 137 27Bolivia 203 640 174 625 372 105 112 0 454 802 3,485 349Bosnia and Herzegovina 459 591 748 903 1,232 371 987 1,235 939 900 8,364 836Botswana 744 0 161 293 0 611 1,157 1,146 1,082 0 5,194 519Brazil 498 154 933 2,145 201 0 3,152 0 347 3,292 10,722 1,072Brunei Darussalam 2,205 2,329 1,838 1,190 3,969 5,786 5,860 8,232 5,420 0 36,829 3,683Bulgaria 539 716 889 0 1,218 986 3,052 4,229 0 0 11,629 1,163Burkina Faso 166 136 115 295 198 183 321 408 214 380 2,417 242Burundi 31 6 14 19 104 119 65 32 60 37 489 49Cambodia 254 280 367 449 426 583 45 786 737 1,056 4,985 498Cameroon 487 177 279 896 522 980 1,221 1,480 0 0 6,040 604Cape Verde 24 8 12 0 0 9 0 108 40 68 268 27Central African Republic 33 78 14 0 14 0 0 0 35 0 174 17Chad . . . . . . . . . . . .Chile 861 952 724 270 1,324 1,526 450 0 0 558 6,665 666China, Mainland 142,202 153,797 183,530 251,058 283,483 296,078 326,661 348,421 336,109 420,362 2,741,700 274,170Colombia 1,501 0 1,316 1,808 0 0 0 127 0 0 4,752 475Comoros 21 9 6 16 16 26 20 21 11 11 158 16Congo, Democratic Republic of 346 581 412 598 968 565 170 0 0 0 3,639 364Congo, Republic of 1,154 220 1,034 3,054 672 2,149 1,728 2,636 620 1,761 15,027 1,503Costa Rica 1,913 2,426 3,423 4,690 5,757 5,831 6,258 7,040 8,854 17,507 63,699 6,370Cote d'Ivoire 0 26 1,500 916 1,546 972 0 44 37 25 5,066 507Croatia 958 638 1,355 1,305 1,288 1,722 1,659 2,263 1,637 1,010 13,836 1,384Djibouti 205 172 212 230 277 357 279 401 301 480 2,915 292Dominica 17 12 18 26 41 46 75 150 127 127 638 6458 Global <strong>Financial</strong> Integrity
Country Names 2001 2002 2003 2004 2005 2006 2007 2008 2009 2010 Cumulative AverageDominican Republic 1,549 676 1,913 981 458 869 371 1,141 3,963 5,025 16,946 1,695Ecuador 1,486 317 0 860 1,317 0 0 4,739 131 0 8,850 885Egypt 2,270 1,492 1,217 3,119 4,964 4,200 4,515 5,998 0 2,145 29,919 2,992El Salvador 457 1,130 695 730 1,036 855 956 827 944 908 8,539 854Equatorial Guinea 450 0 0 0 0 0 0 1,968 2,876 2,904 8,198 820Eritrea . . . . . . . . . . . .Ethiopia 901 1,236 487 354 787 1,148 1,446 1,755 3,044 5,642 16,800 1,680Fiji 147 205 253 249 259 407 239 390 275 280 2,705 270Gabon 104 125 260 357 439 0 0 0 0 0 1,285 129Gambia, The 17 19 11 31 54 31 73 64 41 134 474 47Georgia 244 248 386 450 403 674 444 898 517 509 4,773 477Ghana 51 0 0 0 0 0 37 374 1,259 0 1,721 172Grenada 0 0 10 1 25 0 0 0 0 0 36 4Guatemala 1,998 1,404 1,362 1,350 1,489 808 950 878 3,366 2,617 16,221 1,622Guinea 307 116 318 451 295 292 644 261 0 378 3,062 306Guinea-Bissau 15 45 0 38 25 14 194 5 42 74 451 45Guyana 126 60 80 127 208 142 290 258 182 407 1,880 188Haiti 0 0 0 40 0 88 95 121 46 62 451 45Honduras 2,567 2,679 2,722 2,920 3,189 3,363 3,401 3,297 3,203 3,465 30,805 3,081Hungary 0 0 0 2,100 2,580 2,744 349 3,373 771 2,187 14,104 1,410India 7,884 8,292 9,447 22,609 30,945 0 0 26,820 279 1,613 107,889 10,789Indonesia 0 1,763 15,120 17,636 11,383 12,724 15,490 16,540 2,974 1,480 95,110 9,511Iran, Islamic Republic of 0 0 0 0 0 0 0 0 0 0 0 0Iraq . . . . 0 0 3,660 19,648 18,060 22,214 63,582 10,597Jamaica 249 364 428 435 823 225 212 932 457 0 4,126 413Jordan 154 130 0 0 0 206 0 0 0 0 490 49Kazakhstan 654 0 932 1,016 1,800 3,128 2,966 5,746 783 0 17,025 1,703Kenya 0 0 277 67 234 0 258 0 0 0 835 83Kiribati . . . . . . . . . . . .Kosovo, Republic of . . . . 0 0 0 0 0 0 0 0Kuwait 2,869 1,869 574 0 0 0 4,732 10,049 0 0 20,092 2,009Kyrgyz Republic 0 22 0 19 0 0 356 0 241 71 711 71Lao PDR 51 130 82 0 0 516 850 591 705 402 3,328 333Latvia 837 720 774 1,197 1,087 665 212 577 0 0 6,068 607Lebanon 1,034 309 0 1,014 610 2,818 7,067 3,001 4,110 960 20,923 2,092Lesotho 0 179 71 0 74 176 314 330 476 0 1,621 162Liberia . 897 815 851 987 1,578 1,904 650 1,329 737 9,749 1,083Libya 1,206 0 0 0 1,450 0 0 1,753 0 2,137 6,545 655Lithuania 0 0 0 0 49 289 54 0 0 0 392 39Macedonia, FYR 1 178 280 381 483 287 765 1,024 582 631 4,613 461Madagascar 57 128 0 832 460 1,643 0 682 185 0 3,987 399Malawi 357 112 210 159 494 458 453 1,013 751 684 4,691 469<strong>Illicit</strong> <strong>Financial</strong> <strong>Flows</strong> <strong>from</strong> <strong>Developing</strong> <strong>Countries</strong>: 2001-201059
Table 8. <strong>Illicit</strong> <strong>Financial</strong> <strong>Flows</strong> (HMN+GER Normalized) (cont)(in millions of U.S. dollars)Country Names 2001 2002 2003 2004 2005 2006 2007 2008 2009 2010 Cumulative AverageMalaysia 13,068 12,543 17,731 19,579 28,079 29,616 32,478 37,348 30,414 64,383 285,239 28,524Maldives 114 148 103 68 38 44 0 0 0 0 514 51Mali 0 6 274 128 169 224 186 967 467 373 2,795 279Mauritania . . . . . . . . . . . .Mauritius 86 0 0 0 0 0 0 0 301 423 811 81Mexico 36,303 36,714 38,433 41,208 48,101 49,508 61,966 61,132 51,073 51,168 475,608 47,561Moldova 209 132 226 337 241 192 446 507 228 0 2,518 252Mongolia 32 0 6 0 81 14 212 775 0 0 1,120 112Montenegro . . . . 925 860 1,198 1,473 902 896 6,254 1,042Morocco 0 182 297 282 3,786 521 0 412 2,452 160 8,091 809Mozambique 60 249 0 0 0 330 0 0 0 0 639 64Myanmar 14 19 78 141 604 626 336 1,362 1,010 2,132 6,322 632Namibia 18 0 89 0 0 444 807 841 1,104 317 3,619 362Nepal 603 545 356 421 501 683 584 883 1,551 1,884 8,013 801Nicaragua 436 770 625 1,056 1,017 1,521 1,208 1,527 1,210 1,556 10,926 1,093Niger 50 9 15 87 100 0 18 57 282 554 1,171 117Nigeria 0 0 0 0 17,345 17,151 14,399 20,740 26,330 15,350 111,315 11,131Oman 555 842 565 396 859 2,458 0 0 1,031 0 6,707 671Pakistan 0 0 44 0 202 0 0 51 0 729 1,026 103Panama 2,231 2,223 2,406 2,705 3,930 4,617 5,546 5,786 5,082 5,343 39,868 3,987Papua New Guinea 2 0 0 0 59 15 0 73 480 990 1,618 162Paraguay 156 568 199 0 214 1,123 839 1,579 1,447 1,412 7,537 754Peru 1,147 0 0 0 0 407 138 123 596 0 2,412 241Philippines 6,540 7,091 11,184 12,242 17,484 17,798 22,462 18,111 8,292 16,619 137,824 13,782Poland 0 981 1,961 0 798 0 3,302 12,161 10,045 10,462 39,710 3,971Qatar 1,031 1,260 0 5,568 4,703 0 2,310 2,206 30,365 0 47,443 4,744Romania 0 856 289 0 0 0 1,320 2,065 1,729 119 6,378 638Russian Federation 28,698 6,078 9,179 5,870 7,913 0 13,347 11,277 1,726 8,285 92,374 9,237Rwanda 50 53 37 229 35 90 126 94 371 496 1,580 158Samoa 51 59 84 82 322 116 145 176 103 115 1,253 125Sao Tome and Principe 0 0 0 0 0 6 10 32 6 10 64 6Saudi Arabia 0 0 0 0 34,751 20,560 15,629 30,026 60,754 34,380 196,100 19,610Senegal 0 0 0 0 0 0 0 0 0 0 0 0Serbia, Republic of 4,080 5,469 7,409 9,776 6,434 5,407 4,194 212 5,713 2,750 51,443 5,144Seychelles 82 220 153 82 75 0 0 0 0 0 613 61Sierra Leone 24 70 95 94 94 28 68 32 7 4 515 51Solomon Islands 28 25 35 77 88 94 136 173 91 166 912 91Somalia . . . . . . . . . . . .South Africa 0 485 0 0 0 10,927 19,838 21,006 18,921 0 71,176 7,118Sri Lanka 0 0 114 189 72 106 165 0 0 881 1,527 153St. Kitts and Nevis 6 0 0 8 0 1 0 19 0 0 34 3St. Lucia 0 2 0 0 15 0 1 10 9 0 37 460 Global <strong>Financial</strong> Integrity
Country Names 2001 2002 2003 2004 2005 2006 2007 2008 2009 2010 Cumulative AverageSt. Vincent and the Grenadines 11 0 0 17 23 16 0 0 0 0 67 7Sudan 400 272 14 0 0 88 1,124 9,290 6,396 8,582 26,166 2,617Suriname 56 106 74 120 115 0 0 285 19 168 944 94Swaziland 0 0 92 0 41 538 1,168 389 465 0 2,693 269Syrian Arab Republic 13,085 160 0 13,018 1,215 1,488 746 1,226 747 0 31,684 3,168Tajikistan . 56 30 32 77 265 337 18 0 0 815 91Tanzania 297 551 340 96 704 0 0 443 380 480 3,290 329Thailand 327 0 0 710 0 0 0 0 0 3,837 4,874 487Timor-Leste, Dem. Rep. of . . . . . 3 9 7 0 5 25 5Togo 159 61 302 151 168 131 227 438 200 120 1,956 196Tonga 17 15 27 51 21 25 49 28 33 5 271 27Trinidad and Tobago 235 1,428 1,576 2,117 2,192 143 2,321 0 2,917 4,326 17,256 1,726Tunisia 0 34 47 128 27 37 37 0 0 0 311 31Turkey 2,091 759 0 0 0 0 0 0 0 0 2,849 285Turkmenistan . . . . . . . . . . . .Uganda 7 124 304 509 816 465 682 1,130 1,470 1,261 6,767 677Ukraine 152 889 834 0 0 0 458 0 0 0 2,334 233United Arab Emirates 0 800 1,000 5,500 11,800 0 51,700 23,500 7,600 0 101,900 10,190Uruguay 0 2,688 353 346 174 152 801 0 0 1,573 6,087 609Uzbekistan . . . . . . . . . . . .Vanuatu 0 21 22 25 17 4 5 0 37 0 130 13Venezuela, Rep. Bolivariana de 3,601 2,781 795 2,503 13,589 2,211 939 608 3,520 2,313 32,861 3,286Vietnam 847 1,038 0 915 396 0 578 1,045 9,022 3,690 17,530 1,753Yemen, Republic of 110 0 0 0 0 0 0 0 0 0 110 11Zambia 154 0 556 583 1,342 505 1,306 0 62 65 4,573 457Zimbabwe 342 655 0 297 360 1,787 0 0 0 0 3,442 344Source: Staff estimates, Global <strong>Financial</strong> Integrity, based on official balance of payments and trade data reported to the IMF by member countries.Note: <strong>Illicit</strong> financial flows calculated using normalized GER estimates.<strong>Illicit</strong> <strong>Financial</strong> <strong>Flows</strong> <strong>from</strong> <strong>Developing</strong> <strong>Countries</strong>: 2001-201061
Table 9. <strong>Illicit</strong> <strong>Financial</strong> <strong>Flows</strong> (HMN+GER Non-normalized)(in millions of U.S. dollars)Country Names 2001 2002 2003 2004 2005 2006 2007 2008 2009 2010 Cumulative AverageAfghanistan . 1,289 513 203 0 0 0 0 41 110 2,157 240Albania 14 0 14 15 91 103 315 405 233 164 1,356 136Algeria 1,626 490 497 746 203 2,260 500 3,358 3,767 1,265 14,713 1,471Angola 309 68 822 0 574 0 1,641 1,236 0 181 4,830 483Antigua and Barbuda 16 40 5 19 11 11 7 4 7 0 120 12Argentina 3,698 2,488 1,428 1,166 760 0 1,380 4,748 0 1,036 16,703 1,670Armenia, Republic of 273 175 250 103 316 220 447 1,210 1,071 1,192 5,255 526Aruba 1,264 805 1,224 2,188 3,537 3,708 3,933 4,919 1,842 123 23,544 2,354Azerbaijan, Republic of 1 87 112 50 126 256 361 845 1,461 990 4,288 429Bahamas, The 484 772 1,001 1,063 1,843 1,331 1,622 2,086 1,669 2,208 14,080 1,408Bahrain, Kingdom of 146 609 1,288 1,468 2,215 2,256 1,629 30 66 0 9,708 971Bangladesh 864 740 967 945 1,162 2,778 2,737 848 649 2,367 14,059 1,406Barbados 24 300 329 572 532 64 54 7 0 94 1,976 198Belarus 1 289 13 0 0 286 0 194 0 0 784 78Belize 109 75 121 92 102 88 172 134 106 75 1,074 107Benin 0 0 62 125 35 0 0 0 6 0 228 23Bhutan . . . . . 0 137 0 0 0 137 27Bolivia 366 855 174 625 372 105 112 0 454 802 3,864 386Bosnia and Herzegovina 459 591 748 903 1,232 371 987 1,235 939 900 8,364 836Botswana 815 79 161 499 277 611 1,157 1,146 1,082 213 6,039 604Brazil 498 154 2,122 3,609 1,903 0 8,587 7,792 6,143 4,286 35,095 3,510Brunei Darussalam 2,205 2,329 1,838 1,190 3,969 5,786 5,860 8,232 5,420 212 37,042 3,704Bulgaria 539 1,156 1,546 425 1,720 986 4,218 4,738 526 0 15,854 1,585Burkina Faso 166 136 115 295 198 183 321 408 214 380 2,417 242Burundi 31 6 17 19 104 119 65 32 60 37 492 49Cambodia 254 280 367 449 426 583 45 786 737 1,056 4,985 498Cameroon 487 291 279 896 522 980 1,221 1,480 227 362 6,743 674Cape Verde 24 8 12 0 0 9 0 108 40 68 268 27Central African Republic 33 78 14 7 14 0 2 0 35 0 183 18Chad . . . . . . . . . . . .Chile 1,946 2,004 1,673 1,559 2,846 2,863 2,628 5,750 939 1,968 24,174 2,417China, Mainland 142,202 153,797 183,530 251,058 283,483 296,078 326,661 348,421 336,109 420,362 2,741,700 274,170Colombia 1,501 1,079 1,316 1,808 1,379 540 628 2,886 1,355 51 12,544 1,254Comoros 21 9 6 16 16 26 20 21 11 11 158 16Congo, Democratic Republic of 346 581 412 598 968 565 377 0 277 260 4,382 438Congo, Republic of 1,154 220 1,034 3,054 672 2,149 1,728 2,636 620 1,761 15,027 1,503Costa Rica 1,913 2,426 3,423 4,690 5,757 5,831 6,258 7,040 8,854 17,507 63,699 6,370Cote d'Ivoire 45 26 1,500 916 1,546 972 761 470 543 101 6,881 688Croatia 958 997 1,950 1,612 1,438 1,722 1,659 2,263 1,637 1,010 15,248 1,525Djibouti 205 172 212 230 277 357 279 401 301 480 2,915 292Dominica 17 12 18 26 41 46 75 150 127 127 638 6462 Global <strong>Financial</strong> Integrity
Country Names 2001 2002 2003 2004 2005 2006 2007 2008 2009 2010 Cumulative AverageDominican Republic 1,549 676 1,913 981 458 869 371 1,141 3,963 5,025 16,946 1,695Ecuador 1,486 612 23 860 1,317 608 692 4,739 398 611 11,345 1,135Egypt 2,270 1,492 1,217 3,119 4,964 4,200 4,515 5,998 0 3,212 30,985 3,099El Salvador 592 1,130 695 730 1,036 855 956 827 944 908 8,674 867Equatorial Guinea 450 59 0 322 175 360 917 1,968 2,876 2,904 10,030 1,003Eritrea . . . . . . . . . . . .Ethiopia 901 1,236 487 407 787 1,148 1,446 1,755 3,044 5,642 16,853 1,685Fiji 147 205 253 249 259 407 239 390 275 280 2,705 270Gabon 824 512 503 616 439 0 0 0 0 0 2,895 289Gambia, The 17 19 11 31 54 31 73 64 41 134 474 47Georgia 244 248 386 450 403 674 444 898 517 509 4,773 477Ghana 513 0 0 0 0 0 37 374 1,259 0 2,183 218Grenada 0 0 10 1 25 0 0 0 0 0 36 4Guatemala 1,998 1,404 1,362 1,350 1,489 808 950 878 3,366 2,617 16,221 1,622Guinea 307 116 318 451 295 292 644 261 0 378 3,062 306Guinea-Bissau 15 45 6 38 25 14 194 9 42 74 460 46Guyana 126 60 80 127 208 142 290 258 182 407 1,880 188Haiti 2 11 31 40 41 88 95 121 80 62 570 57Honduras 2,567 2,679 2,722 2,920 3,189 3,363 3,401 3,297 3,203 3,465 30,805 3,081Hungary 0 0 0 2,100 2,580 2,744 349 3,373 1,089 2,187 14,422 1,442India 7,884 8,292 9,447 22,609 30,945 10,512 4,923 26,820 279 1,613 123,324 12,332Indonesia 320 2,872 15,120 17,636 11,383 12,724 15,490 16,540 11,560 5,212 108,858 10,886Iran, Islamic Republic of 0 0 0 0 0 0 0 0 0 0 0 0Iraq . . . . 0 0 3,660 19,648 18,060 22,214 63,582 10,597Jamaica 249 364 428 435 823 225 212 932 457 26 4,152 415Jordan 154 130 0 162 0 206 0 97 132 0 881 88Kazakhstan 1,066 1,000 1,067 1,016 1,800 3,128 2,966 5,746 783 589 19,161 1,916Kenya 72 0 312 203 234 43 258 0 0 0 1,121 112Kiribati . . . . . . . . . . . .Kosovo, Republic of . . . . 0 0 0 0 0 0 0 0Kuwait 3,120 2,316 574 18 744 884 5,083 10,049 1,403 0 24,190 2,419Kyrgyz Republic 0 22 0 19 0 0 356 0 241 71 711 71Lao PDR 51 130 82 8 0 516 850 591 705 489 3,423 342Latvia 837 720 774 1,197 1,087 665 784 738 0 0 6,800 680Lebanon 1,034 309 0 1,014 740 2,818 7,067 3,001 4,110 960 21,053 2,105Lesotho 18 198 71 66 74 176 314 330 476 62 1,785 179Liberia . 897 815 851 987 1,578 1,904 650 1,329 737 9,749 1,083Libya 3,620 59 0 0 1,450 0 0 1,753 0 2,137 9,018 902Lithuania 0 0 0 0 49 289 54 2,540 1,239 2,752 6,924 692Macedonia, FYR 1 178 280 381 483 287 765 1,024 582 631 4,613 461Madagascar 81 128 66 832 460 1,643 121 682 185 32 4,231 423Malawi 357 112 210 159 494 458 453 1,013 751 684 4,691 469<strong>Illicit</strong> <strong>Financial</strong> <strong>Flows</strong> <strong>from</strong> <strong>Developing</strong> <strong>Countries</strong>: 2001-201063
Table 9. <strong>Illicit</strong> <strong>Financial</strong> <strong>Flows</strong> (HMN+GER Non-normalized) (cont)(in millions of U.S. dollars)Country Names 2001 2002 2003 2004 2005 2006 2007 2008 2009 2010 Cumulative AverageMalaysia 13,068 12,543 17,731 19,579 28,079 29,616 32,478 37,348 30,414 64,383 285,239 28,524Maldives 114 148 103 68 38 44 4 0 0 0 518 52Mali 52 51 274 128 169 224 186 967 467 373 2,891 289Mauritania . . . . . . . . . . . .Mauritius 103 2 107 40 0 0 0 166 301 423 1,143 114Mexico 36,303 36,714 38,433 41,208 48,101 49,508 61,966 61,132 51,073 51,168 475,608 47,561Moldova 209 132 226 337 241 192 446 507 228 0 2,518 252Mongolia 32 0 6 0 81 14 212 775 0 0 1,120 112Montenegro . . . . 925 860 1,198 1,473 902 896 6,254 1,042Morocco 343 335 597 982 3,786 792 688 1,877 2,452 980 12,832 1,283Mozambique 68 249 75 0 0 330 126 0 0 0 850 85Myanmar 380 19 140 674 604 626 336 1,362 1,010 2,132 7,283 728Namibia 65 41 89 129 168 444 807 841 1,104 511 4,198 420Nepal 603 545 356 421 501 683 584 883 1,551 1,884 8,013 801Nicaragua 436 770 625 1,056 1,017 1,521 1,208 1,527 1,210 1,556 10,926 1,093Niger 50 9 15 87 100 0 64 57 282 554 1,217 122Nigeria 906 0 0 1,702 17,829 19,135 19,304 24,184 26,330 19,655 129,045 12,904Oman 583 985 898 466 859 2,458 129 0 1,031 0 7,410 741Pakistan 0 0 44 0 202 0 505 728 298 729 2,506 251Panama 2,231 2,223 2,406 2,705 3,930 4,617 5,546 5,786 5,082 5,343 39,868 3,987Papua New Guinea 2 52 124 93 59 15 33 184 480 990 2,030 203Paraguay 156 568 199 0 214 1,123 839 1,579 1,447 1,412 7,537 754Peru 1,147 718 728 614 972 1,058 673 1,432 2,173 0 9,515 952Philippines 6,540 7,091 11,184 12,242 17,484 17,798 22,462 18,111 8,292 16,619 137,824 13,782Poland 0 1,303 2,066 632 798 0 3,302 12,161 10,045 10,462 40,770 4,077Qatar 2,540 1,031 1,260 0 5,568 4,878 168 7,117 21,187 12,362 56,110 5,611Romania 30 856 289 0 0 0 3,754 2,065 1,729 119 8,842 884Russian Federation 28,698 6,078 11,676 20,357 7,913 0 13,347 11,277 8,602 43,638 151,586 15,159Rwanda 50 53 37 229 35 90 126 94 371 496 1,580 158Samoa 51 59 84 82 322 116 145 176 103 115 1,253 125Sao Tome and Principe 0 0 0 0 0 6 10 32 6 10 64 6Saudi Arabia 0 0 0 0 36,444 21,021 16,345 32,965 64,886 38,301 209,962 20,996Senegal 9 0 0 0 6 0 0 0 0 0 15 1Serbia, Republic of 4,080 5,469 7,409 9,776 6,434 5,407 4,194 212 5,713 2,750 51,443 5,144Seychelles 82 220 153 82 75 4 0 0 0 0 617 62Sierra Leone 24 70 95 94 94 28 68 51 7 4 533 53Solomon Islands 28 25 35 77 88 94 136 173 91 166 912 91Somalia . . . . . . . . . . . .South Africa 984 1,446 0 3,052 4,113 10,927 19,838 21,006 18,921 3,615 83,901 8,390Sri Lanka 0 0 114 189 72 106 165 0 0 881 1,527 153St. Kitts and Nevis 6 0 0 8 0 1 0 19 0 0 34 3St. Lucia 0 2 0 0 15 0 1 10 9 0 37 464 Global <strong>Financial</strong> Integrity
Country Names 2001 2002 2003 2004 2005 2006 2007 2008 2009 2010 Cumulative AverageSt. Vincent and the Grenadines 11 0 0 17 23 16 0 0 0 0 67 7Sudan 400 272 14 0 139 158 1,124 9,290 6,396 8,582 26,374 2,637Suriname 56 106 74 120 115 31 9 285 72 168 1,037 104Swaziland 38 32 92 119 174 538 1,168 389 465 67 3,081 308Syrian Arab Republic 13,085 254 91 13,018 1,215 1,956 854 1,226 747 158 32,603 3,260Tajikistan . 56 30 32 77 265 337 18 0 0 815 91Tanzania 297 551 340 96 704 0 0 443 420 480 3,329 333Thailand 2,225 1,490 2,070 4,171 8,352 6,095 4,198 14,880 8,406 12,371 64,257 6,426Timor-Leste, Dem. Rep. of . . . . . 3 9 7 0 5 25 5Togo 159 61 302 151 168 131 227 438 200 120 1,956 196Tonga 17 15 27 51 21 25 49 28 33 5 271 27Trinidad and Tobago 311 1,428 1,576 2,117 2,192 763 2,321 888 2,917 4,326 18,839 1,884Tunisia 0 34 47 128 27 37 37 0 0 0 311 31Turkey 2,874 2,581 2,088 18 1,736 906 3,432 3,519 8,244 3,558 28,955 2,896Turkmenistan 694 685 600 . . . . . . . 1,978 659Uganda 33 130 304 509 816 465 682 1,130 1,470 1,261 6,800 680Ukraine 152 889 834 0 0 0 458 290 727 1,253 4,604 460United Arab Emirates 4,600 0 800 1,000 5,500 11,800 0 51,700 23,500 7,600 106,500 10,650Uruguay 191 2,688 353 346 460 290 801 132 528 1,573 7,363 736Uzbekistan . . . . . . . . . . . .Vanuatu 0 21 22 25 17 4 5 0 37 0 130 13Venezuela, Rep. Bolivariana de 5,933 3,277 795 4,542 13,770 2,211 939 608 3,520 2,313 37,909 3,791Vietnam 847 1,038 0 915 396 0 578 1,045 9,022 3,690 17,530 1,753Yemen, Republic of 110 0 0 0 0 4 468 1,910 0 0 2,492 249Zambia 249 0 556 583 1,342 505 1,306 260 268 407 5,476 548Zimbabwe 342 655 0 297 360 1,787 96 14 103 0 3,655 365Source: Staff estimates, Global <strong>Financial</strong> Integrity, based on official balance of payments and trade data reported to the IMF by member countries.Note: <strong>Illicit</strong> financial flows calculated using non-normalized GER estimates.<strong>Illicit</strong> <strong>Financial</strong> <strong>Flows</strong> <strong>from</strong> <strong>Developing</strong> <strong>Countries</strong>: 2001-201065
Table 10. Normalized <strong>Illicit</strong> <strong>Financial</strong> <strong>Flows</strong> (CED Normalized+GER Normalized)(in millions of U.S. dollars)Country Names 2001 2002 2003 2004 2005 2006 2007 2008 2009 2010 Cumulative AverageAfghanistan . 1,289 513 203 13,934 0 761 0 576 110 17,386 1,932Albania 0 0 0 0 91 103 315 405 233 164 1,312 131Algeria 0 1,942 2,699 0 0 0 0 0 0 0 4,642 464Angola 0 2,155 2,455 1,982 4,269 0 7,777 0 0 0 18,637 1,864Antigua and Barbuda 63 53 98 0 16 101 0 0 0 0 332 33Argentina 17,984 12,366 20,898 3,479 0 0 0 16,666 11,678 12,331 95,401 9,540Armenia, Republic of 497 352 403 403 316 333 904 1,494 1,305 1,709 7,718 772Aruba 1,259 847 1,448 2,448 3,611 4,240 4,657 4,907 1,917 123 25,457 2,546Azerbaijan, Republic of 0 462 482 0 0 1,664 3,269 14,215 11,573 16,456 48,122 4,812Bahamas, The 484 772 1,001 1,063 1,694 1,331 1,622 2,086 1,616 1,925 13,595 1,360Bahrain, Kingdom of 0 1,348 909 2,569 4,099 6,830 3,797 4,534 3,103 3,268 30,457 3,046Bangladesh 758 2,081 2,224 1,707 0 4,689 3,234 2,289 0 5,565 22,549 2,255Barbados 0 300 329 572 532 64 54 0 0 0 1,852 185Belarus 0 0 0 0 0 0 0 0 0 0 0 0Belize 109 66 134 88 131 138 212 122 101 75 1,176 118Benin 0 0 0 0 0 0 0 0 0 0 0 0Bhutan . . . . 0 0 174 0 0 0 174 29Bolivia 0 938 914 663 604 0 0 0 1,123 0 4,242 424Bosnia and Herzegovina 459 591 748 903 1,232 371 919 1,162 939 900 8,222 822Botswana 868 0 876 1,238 559 1,435 2,058 1,936 3,141 1,360 13,472 1,347Brazil 0 8,136 9,582 0 0 0 0 0 0 0 17,718 1,772Brunei Darussalam 2,019 1,945 2,585 2,925 . 5,261 4,958 7,116 4,468 6,048 37,325 4,147Bulgaria 539 953 1,991 1,676 0 5,085 9,344 11,471 4,961 0 36,021 3,602Burkina Faso 166 132 111 295 196 174 321 408 214 380 2,397 240Burundi 0 6 0 0 30 119 28 32 47 37 300 30Cambodia 254 280 327 403 412 511 0 742 729 1,027 4,685 469Cameroon 325 0 279 896 473 980 1,221 1,480 0 0 5,653 565Cape Verde 3 0 3 0 0 38 0 25 0 20 89 9Central African Republic 33 78 14 0 14 0 0 0 35 0 174 17Chad 0 0 0 0 384 1,222 2,020 2,366 637 0 6,628 663Chile 3,452 4,009 3,884 8,862 6,209 15,044 26,629 0 15,251 19,590 102,930 10,293China, Mainland 183,203 153,797 183,530 251,058 283,483 296,078 326,661 348,421 294,726 367,426 2,688,382 268,838Colombia 3,904 0 5,111 1,808 0 2,848 3,136 0 3,333 0 20,140 2,014Comoros 27 27 20 24 16 26 20 21 11 11 204 20Congo, Democratic Republic of 516 345 2,156 1,126 922 1,475 3,440 1,370 0 0 11,351 1,135Congo, Republic of 1,142 1,033 2,122 4,687 672 3,204 1,529 2,636 620 1,761 19,408 1,941Costa Rica 1,913 2,375 3,423 4,690 5,757 5,831 6,258 6,992 8,854 17,310 63,403 6,340Cote d'Ivoire 0 591 2,308 2,214 1,508 2,298 923 0 0 0 9,842 984Croatia 993 2,054 0 0 0 0 0 2,562 2,058 2,721 10,388 1,039Djibouti 222 266 302 292 268 428 496 345 339 434 3,392 339Dominica 17 12 18 26 41 46 75 150 127 121 632 6366 Global <strong>Financial</strong> Integrity
Country Names 2001 2002 2003 2004 2005 2006 2007 2008 2009 2010 Cumulative AverageDominican Republic 1,519 2,313 2,754 1,859 0 1,680 778 1,125 3,834 4,064 19,926 1,993Ecuador 1,819 1,737 785 1,827 1,317 2,115 0 4,738 0 0 14,338 1,434Egypt 1,124 3,993 5,728 8,062 2,533 13,494 13,818 6,842 2,913 0 58,508 5,851El Salvador 1,131 1,154 1,995 730 1,302 728 956 827 944 1,629 11,396 1,140Equatorial Guinea 848 0 410 0 0 0 0 1,968 2,876 2,904 9,005 901Eritrea . . . . . . . . . . . .Ethiopia 672 1,462 784 0 787 1,148 1,563 1,755 3,944 5,679 17,795 1,779Fiji 147 70 206 249 158 254 239 390 203 280 2,197 220Gabon 0 375 1,159 1,370 1,667 1,652 885 2,652 1,409 1,688 12,857 1,286Gambia, The 53 87 82 60 20 72 44 33 167 161 781 78Georgia 244 248 442 531 403 612 411 4,073 517 735 8,214 821Ghana 0 362 0 0 0 0 0 855 0 0 1,218 122Grenada 0 0 0 0 0 0 0 0 0 0 0 0Guatemala 1,998 1,339 1,301 4,471 1,489 808 1,929 878 3,366 2,257 19,836 1,984Guinea 304 116 161 451 295 291 644 261 0 378 2,901 290Guinea-Bissau 15 97 52 68 19 21 205 0 32 69 579 58Guyana 81 59 60 84 140 90 209 202 182 230 1,336 134Haiti 0 0 0 40 0 88 95 121 0 62 405 41Honduras 2,524 2,679 2,722 2,920 2,985 3,031 3,048 3,297 2,857 3,465 29,527 2,953Hungary 3,841 0 9,715 8,296 0 12,000 32,333 18,506 0 0 84,692 8,469India 7,172 8,102 9,447 22,609 30,404 0 0 26,820 0 0 104,554 10,455Indonesia 0 0 20,519 14,542 11,204 12,724 14,122 35,565 15,979 0 124,655 12,466Iran, Islamic Republic of 3,320 2,654 6,992 0 0 0 0 0 0 0 12,965 1,296Iraq . . . . . . . 10,404 11,944 14,263 36,611 12,204Jamaica 235 303 820 602 823 1,137 1,728 582 457 1,672 8,359 836Jordan 663 393 802 605 0 961 0 0 0 0 3,424 342Kazakhstan 3,541 3,698 5,193 11,821 13,667 22,554 25,772 28,991 7,344 8,229 130,811 13,081Kenya 0 0 0 0 0 0 0 0 0 0 0 0Kiribati . . . . . . . . . . . .Kosovo, Republic of . . . . . . . . . . . .Kuwait 7,517 7,320 16,110 15,595 29,297 44,241 55,232 53,405 0 19,878 248,595 24,860Kyrgyz Republic 0 66 112 403 0 0 0 306 308 0 1,194 119Lao PDR 0 624 0 152 93 1,007 1,789 1,009 829 312 5,814 581Latvia 836 1,787 2,020 3,164 791 3,912 11,082 0 1,035 0 24,628 2,463Lebanon 2,990 1,175 0 1,342 0 2,222 3,105 1,255 1,068 960 14,116 1,412Lesotho 0 0 0 0 74 176 314 330 358 0 1,253 125Liberia . 897 815 851 948 1,480 1,828 608 1,040 631 9,098 1,011Libya 1,875 0 0 0 0 4,291 9,157 21,015 4,383 11,326 52,047 5,205Lithuania 0 0 0 1,926 0 3,964 5,373 0 0 0 11,262 1,126Macedonia, FYR 151 168 247 1,171 477 623 1,551 994 923 630 6,935 694Madagascar 0 128 0 797 460 1,643 0 682 185 0 3,896 390Malawi 135 112 183 159 470 418 453 860 696 684 4,171 417<strong>Illicit</strong> <strong>Financial</strong> <strong>Flows</strong> <strong>from</strong> <strong>Developing</strong> <strong>Countries</strong>: 2001-201067
Table 10. Normalized <strong>Illicit</strong> <strong>Financial</strong> <strong>Flows</strong> (CED Normalized+GER Normalized) (cont)(in millions of U.S. dollars)Country Names 2001 2002 2003 2004 2005 2006 2007 2008 2009 2010 Cumulative AverageMalaysia 20,466 12,153 17,727 19,579 38,719 44,582 47,702 67,963 46,678 81,231 396,798 39,680Maldives 109 148 103 68 38 44 0 0 0 0 510 51Mali 0 0 274 102 145 187 186 967 393 373 2,626 263Mauritania . . . . . . . . . . . .Mauritius 0 0 0 0 0 0 0 0 301 423 724 72Mexico 32,999 34,811 34,022 36,392 44,231 48,380 59,508 61,132 34,578 33,429 419,482 41,948Moldova 209 308 226 337 241 310 446 507 228 498 3,310 331Mongolia 0 66 566 168 0 290 485 537 0 0 2,111 211Montenegro . . . . 925 860 1,198 1,473 1,890 896 7,242 1,207Morocco 0 0 0 0 3,382 0 0 0 1,931 0 5,312 531Mozambique 0 189 0 0 0 330 0 0 0 0 520 52Myanmar 0 1,166 973 0 0 901 1,831 1,278 1,140 0 7,290 729Namibia 365 296 1,269 1,149 524 2,163 1,723 841 1,626 1,431 11,386 1,139Nepal 603 1,010 506 537 501 683 804 776 1,551 1,703 8,675 868Nicaragua 436 443 525 650 954 1,120 1,174 1,213 1,130 1,256 8,902 890Niger 50 0 0 87 100 0 0 0 276 554 1,067 107Nigeria 2,846 5,135 9,751 12,333 14,454 12,791 24,690 37,403 27,732 28,573 175,709 17,571Oman 0 0 0 0 3,822 8,019 0 7,378 0 5,300 24,519 2,452Pakistan 0 2,026 3,522 1,852 0 0 0 3,384 0 0 10,783 1,078Panama 2,608 2,223 3,281 3,262 3,571 7,390 5,072 5,786 7,252 5,343 45,787 4,579Papua New Guinea 0 0 0 0 0 0 0 0 480 899 1,379 138Paraguay 156 684 158 376 0 1,123 627 1,579 1,447 1,412 7,562 756Peru 1,147 894 1,567 0 0 2,910 0 0 5,189 0 11,707 1,171Philippines 6,540 7,091 10,286 11,968 15,685 16,206 20,380 16,992 8,292 14,631 128,072 12,807Poland 0 10,609 20,005 20,201 0 31,781 42,867 0 14,180 0 139,643 13,964Qatar 4,923 4,108 4,537 9,771 15,382 23,255 26,026 44,960 42,604 40,994 216,560 21,656Romania 0 1,851 3,291 0 0 6,825 10,620 8,057 11,933 0 42,577 4,258Russian Federation 37,583 12,546 35,579 37,046 66,388 0 48,593 203,251 0 0 440,985 44,099Rwanda 50 53 37 221 35 90 126 88 371 490 1,560 156Samoa 51 59 84 79 322 116 142 137 103 115 1,209 121Sao Tome and Principe 0 0 0 0 0 0 0 0 0 0 0 0Saudi Arabia 7,740 0 27,627 50,755 47,657 52,217 58,963 39,726 81,186 61,987 427,857 42,786Senegal 0 0 0 0 0 0 0 0 0 0 0 0Serbia, Republic of 4,080 5,469 7,409 9,776 6,434 5,407 4,194 0 5,637 2,750 51,156 5,116Seychelles 82 210 232 82 184 368 297 0 123 0 1,579 158Sierra Leone 24 53 45 40 32 0 53 0 0 0 247 25Solomon Islands 28 25 35 70 88 94 136 171 91 153 891 89Somalia . . . . . . . . . . . .South Africa 0 0 0 0 0 10,927 19,838 21,006 18,117 0 69,887 6,989Sri Lanka 0 524 0 0 0 0 958 0 0 0 1,482 148St. Kitts and Nevis 0 0 0 0 0 0 0 0 0 0 0 0St. Lucia 0 0 0 0 0 0 0 0 0 0 0 068 Global <strong>Financial</strong> Integrity
Table 11. Non-normalized <strong>Illicit</strong> <strong>Financial</strong> <strong>Flows</strong> (CED Non-normalized+GER Non-normalized)(in millions of U.S. dollars)Country Names 2001 2002 2003 2004 2005 2006 2007 2008 2009 2010 Cumulative AverageAfghanistan . 1,289 513 203 13,934 0 761 0 576 110 17,386 1,932Albania 14 0 52 15 125 103 315 405 233 164 1,428 143Algeria 1,626 2,432 3,197 1,879 667 2,098 2,635 0 1,094 0 15,627 1,563Angola 207 2,155 2,455 1,982 4,269 2,699 7,777 3,239 773 0 25,555 2,556Antigua and Barbuda 63 53 98 0 16 101 0 0 1 0 332 33Argentina 18,872 12,964 20,898 4,645 760 0 2,058 21,414 11,678 12,331 105,619 10,562Armenia, Republic of 497 352 403 403 316 333 904 1,494 1,305 1,709 7,718 772Aruba 1,259 847 1,448 2,448 3,611 4,240 4,657 4,907 1,917 123 25,457 2,546Azerbaijan, Republic of 68 462 482 0 589 1,664 3,269 14,215 11,573 16,456 48,779 4,878Bahamas, The 484 772 1,001 1,063 1,694 1,331 1,622 2,086 1,616 1,925 13,595 1,360Bahrain, Kingdom of 291 1,348 1,497 2,569 4,099 6,830 3,797 4,534 3,103 3,268 31,337 3,134Bangladesh 758 2,472 2,224 1,707 533 4,689 3,234 3,018 874 5,565 25,075 2,508Barbados 24 300 411 572 532 201 643 0 185 30 2,898 290Belarus 0 581 92 0 931 0 991 127 0 2,107 4,829 483Belize 109 74 134 88 131 138 212 122 106 94 1,209 121Benin 0 83 62 144 35 0 0 0 0 0 324 32Bhutan . . . . 0 0 174 0 0 0 174 29Bolivia 164 1,153 914 663 604 0 0 664 1,123 124 5,408 541Bosnia and Herzegovina 459 591 748 903 1,232 371 2,018 1,162 1,460 900 9,842 984Botswana 939 79 876 1,444 836 1,435 2,058 1,936 3,141 1,573 14,317 1,432Brazil 0 8,136 10,772 4,440 1,702 0 5,435 25,778 5,795 11,558 73,616 7,362Brunei Darussalam 2,019 1,945 2,585 2,925 4,234 5,261 4,958 7,116 4,468 6,260 41,771 4,177Bulgaria 539 1,394 2,648 2,102 778 5,085 10,510 11,980 5,487 0 40,523 4,052Burkina Faso 166 132 111 295 196 174 321 408 214 380 2,397 240Burundi 0 93 84 28 30 119 28 32 47 37 499 50Cambodia 313 426 414 526 478 602 184 742 729 1,059 5,472 547Cameroon 325 435 1,152 896 473 980 1,221 1,480 227 362 7,550 755Cape Verde 3 0 3 0 0 38 0 25 0 20 89 9Central African Republic 33 363 24 49 14 0 2 0 35 0 520 52Chad 0 0 0 0 384 1,222 2,020 2,366 637 0 6,628 663Chile 4,537 5,060 4,833 10,151 7,731 16,381 28,807 12,335 16,189 21,001 127,025 12,702China, Mainland 183,203 161,905 191,624 251,058 293,004 383,100 408,556 410,959 294,726 435,601 3,013,735 301,374Colombia 3,904 1,079 5,111 2,221 3,193 3,388 3,764 4,603 4,687 51 32,002 3,200Comoros 27 27 20 24 16 26 20 21 11 11 204 20Congo, Democratic Republic of 516 345 2,156 1,126 922 1,475 3,647 1,370 277 260 12,095 1,209Congo, Republic of 1,142 1,033 2,122 4,687 798 3,204 1,529 2,972 1,098 1,761 20,348 2,035Costa Rica 1,941 2,375 3,423 4,690 6,059 5,831 6,508 7,415 8,854 17,778 64,875 6,488Cote d'Ivoire 45 591 2,308 2,214 1,508 2,298 1,684 427 1,153 76 12,304 1,230Croatia 993 2,413 1,190 308 442 1,011 82 2,562 2,058 2,721 13,779 1,378Djibouti 222 266 302 292 268 428 496 345 339 434 3,392 339Dominica 28 12 52 26 41 46 75 150 127 121 678 6870 Global <strong>Financial</strong> Integrity
Country Names 2001 2002 2003 2004 2005 2006 2007 2008 2009 2010 Cumulative AverageDominican Republic 1,519 2,313 2,754 1,859 0 1,680 778 1,125 3,957 4,064 20,049 2,005Ecuador 1,819 2,032 808 1,827 1,441 2,724 1,827 6,022 267 1,010 19,777 1,978Egypt 1,124 3,993 5,728 8,062 2,750 13,494 13,818 6,842 2,913 2,033 60,757 6,076El Salvador 1,266 1,154 1,995 992 1,302 728 956 827 944 1,629 11,794 1,179Equatorial Guinea 848 177 410 322 175 360 917 1,968 2,876 2,904 10,956 1,096Eritrea . . . . . . . . . . . .Ethiopia 672 1,462 784 52 787 1,148 1,563 1,755 3,944 5,679 17,847 1,785Fiji 147 161 206 249 158 415 239 390 203 280 2,448 245Gabon 835 762 1,402 1,629 1,667 1,652 885 2,652 1,409 1,688 14,582 1,458Gambia, The 53 87 82 60 20 72 44 33 167 161 781 78Georgia 244 264 442 531 403 612 411 4,073 517 735 8,230 823Ghana 461 362 37 0 0 0 126 855 284 682 2,808 281Grenada 0 24 0 8 0 0 0 0 0 0 33 3Guatemala 1,998 1,339 1,301 4,471 1,744 910 1,929 878 3,366 2,387 20,324 2,032Guinea 304 189 264 451 295 358 700 261 0 378 3,199 320Guinea-Bissau 15 97 58 68 19 21 205 4 32 69 589 59Guyana 81 89 98 84 140 90 209 212 182 610 1,794 179Haiti 2 11 116 40 68 232 95 121 34 62 780 78Honduras 2,524 2,894 2,852 2,920 2,985 3,031 3,048 3,297 3,386 3,465 30,402 3,040Hungary 3,841 2,696 9,715 8,296 6,102 12,000 32,333 18,506 2,814 0 96,304 9,630India 7,172 8,102 9,447 22,609 30,404 16,109 4,923 38,452 5,698 0 142,917 14,292Indonesia 320 1,110 20,519 18,971 14,645 12,724 22,657 35,565 24,565 5,912 156,989 15,699Iran, Islamic Republic of 3,320 2,654 6,992 0 0 0 0 0 0 0 12,965 1,296Iraq . . . . 0 0 53,545 13,121 11,944 14,263 92,873 15,479Jamaica 235 303 820 602 823 1,137 1,728 582 509 1,698 8,437 844Jordan 663 393 802 767 0 961 0 97 132 0 3,815 381Kazakhstan 3,952 4,698 5,329 11,821 13,667 22,554 25,772 28,991 7,344 8,817 132,947 13,295Kenya 72 508 576 136 0 43 0 0 0 0 1,334 133Kiribati . . . . . . . . . . . .Kosovo, Republic of . . . . . . . . . 0 0 0Kuwait 7,769 7,767 16,110 15,613 30,041 45,124 55,583 53,405 1,403 19,878 252,693 25,269Kyrgyz Republic 0 66 112 403 0 61 0 306 308 0 1,255 126Lao PDR 0 624 0 160 93 1,007 1,789 1,009 829 398 5,909 591Latvia 836 1,787 2,020 3,164 791 3,912 11,654 161 1,035 0 25,361 2,536Lebanon 2,990 1,175 0 1,342 130 2,222 3,105 1,255 1,068 960 14,246 1,425Lesotho 18 283 205 278 74 176 314 330 553 62 2,293 229Liberia 0 1,054 1,001 988 948 1,593 1,828 608 1,040 631 9,691 969Libya 4,289 59 0 0 1,968 4,291 9,157 21,015 4,383 11,326 56,488 5,649Lithuania 110 433 0 1,926 0 3,964 5,373 2,540 2,883 2,752 19,980 1,998Macedonia, FYR 151 232 321 1,171 477 623 1,551 994 923 773 7,215 722Madagascar 24 128 159 797 460 1,643 121 682 185 32 4,232 423Malawi 135 115 249 209 470 418 453 860 696 684 4,289 429<strong>Illicit</strong> <strong>Financial</strong> <strong>Flows</strong> <strong>from</strong> <strong>Developing</strong> <strong>Countries</strong>: 2001-201071
Table 11. Non-normalized <strong>Illicit</strong> <strong>Financial</strong> <strong>Flows</strong> (CED Non-normalized+GER Non-normalized) (cont)(in millions of U.S. dollars)Country Names 2001 2002 2003 2004 2005 2006 2007 2008 2009 2010 Cumulative AverageMalaysia 20,466 20,156 22,303 19,579 38,719 44,582 47,702 67,963 46,678 81,231 409,378 40,938Maldives 151 148 103 68 38 44 4 0 0 0 556 56Mali 52 45 274 165 145 187 186 967 393 373 2,787 279Mauritania 0 20 133 0 . . . . . . 153 38Mauritius 215 2 117 40 0 0 0 166 301 13,310 14,152 1,415Mexico 46,423 34,811 38,640 48,114 52,688 54,560 80,476 72,450 34,578 43,560 506,301 50,630Moldova 224 308 292 337 241 310 506 507 228 498 3,452 345Mongolia 0 66 566 168 29 290 485 537 0 153 2,294 229Montenegro . . . . 925 860 1,198 1,473 1,890 896 7,242 1,207Morocco 343 632 2,752 700 3,382 2,644 3,460 1,465 1,931 821 18,128 1,813Mozambique 9 189 75 83 0 330 126 0 0 0 813 81Myanmar 366 1,166 1,035 735 206 901 1,831 1,278 1,140 19 8,677 868Namibia 412 337 1,269 1,278 692 2,163 1,723 841 1,626 1,625 11,965 1,196Nepal 603 1,010 506 537 501 710 804 776 1,618 1,703 8,769 877Nicaragua 436 443 525 650 954 1,120 1,174 1,213 1,130 1,256 8,902 890Niger 50 60 105 87 100 0 46 0 276 554 1,278 128Nigeria 3,753 5,135 9,751 14,035 14,939 14,775 29,595 40,847 27,732 32,877 193,438 19,344Oman 558 572 354 70 3,822 8,019 850 7,378 0 5,300 26,923 2,692Pakistan 0 2,026 3,522 1,852 0 0 505 4,060 298 482 12,745 1,274Panama 2,608 2,238 3,281 3,262 3,571 7,390 5,072 5,786 7,252 5,343 45,801 4,580Papua New Guinea 0 52 182 93 572 0 33 997 480 4,152 6,560 656Paraguay 156 684 234 376 0 1,224 627 1,729 1,447 1,732 8,209 821Peru 1,147 1,612 2,295 1,365 1,016 3,561 534 1,309 6,766 0 19,606 1,961Philippines 6,540 10,192 13,799 13,717 18,399 20,185 23,950 18,492 10,756 19,149 155,180 15,518Poland 2,786 10,931 20,110 20,834 0 31,781 42,867 0 14,180 812 144,301 14,430Qatar 5,258 4,108 4,537 9,771 15,382 23,430 26,194 49,767 42,604 41,972 223,022 22,302Romania 30 1,851 3,291 920 519 6,825 13,054 8,057 11,933 0 46,481 4,648Russian Federation 37,583 12,546 38,075 51,533 66,388 4,603 48,593 203,251 15,632 71,768 549,972 54,997Rwanda 50 56 57 221 35 90 126 88 371 490 1,584 158Samoa 51 86 118 79 322 116 142 143 103 115 1,274 127Sao Tome and Principe 0 0 0 0 0 0 0 0 0 0 0 0Saudi Arabia 7,740 2,680 27,627 50,755 49,351 52,677 59,678 42,665 85,317 65,908 444,399 44,440Senegal 9 54 0 0 6 0 0 0 0 0 69 7Serbia, Republic of 4,080 5,469 7,409 9,776 6,434 5,407 5,094 0 5,637 2,750 52,055 5,206Seychelles 82 210 232 94 184 372 297 0 123 0 1,594 159Sierra Leone 24 109 160 65 83 0 53 18 0 0 511 51Solomon Islands 28 25 35 98 88 94 136 171 91 153 918 92Somalia . . . . . . . . . . . .South Africa 11,323 5,099 1,148 3,052 4,113 10,927 19,838 21,006 18,117 3,615 98,237 9,824Sri Lanka 0 524 218 355 0 0 958 0 0 513 2,568 257St. Kitts and Nevis 31 0 9 0 12 4 0 0 0 0 56 6St. Lucia 0 0 0 0 25 0 14 190 0 0 229 2372 Global <strong>Financial</strong> Integrity
Country Names 2001 2002 2003 2004 2005 2006 2007 2008 2009 2010 Cumulative AverageSt. Vincent and the Grenadines 0 0 0 0 0 0 0 0 0 0 0 0Sudan 376 490 1,140 1,018 139 70 1,620 10,973 5,663 11,095 32,583 3,258Suriname 56 106 74 120 115 31 9 274 53 429 1,267 127Swaziland 38 282 154 283 133 348 771 389 410 239 3,046 305Syrian Arab Republic 13,085 93 91 13,209 1,078 2,873 1,321 1,558 1,088 158 34,553 3,455Tajikistan 0 104 0 58 0 254 148 1,761 0 0 2,327 233Tanzania 0 607 0 956 0 0 0 0 40 71 1,674 167Thailand 1,898 1,490 2,957 4,715 8,352 6,095 10,517 14,880 14,894 8,534 74,332 7,433Timor-Leste, Dem. Rep. of . . . . . 619 1,039 2,081 1,335 1,588 6,663 1,333Togo 154 129 320 151 168 131 227 438 200 120 2,037 204Tonga 17 15 538 3,339 9 13 43 19 6 13 4,013 401Trinidad and Tobago 634 1,886 2,892 4,412 4,470 7,119 7,691 9,093 5,931 8,748 52,877 5,288Tunisia 917 2,476 2,327 334 0 1,296 1,716 0 0 0 9,066 907Turkey 6,266 12,537 6,330 2,357 1,736 17,775 25,068 11,138 8,244 3,558 95,007 9,501Turkmenistan 694 685 600 . . . . . . . 1,978 659Uganda 26 311 715 498 362 456 676 1,187 1,309 1,261 6,801 680Ukraine 8,885 3,975 4,479 11,866 2,779 20,852 21,247 15,546 16,038 8,910 114,577 11,458United Arab Emirates 5,700 7,208 16,966 27,131 44,290 50,825 45,068 97,739 24,792 8,691 328,409 32,841Uruguay 519 4,103 353 979 286 139 763 132 1,491 3,071 11,835 1,184Uzbekistan . . 606 792 728 1,356 2,988 3,134 4,787 3,825 18,216 2,277Vanuatu 18 20 1 5 0 0 6 0 26 0 75 8Venezuela, Rep. Bolivariana de 6,632 9,825 8,527 16,901 30,970 18,386 28,866 29,122 14,944 18,885 183,057 18,306Vietnam 1,471 1,085 25 1,876 305 0 0 264 12,968 11,049 29,044 2,904Yemen, Republic of 98 233 0 0 0 131 468 1,910 0 0 2,839 284Zambia 95 0 439 1,121 1,279 465 1,999 357 450 2,631 8,835 884Zimbabwe 342 992 197 297 360 1,787 96 14 103 0 4,189 419Source: Staff estimates, Global <strong>Financial</strong> Integrity, based on official balance of payments and trade data reported to the IMF by member countries andexternal debt data reported to the World Bank by those countries.<strong>Illicit</strong> <strong>Financial</strong> <strong>Flows</strong> <strong>from</strong> <strong>Developing</strong> <strong>Countries</strong>: 2001-201073
Table 12. <strong>Countries</strong> for which estimation of illicit flowscould not be <strong>com</strong>pleted due to missing dataCountryHMNGERDOTS IFS HK-MO Exports F.O.B.Afghanistan x xAlgeriaxAngolaxAntigua and BarbudaxAzerbaijan, Republic ofxBelarusxBhutan x xBrunei Darussalam x xBurkina FasoxCape VerdexCentral African Republic xChad x xComorosxCongoxEquatorial GuineaxEritrea x x x xGabonxGambiaxGrenadaxGuinea-BissauxIran, Islamic Republic of xIraq x xKiribati x x x x xKosovo, Republic of x x x x xKyrgyz RepublicxLebanonxLiberia x xMadagascarxMauritania x xMontenegro x xNigerxSamoaxSao Tome and PrincipexSerbia, Republic ofxSomalia x x xSt. Kitts and NevisxSt. LuciaxSt. Vincent and the GrenadinesxTajikistan x xTimor-Leste, Dem. Rep. of x x x x xTongaxTurkmenistan x x xUzbekistan x x x xVanuatuxZimbabwexCountry HMN GERAfghanistanxAlgeriaxAngolaAntigua and BarbudaxAzerbaijan, Republic ofBelarusBhutan x xBrunei DarussalamxBurkina FasoxCape VerdexCentral African RepublicxChadxComorosxCongoxEquatorial GuineaxEritrea x xGabonxGambiaxGrenadaGuinea-BissauxIran, Islamic Republic ofxIraqxKiribati x xKosovo, Republic of x xKyrgyz RepublicLebanonxLiberiaxMadagascarxMauritaniaxMontenegroxNigerxSamoaxSao Tome and PrincipeSerbia, Republic ofxSomaliaxSt. Kitts and NevisSt. LuciaSt. Vincent and the GrenadinesTajikistanxTimor-Leste, Dem. Rep. of x xTongaxTurkmenistanxUzbekistanxVanuatuZimbabwexNote: An X indicates missing data in each specified category for some or all years over the period 2001-2010.Note: HMN refers to balance of payments data required for estimation of the Hot Money Narrow method, DOTS refers to Direction ofTrade Statistics world trade data, HK-MO refers to Hong Kong and Macao trade data within the Direction of Trade Statistics, andExports f.o.b. refers to exports f.o.b. data <strong>from</strong> the International <strong>Financial</strong> Statistics (IFS) database.74 Global <strong>Financial</strong> Integrity
Table 13. Geographical RegionsAfrica (48) Asia (27) <strong>Developing</strong> Europe (27) MENA (15) Western Hemisphere (33)Angola Afghanistan, Islamic Republic of Albania Algeria Antigua and BarbudaBenin Bangladesh Armenia, Republic of Bahrain, Kingdom of ArgentinaBotswana Bhutan Azerbaijan, Republic of Egypt ArubaBurkina Faso Brunei Darussalam Belarus Iran, Islamic Republic of Bahamas, TheBurundi Cambodia Bosnia and Herzegovina Iraq BarbadosCameroon China, P.R.: Mainland Bulgaria Jordan BelizeCape Verde Fiji Croatia Kuwait BoliviaCentral African Republic India Cyprus Lebanon BrazilChad Indonesia Georgia Libya ChileComoros Kiribati Hungary Morocco ColombiaCongo, Democratic Republic of Lao People's Democratic Republic Kazakhstan Oman Costa RicaCongo, Republic of Malaysia Kosovo, Republic of Saudi Arabia DominicaCote d'Ivoire Maldives Kyrgyz Republic Syrian Arab Republic Dominican RepublicDjibouti Mongolia Latvia Tunisia EcuadorEquatorial Guinea Myanmar Lithuania Yemen, Republic of El SalvadorEritrea Nepal Macedonia, FYR GrenadaEthiopia Pakistan Malta GuatemalaGabon Papua New Guinea Moldova GuyanaGambia, The Philippines Montenegro HaitiGhana Samoa Poland HondurasGuinea Solomon Islands Romania JamaicaGuinea-Bissau Sri Lanka Russian Federation MexicoKenya Thailand Serbia, Republic of NicaraguaLesotho Timor-Leste, Dem. Rep. of Tajikistan PanamaLiberia Tonga Turkey ParaguayMadagascar Vanuatu Turkmenistan PeruMalawi Vietnam Ukraine St. Kitts and NevisMaliSt. LuciaMauritaniaSt. Vincent and the GrenadinesMauritiusSurinameMozambiqueTrinidad and TobagoNamibiaUruguayNigerVenezuela, Republica Bolivariana deNigeriaRwandaSao Tome and PrincipeSenegalSeychellesSierra LeoneSomaliaSouth AfricaSudanSwazilandTanzaniaTogoUgandaZambiaZimbabweNote: The total number of countries included in our analysis is 150.<strong>Illicit</strong> <strong>Financial</strong> <strong>Flows</strong> <strong>from</strong> <strong>Developing</strong> <strong>Countries</strong>: 2001-201075
Table 14. Largest Sovereign Wealth Funds by Assets Under Management,<strong>Developing</strong> <strong>Countries</strong>(As of End-October 2012, in billions of U.S. dollars)Country Sovereign Wealth Fund Name Assets Year Type Average IFFsAlgeria Revenue Regulation Fund 56.7 2000 Oil 1.6Angola Fundo Soberano de Angola 5.0 2012 Oil 2.6Australia Australian Future Fund 78.2 2006 Non-Commodity n/aAzerbaijan, Republic of State Oil Fund 32.7 1999 Oil n/aBahrain, Kingdom of Mumtalakat Holding Company 9.1 2006 Non-Commodity 3.1Botswana Pula Fund 6.9 1994 Diamonds & Minerals 1.4Brazil Sovereign Fund of Brazil 11.3 2008 Non-Commodity 7.4Brunei Darussalam Brunei Investment Agency 30.0 1983 Oil 4.2Canada Alberta’s Heritage Fund 15.9 1976 Oil n/aChile Total 20.4 n/a Copper 12.7Chile Social and Economic Stabilization Fund 14.7 2007 Copper n/aChile Pension Reserve Fund 5.7 2006 Copper n/aChina, Mainland Total 1,189.4 n/a Non-Commodity 301.4China 2/ SAFE Investment Company 567.9 1997 Non-Commodity n/aChina China Investment Corporation 482.0 2007 Non-Commodity n/aChina National Social Security Fund 134.5 2000 Non-Commodity n/aChina China-Africa Development Fund 5.0 2007 Non-Commodity n/aChina – Hong Kong Hong Kong Monetary Authority Investment Portfolio 293.3 1993 Non-Commodity n/aTimor-Leste Timor-Leste Petroleum Fund 10.2 2005 Oil & Gas n/aEquatorial Guinea Fund for Future Generations 0.1 2002 Oil 1.1France Strategic Investment Fund 28.0 2008 Non-Commodity n/aGabon Gabon Sovereign Wealth Fund 0.4 1998 Oil 1.5Indonesia Government Investment Unit 0.3 2006 Non-Commodity 15.7Iran, Islamic Republic of National Development Fund of Iran 40.0 2011 Oil & Gas 1.3Ireland National Pensions Reserve Fund 17.5 2001 Non-Commodity n/aItaly Italian Strategic Fund 1.4 2011 Non-Commodity n/aKazakhstan Kazakhstan National Fund 61.8 2000 Oil 13.3Kiribati Revenue Equalization Reserve Fund 0.4 1956 Phosphates .Kuwait Kuwait Investment Authority 296.0 1953 Oil 25.3Libya Libyan Investment Authority 65.0 2006 Oil 5.6Malaysia Khazanah Nasional 34.0 1993 Non-Commodity 40.9Mauritania National Fund for Hydrocarbon Reserves 0.3 2006 Oil & Gas .0Mexico Oil Revenues Stabilization Fund of Mexico 6.0 2000 Oil 50.6Mongolia Fiscal Stability Fund n/a 2011 Minerals .2New Zealand New Zealand Superannuation Fund 15.5 2003 Non-Commodity n/aNigeria Nigerian Sovereign Investment Authority 1.0 2011 Oil 19.3Norway Government Pension Fund – Global 656.2 1990 Oil n/aOman Total 8.2 n/a Oil & Gas 2.7Oman State General Reserve Fund 8.2 1980 Oil & Gas n/aOman Oman Investment Fund n/a 2006 Oil n/aPalestine Palestine Investment Fund 0.8 2003 Non-Commodity n/aPapua New Guinea Papua New Guinea Sovereign Wealth Fund n/a 2011 Gas .7Peru Fiscal Stabilization Fund 7.1 1999 Non-Commodity 2.0Qatar Qatar Investment Authority 115.0 2005 Oil 22.3Russian Federation 3/ National Welfare Fund 149.7 2008 Oil 55.0Saudi Arabia Total 538.1 n/a Oil 44.4Saudi Arabia SAMA Foreign Holdings 532.8 n/a Oil n/aSaudi Arabia Public Investment Fund 5.3 2008 Oil n/aSingapore Total 405.0 n/a Non-Commodity n/aSingapore Government of Singapore Investment Corporation 247.5 1981 Non-Commodity n/aSingapore Temasek Holdings 157.5 1974 Non-Commodity n/aSouth Korea Korea Investment Corporation 43.0 2005 Non-Commodity n/aTrinidad and Tobago Heritage and Stabilization Fund 2.9 2000 Oil 5.3United Arab Emirates Total 816.6 n/a Oil 32.8UAE – Abu Dhabi Abu Dhabi Investment Authority 627.0 1976 Oil n/aUAE – Abu Dhabi International Petroleum Investment Company 65.3 1984 Oil n/aUAE – Abu Dhabi Mubadala Development Company 53.1 2002 Oil n/aUAE – Abu Dhabi Abu Dhabi Investment Council n/a 2007 Oil n/aUAE – Dubai Investment Corporation of Dubai 70.0 2006 Oil n/aUAE – Federal Emirates Investment Authority n/a 2007 Oil n/aUAE – Ras Al Khaimah RAK Investment Authority 1.2 2005 Oil n/aUnited States Total 90.7 n/a n/a n/aUS – Alabama Alabama Trust Fund 2.5 1985 Oil & Gas n/aUS – Alaska Alaska Permanent Fund 42.3 1976 Oil n/aUS – New Mexico New Mexico State Investment Council 14.3 1958 Non-Commodity n/aUS – North Dakota North Dakota Legacy Fund 0.5 2011 Oil & Gas n/aUS – Texas Texas Permanent School Fund 25.5 1854 Oil & Other n/aUS – Wyoming Permanent Wyoming Mineral Trust Fund 5.6 1974 Minerals n/aVenezuela, Rep. Bolivariana de FEM 0.8 1998 Oil 18.3Vietnam State Capital Investment Corporation 0.5 2006 Non-Commodity 2.91/ Source: Sovereign Wealth Fund Institute; All figures quoted are <strong>from</strong> official sources, or, where the institutions concerned do not report theirassets, <strong>from</strong> other publicly available sources. Some of these figures are best estimates as market values change daily.2/ This number is an estimate by the Sovereign Wealth Fund Institute analysts.3/ Includes the oil stabilization fund of Russia.76 Global <strong>Financial</strong> Integrity
Table 15. Net Errors and Omissions in Relation to <strong>Financial</strong> Account for 10 <strong>Countries</strong>with the Largest Sovereign Wealth Funds 1/ 2/(in billions of U.S.dollars or in percent)Country 3/SWF Assets andConcept 4/ 2001 2002 2003 2004 2005 2006 2007 2008 2009 2010 AverageChina, Mainland 5/ (1,189)<strong>Financial</strong> Account 12.6 42.9 50.8 81.6 159.4 239.5 369.6 442.5 205.8 189.5 179.4Net Errors and Omissions -4.7 7.5 7.8 12.8 22.9 3.6 13.3 18.8 -41.4 -52.9 18.6NEO/FA 37.5 17.5 15.3 15.6 14.4 1.5 3.6 4.3 20.1 27.9 15.8United Arab Emirates 6/ (817)<strong>Financial</strong> Account -1.5 -10.7 -7.8 -8.4 -14.7 -17.8 28.7 -19.9 8.4 5.8 12.4Net Errors and Omissions -4.6 8.3 -0.8 -1.0 -5.5 -11.8 6.5 -51.7 -23.5 -7.6 12.1NEO/FA 306.7 77.6 10.3 11.9 37.4 66.3 22.6 259.8 279.8 131.0 120.3Norway (656)<strong>Financial</strong> Account 26.2 17.3 22.1 27.5 51.4 44.8 19.4 77.6 57.0 40.5 38.4Net Errors and Omissions -1.2 -6.8 -6.3 -5.3 1.8 -11.0 -30.2 4.9 15.9 -11.3 9.5NEO/FA 4.6 39.5 28.6 19.3 3.4 24.5 156.0 6.3 27.9 27.8 33.8Saudi Arabia 7/ (533)<strong>Financial</strong> Account 9.4 11.9 28.0 51.9 55.3 78.5 77.8 102.3 -39.8 32.4 48.7Net Errors and Omissions 0.0 0.0 0.0 0.0 -34.8 -20.6 -15.6 -30.0 -60.8 -34.4 19.6NEO/FA 0.0 0.0 0.0 0.0 62.8 26.2 20.1 29.4 152.7 106.2 39.7Singapore (405)<strong>Financial</strong> Account 7.8 12.1 24.6 19.5 27.8 36.4 45.6 28.5 34.0 55.1 29.2Net Errors and Omissions -3.3 0.5 3.0 0.6 1.0 0.7 -0.2 2.2 3.9 -0.4 1.6NEO/FA 42.8 4.5 12.2 2.9 3.5 2.0 0.5 7.7 11.3 0.8 8.8Kuwait (296)<strong>Financial</strong> Account 8.4 4.1 10.3 17.4 33.3 53.1 38.1 51.9 30.4 47.0 29.4Net Errors and Omissions -2.9 -1.9 -0.6 1.5 2.5 7.1 -4.7 -10.0 1.0 6.6 3.9NEO/FA 34.2 45.9 5.6 8.8 7.6 13.3 12.4 19.4 3.4 14.0 16.5China, Hong Kong (293)<strong>Financial</strong> Account 11.3 17.4 21.9 23.4 22.8 26.6 34.6 31.8 24.7 24.9 23.9Net Errors and Omissions 2.7 7.0 6.5 8.0 3.3 4.1 7.7 0.2 2.1 7.2 4.9NEO/FA 23.9 40.1 29.8 34.1 14.4 15.3 22.2 0.7 8.4 29.1 21.8Russian Federation 8/ (150)<strong>Financial</strong> Account 15.0 10.7 25.2 52.0 63.9 104.4 54.2 92.7 35.0 62.9 51.6Net Errors and Omissions -9.6 -6.1 -9.2 -5.9 -7.9 9.5 -13.3 -11.3 -1.7 -8.3 8.3NEO/FA 63.6 57.1 36.4 11.3 12.4 9.1 24.6 12.2 4.9 13.2 24.5Qatar 6/ (115)<strong>Financial</strong> Account -2.5 -2.6 -3.0 -8.6 -6.6 -9.6 -16.1 -29.1 2.1 -7.8 8.8Net Errors and Omissions -2.2 -1.0 -1.3 2.5 -5.6 -4.7 1.2 -2.3 -2.2 -11.4 3.4NEO/FA 88.8 39.1 42.1 29.3 84.6 49.2 7.6 7.9 103.3 145.9 59.8United States (91)<strong>Financial</strong> Account -0.4 -0.5 -0.5 -0.5 -0.7 -0.8 -0.6 -0.7 -0.2 -0.4 0.5Net Errors and Omissions 0.0 0.0 0.0 0.1 0.0 0.0 0.1 -0.1 0.1 0.1 0.1NEO/FA 4.2 8.6 2.2 17.5 4.6 0.8 15.0 8.1 59.4 15.5 13.61/ Source: Sovereign Wealth Fund Institue, IMF Balance of Payments database, IMF country reports.2/ SWF is sovereign wealth fund, NEO is net errors and omissions, FA is financial account. Averages of NEO and FA are averages of the absolutevalues.3/ Ranked by size of sovereign wealth fund. China, UAE, Saudi Arabia, Singapore, the United States SWF data repressent the total of all SWFs.4/ Sovereign Wealth Fund data has been updated through 2012.5/ SAFE Investment Company SWF data are estimates.6/ Net errors and omissions and financial account data United Arab Emirates and Qatar are taken <strong>from</strong> IMF country reports.7/ NEO, FA, and NEO/FA averages are calculated <strong>from</strong> 2005-2010, the years for which data are available.8/ This includes the oil stabilization fund of Russia.<strong>Illicit</strong> <strong>Financial</strong> <strong>Flows</strong> <strong>from</strong> <strong>Developing</strong> <strong>Countries</strong>: 2001-201077
78 Global <strong>Financial</strong> Integrity
<strong>Illicit</strong> <strong>Financial</strong> <strong>Flows</strong> <strong>from</strong> <strong>Developing</strong> <strong>Countries</strong>: 2001-201079
A Program of the Center for International Policy1100 17th Street, NW, Suite 505 | Washington, DC | 20036Tel. +1 (202) 293-0740 | Fax. +1 (202) 293-1720 | www.gfintegrity.orgDirector: Raymond Baker, Managing Director: Tom CardamoneAdvisory Board: Lord Daniel Brennan (Co-Chair), Krishen Mehta (Co-Chair),Jack Blum, Rafael Espada, John Heimann, Ken Jensen, David Landes, Robert Morgenthau,Moisés Naím, Ngozi Okonjo-Iweala, Thomas Pogge, John Whitehead