Illicit Financial Flows from Developing Countries ... - culturaRSC.com
Illicit Financial Flows from Developing Countries ... - culturaRSC.com
Illicit Financial Flows from Developing Countries ... - culturaRSC.com
- No tags were found...

Create successful ePaper yourself
Turn your PDF publications into a flip-book with our unique Google optimized e-Paper software.
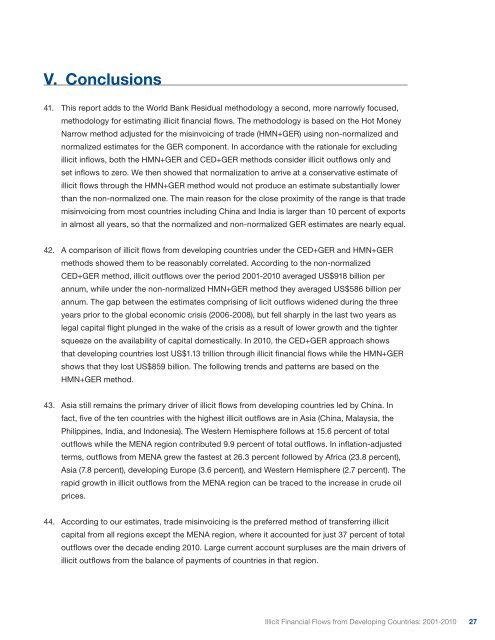
V. Conclusions41. This report adds to the World Bank Residual methodology a second, more narrowly focused,methodology for estimating illicit financial flows. The methodology is based on the Hot MoneyNarrow method adjusted for the misinvoicing of trade (HMN+GER) using non-normalized andnormalized estimates for the GER <strong>com</strong>ponent. In accordance with the rationale for excludingillicit inflows, both the HMN+GER and CED+GER methods consider illicit outflows only andset inflows to zero. We then showed that normalization to arrive at a conservative estimate ofillicit flows through the HMN+GER method would not produce an estimate substantially lowerthan the non-normalized one. The main reason for the close proximity of the range is that trademisinvoicing <strong>from</strong> most countries including China and India is larger than 10 percent of exportsin almost all years, so that the normalized and non-normalized GER estimates are nearly equal.42. A <strong>com</strong>parison of illicit flows <strong>from</strong> developing countries under the CED+GER and HMN+GERmethods showed them to be reasonably correlated. According to the non-normalizedCED+GER method, illicit outflows over the period 2001-2010 averaged US$918 billion perannum, while under the non-normalized HMN+GER method they averaged US$586 billion perannum. The gap between the estimates <strong>com</strong>prising of licit outflows widened during the threeyears prior to the global economic crisis (2006-2008), but fell sharply in the last two years aslegal capital flight plunged in the wake of the crisis as a result of lower growth and the tightersqueeze on the availability of capital domestically. In 2010, the CED+GER approach showsthat developing countries lost US$1.13 trillion through illicit financial flows while the HMN+GERshows that they lost US$859 billion. The following trends and patterns are based on theHMN+GER method.43. Asia still remains the primary driver of illicit flows <strong>from</strong> developing countries led by China. Infact, five of the ten countries with the highest illicit outflows are in Asia (China, Malaysia, thePhilippines, India, and Indonesia). The Western Hemisphere follows at 15.6 percent of totaloutflows while the MENA region contributed 9.9 percent of total outflows. In inflation-adjustedterms, outflows <strong>from</strong> MENA grew the fastest at 26.3 percent followed by Africa (23.8 percent),Asia (7.8 percent), developing Europe (3.6 percent), and Western Hemisphere (2.7 percent). Therapid growth in illicit outflows <strong>from</strong> the MENA region can be traced to the increase in crude oilprices.44. According to our estimates, trade misinvoicing is the preferred method of transferring illicitcapital <strong>from</strong> all regions except the MENA region, where it accounted for just 37 percent of totaloutflows over the decade ending 2010. Large current account surpluses are the main drivers ofillicit outflows <strong>from</strong> the balance of payments of countries in that region.<strong>Illicit</strong> <strong>Financial</strong> <strong>Flows</strong> <strong>from</strong> <strong>Developing</strong> <strong>Countries</strong>: 2001-201027