e-learning readiness - Asia Pacific Region - Open University Malaysia
e-learning readiness - Asia Pacific Region - Open University Malaysia
e-learning readiness - Asia Pacific Region - Open University Malaysia
- No tags were found...

You also want an ePaper? Increase the reach of your titles
YUMPU automatically turns print PDFs into web optimized ePapers that Google loves.
e-<strong>learning</strong> <strong>readiness</strong>e-<strong>learning</strong><strong>Malaysia</strong>2004<strong>readiness</strong>in in <strong>Malaysia</strong> <strong>readiness</strong>2005A Joint Study by theMinistry of Energy, Water andCommunications, <strong>Malaysia</strong>and <strong>Open</strong> <strong>University</strong> <strong>Malaysia</strong>Editors:Zoraini Wati AbasKuldip KaurHairudin HarunMinistry of Energy, Waterand Communications,<strong>Malaysia</strong>
<strong>Open</strong> <strong>University</strong> <strong>Malaysia</strong>Project Director: Hairudin Harun, Ph.D.Head, Research Project/Lead Researcher: Zoraini Wati Abas, Ed.D.Editors: Zoraini Wati Abas, Kuldip Kaur, Hairuddin HarunE-<strong>learning</strong> Readiness in <strong>Malaysia</strong> 2004 Study is a joint initiative of the Ministry of Energy, Waterand Communication, <strong>Malaysia</strong> and <strong>Open</strong> <strong>University</strong> <strong>Malaysia</strong>.For more information, contact:Zoraini Wati Abas, Ed.D.Head, Research Project/Lead ResearcherE-<strong>learning</strong> Readiness in <strong>Malaysia</strong> 2004Centre for Quality Management and Research & Innovation<strong>Open</strong> <strong>University</strong> <strong>Malaysia</strong>Jalan Tun Ismail50480 Kuala Lumpur<strong>Malaysia</strong>Phone: +603 2773 2002Fax: +603 2697 8824Email: zoraini@oum.edu.myISBN 983-3240-71-2© <strong>Open</strong> <strong>University</strong> <strong>Malaysia</strong>This study was jointly funded by the Ministry of Energy, Water and Communication, <strong>Malaysia</strong>(MEWC) and <strong>Open</strong> <strong>University</strong> <strong>Malaysia</strong> (OUM). Free use of the material is allowed for nonprofitablepurposes provided that credit is given to MEWC and OUM.Cover designed by Center for Instructional Design and Technology, OUM.
E-LEARNING READINESSIN MALAYSIA 2004
E-<strong>learning</strong> Readiness in <strong>Malaysia</strong> 2004ACKNOWLEDGEMENTSThis national study to serve E-<strong>learning</strong> Readiness in <strong>Malaysia</strong> was carried outfor the joint interest by the Ministry of Energy, Water and Communication<strong>Malaysia</strong> and the <strong>Open</strong> <strong>University</strong> <strong>Malaysia</strong>. Funded by both organisations,this study was successfully completed following contributions byacademicians, researchers and practitioners of E-<strong>learning</strong> at the <strong>Open</strong><strong>University</strong> <strong>Malaysia</strong> as well as those from public and private highereducation institutions, research and training organisations. The editorsacknowledge the contributions made by the following individuals:-Professor Dr Abd. Razak Habib, <strong>Open</strong> <strong>University</strong> <strong>Malaysia</strong>Professor Dr Abu Talib Othman, UniKLProfessor Dr Kasiran Buang, <strong>Open</strong> <strong>University</strong> <strong>Malaysia</strong>Professor Dr Khairuddin Hashim, <strong>University</strong> Tun Abdul Abdul RazakProfessor Dr Mohammed Yusoff, <strong>Open</strong> <strong>University</strong> <strong>Malaysia</strong>Professor Dr Nuraihan Mat Daud, International Islamic <strong>University</strong>Professor Dr Szarina Abdullah, Universiti Institut Technology MARAAssociate Professor Dr Abtar Kaur, <strong>Open</strong> <strong>University</strong> <strong>Malaysia</strong>Associate Professor Dr Ahmad Hashem, <strong>Open</strong> <strong>University</strong> <strong>Malaysia</strong>Associate Professor Dr Halimah Awang, <strong>University</strong> of MalayaAssociate Professor Dr Latifah Abdol Latif, <strong>Open</strong> <strong>University</strong> <strong>Malaysia</strong>Associate Professor Dr Mardziah Hayati Abdullah, Universiti Putra <strong>Malaysia</strong>Associate Professor Dr Rahmah Hashim, <strong>Open</strong> <strong>University</strong> <strong>Malaysia</strong>Associate Professor Dr Raja Maznah Raja Hussain, <strong>University</strong> of MalayaAssociate Professor Dr Syed Abdullah Syed Othman, <strong>Open</strong> <strong>University</strong><strong>Malaysia</strong>Dr Aini Ibrahim, Bank Negara <strong>Malaysia</strong>Dr Norizan Abdul Razak, National <strong>University</strong> <strong>Malaysia</strong>Dr Norrizan Razali, <strong>Malaysia</strong>n Development CorporationDr Tina Lim Swee Kim, Ipoh Teachers’ Training CollegeAzizah Hamzah, Ministry of Science, Technology and InnovationChng Loi Peng, <strong>Open</strong> <strong>University</strong> <strong>Malaysia</strong>Fitri Suraya Mohamad, UNIMASNik Azlina Nik Yaakob, <strong>Open</strong> <strong>University</strong> <strong>Malaysia</strong>Norhaizan Mat Talha, MIMOS (<strong>Malaysia</strong>n Institute of MicroelectronicsSystems)Rohani Ismail, MIMOS (<strong>Malaysia</strong>n Institute of Microelectronics Systems)Rokiah Idris, Ministry of Energy, Water and CommunicationsRubaiah Hashim, Ministry of Energy, Water and CommunicationsSanthi Raghavan, <strong>Open</strong> <strong>University</strong> <strong>Malaysia</strong>Sukor ‘Ain, UniKLJoint Study by MEWC and OUMi
E-<strong>learning</strong> Readiness in <strong>Malaysia</strong> 2004Sulaiman Sarkawi, Universiti Pendidikan Sultan IdrisTengku Putri Norishah Tengku Shariman, Multimedia <strong>University</strong>Turidi Mat, Ministry of Energy, Water and CommunicationsWe are also indebted and thankful to those who supported and helpedadminister the survey forms in their respective organisations. Without theirkind help and coorporation, the study would not have been completed. Wethank all respondents of the study for having taken the time to answer thesurvey questions and for giving the valuable feedback.Last but not least, we thank our meticulous editorial assistants HazlizaHazlan and Iryanty Mohd Omar as weel as our valuable research assistantsIna Masniza Isa, Lily Suriyani Zahari, Siti Haslinah Abdul Rahman and Novela/l Lydon.Joint Study by MEWC and OUMii
E-<strong>learning</strong> Readiness in <strong>Malaysia</strong> 2004TERMS OF REFERENCE1. In November 2003, <strong>Open</strong> <strong>University</strong> <strong>Malaysia</strong> (OUM) was given thetask of putting together a steering a committee for the study of E-<strong>learning</strong> Readiness among <strong>Malaysia</strong>ns by the Ministry of Energy,Water and Communications (MEWC), <strong>Malaysia</strong>.2. The focus of the study was E-<strong>learning</strong> Readiness of individualsenrolled in or connected with the provision of E-<strong>learning</strong> solutions in<strong>Malaysia</strong>n tertiary institutions. For the purpose of data collection,online and printed questionnaires were administrated among fourgroups of respondents: policy makers, E-<strong>learning</strong> providers, enablers(lecturers or trainers), and receivers (students or trainees).3. The instruments used in the study were developed by a group ofacademics and researchers from several research, training andtertiary institutions, under the purview of <strong>Open</strong> <strong>University</strong> <strong>Malaysia</strong>.4. The study was aimed at providing empirical data on E-<strong>learning</strong>Readiness among <strong>Malaysia</strong>ns, and outlining recommendationsrelated to the following areas of capacity building:a. Human Resource Developmentb. Research and Developmentc. Infrastructured. Infostructuree. Institutional Frameworkf. Policy Initiativesg. Benchmarking5. It was determined that the Centre for Quality Management andResearch & Innovation (CQMRI), OUM, and MEWC will have jointownership of the results of the research and related products.Joint Study by MEWC and OUMiii
E-<strong>learning</strong> Readiness in <strong>Malaysia</strong> 2004TABLE OF CONTENTSPageAcknowledgements .................................................................................................. iTerms of Reference..................................................................................................iiiTable of Contents ....................................................................................................ivList of Tables............................................................................................................. vList of Figures .........................................................................................................viiList of Appendixes ................................................................................................viiiChapter1 Introduction ....................................................................................................... 11.1 The Study ................................................................................................ 11.2 Literature Review................................................................................... 41.3 Research Questions ................................................................................ 61.4 Methodology........................................................................................... 72 Policy Makers and Organisations ................................................................. 142.1 Demographic Profile............................................................................ 142.2 Patterns of Readiness........................................................................... 162.3 Overall Perceptions.............................................................................. 212.4 Summary ............................................................................................... 223 Providers .......................................................................................................... 283.1 Demographic Profile............................................................................ 283.2 Patterns of Readiness........................................................................... 343.3 Perception of Overall Perceptions...................................................... 413.4 Summary ............................................................................................... 494 Enablers............................................................................................................ 504.1 Demographic Profile............................................................................ 504.2 Patterns of Readiness........................................................................... 544.3 Perception of Readiness....................................................................... 624.4 Summary ............................................................................................... 695 Receivers .......................................................................................................... 705.1 Demographic Profile............................................................................ 705.2 Patterns of Readiness........................................................................... 775.3 Perception of Readiness....................................................................... 855.4 Summary ............................................................................................... 916 Summary and Recommendations................................................................. 926.1 Summary ............................................................................................... 926.2 Recommendation ............................................................................... 103References ............................................................................................................. 109Appendixes ........................................................................................................... 110Joint Study by MEWC and OUMiv
E-<strong>learning</strong> Readiness in <strong>Malaysia</strong> 2004LIST OF TABLESPageTABLE 1. Areas of Readiness Measured for the Respective Target.................8TABLE 2. Demographic Profile of Policy Makers.............................................15TABLE 3. Policy Makers’ Perceptions of Management Readiness.................17TABLE 4. Policy Makers’ Perceptions of Personnel Readiness.......................18TABLE 5. Policy Makers’ Perceptions of Technical Readiness .......................18TABLE 6. Policy Makers’ Perceptions of Environmental Readiness..............19TABLE 7. Policy Makers’ Perceptions of Cultural Readiness .........................19TABLE 8. Policy Makers’ Perceptions of Financial Readiness........................20TABLE 9. Factors Hindering Organisations from Expanding E-<strong>learning</strong>Efforts ...................................................................................................21TABLE 10. Mean Score of Overall Readiness among Policy Makers...............22TABLE 11. Level of Overall Readiness among Policy Makers........................233TABLE 12. Demographic Profile of Providers ....................................................29TABLE 13. Number of Students Enrolled............................................................30TABLE 14. Ideal Bandwidth to Deliver E-<strong>learning</strong> ............................................30TABLE 15. Standards in E-<strong>learning</strong> ......................................................................31TABLE 16. LMS/LCMS used/to be used ..............................................................31TABLE 17. Provision of Applications and Services to Support E-<strong>learning</strong>.....32TABLE 18. Security Features Employed in Networks and Resource Servers.33TABLE 19. Connection to the Internet..................................................................33TABLE 20. Preference for Single point of Access for Local E-<strong>learning</strong> Content...............................................................................................................33TABLE 21. Providers’ Perceptions of Personnel Readiness ..............................35TABLE 22. Providers’ Perceptions of Content Readiness..................................36TABLE 23. Providers’ Perceptions of Technical Readiness...............................37TABLE 24. Providers’ Perceptions of Environmental Readiness .....................39TABLE 25. Providers’ Perceptions of Financial Readiness................................40TABLE 26. Factors Hindering Organisations from Expending E-<strong>learning</strong>Efforts ...................................................................................................41TABLE 27. Mean Score of Overall Readiness among Providers.......................42TABLE 28. Level of Overall Readiness among Providers..................................44TABLE 29. Demographic Profile of Enablers ......................................................50TABLE 30. Computer Use among Enablers.........................................................52TABLE 31. Popular Uses of Computer among Enablers ...................................52TABLE 32. Internet Use among Enablers.............................................................53TABLE 33. Preferred Channels of Communication among Enablers ..............54TABLE 34. Preferred Mode/Media of Learning among Enablers.....................54TABLE 35. Enablers’ Perceptions of Learner Readiness....................................55TABLE 36. Enablers’ Perceptions of Management Readiness...........................56TABLE 37. Enablers’ Perceptions of Personnel Readiness ................................57TABLE 38. Enablers’ Perceptions of Content Readiness....................................58TABLE 39. Enablers’ Perceptions of Technical Readiness.................................59Joint Study by MEWC and OUMv
E-<strong>learning</strong> Readiness in <strong>Malaysia</strong> 2004TABLE 40. Enablers’ Perceptions of Environmental Readiness .......................59TABLE 41. Enablers’ Perceptions of Cultural Readiness..................................60TABLE 42. Enablers’ Perceptions of Financial Readiness..................................61TABLE 43. Mean Score of Overall Readiness among Enablers.........................62TABLE 44. Level of Overall Readiness among Enablers ...................................63TABLE 45. Number of Receivers According to Age ..........................................70TABLE 46. Receivers’ Place of Permanent Residence ........................................71TABLE 47. Organisation Enrolment/Attendance................................................71TABLE 48. Type of Course/training: ....................................................................72TABLE 49. Enrolment Status .................................................................................72TABLE 50. Computer Access among Receivers..................................................72TABLE 51. Frequency of Computer Use..............................................................73TABLE 52. Computer Use at Work.......................................................................73TABLE 53. Popular Uses of the Computer among Receivers ...........................74TABLE 54. Popular Uses of the Computer for Academic/Training Purposes 74TABLE 55. Internet Use among Receivers ...........................................................75TABLE 56. Internet Connection at Home ............................................................75TABLE 57. Type of Connection at Home.............................................................76TABLE 58. Preferred Channels of Communication............................................76TABLE 59. Preferred Mode/Media for Learning ................................................76TABLE 60. Preference for Single Point of Access for Local E-<strong>learning</strong> Content...............................................................................................................77TABLE 61. Predicted Use of E-<strong>learning</strong> ...............................................................77TABLE 62. Receivers’ Perceptions of Learner Readiness ..................................79TABLE 63. Receivers’ Perception of Content Readiness....................................80TABLE 64. Receivers’ Perceptions of Technical Readiness ...............................81TABLE 65. Receivers’ Perceptions of Environment Readiness.........................82TABLE 66. Receivers’ Perceptions of Cultural Readiness .................................84TABLE 67. Receivers’ Perceptions of Financial Readiness ................................84TABLE 68. Mean Score of Overall Readiness among Receiver.........................85TABLE 69. Level of Overall Readiness among Receivers..................................86TABLE 70. Overall Means for E-<strong>learning</strong> Readiness among Policy Makers,Providers, Enablers and Receivers ...................................................92TABLE 71. Areas of Readiness among Respondents by Rank..........................94TABLE 72. Summary of Findings .........................................................................97Joint Study by MEWC and OUMvi
E-<strong>learning</strong> Readiness in <strong>Malaysia</strong> 2004LIST OF FIGURESPageFIGURE 1. Level of Overall Readiness among Policy Makers........................24FIGURE 2. Overall Management Readiness for Policy Makers......................25FIGURE 3. Overall Personnel Readiness for Policy Makers............................25FIGURE 4. Overall Technical Readiness for Policy Makers ............................26FIGURE 5. Overall Environmental Readiness for Policy Makers...................26FIGURE 6. Overall Cultural Readiness for Policy Makers ..............................27FIGURE 7. Overall Financial Readiness for Policy Makers.............................27FIGURE 8. Level of Overall Readiness among Provivers................................45FIGURE 9. Overall Personnel Readiness for Providers ...................................46FIGURE 10. Overall Content Readiness for Providers.......................................46FIGURE 11. Overall Technical Readiness for Providers....................................47FIGURE 12. Overall Environmental Readiness for Providers ..........................47FIGURE 13. Overall Financial Readiness for Providers.....................................48FIGURE 14. Level of Overall Readiness among Enablers .................................64FIGURE 15. Overall Learner Readiness for Enablers.........................................65FIGURE 16. Overall Management Readiness For Enablers...............................65FIGURE 17. Overall Personnel Readiness for Enablers .....................................66FIGURE 18. Overall Content Readiness for Enablers.........................................66FIGURE 19. Overall Technical Readiness for Enablers......................................67FIGURE 20. Overall Environmental Readiness for Enablers ............................67FIGURE 21. Overall Cultural Readiness for Enablers........................................68FIGURE 22. Overall Financial Readiness for Enablers.......................................68FIGURE 23. Level of Overall Readiness among Receivers................................87FIGURE 24. Overall Learner Readiness for Receivers .......................................88FIGURE 25. Overall Content Readiness for Receivers.......................................88FIGURE 26. Overall Technical Readiness for Receivers ....................................89FIGURE 27. Overall Environment Readiness for Receivers..............................89FIGURE 28. Overall Cultural Readiness for Receivers ......................................90FIGURE 29. Overall Financial Readiness for Receivers .....................................90FIGURE 30. Level of Overall Means for E-<strong>learning</strong> Readiness among PolicyMakers, Providers, Enablers and Receivers...................................93Joint Study by MEWC and OUMvii
E-<strong>learning</strong> Readiness in <strong>Malaysia</strong> 2004LIST OF APPENDIXESPageAppendix A. National Consultative Committee on E-<strong>learning</strong>.....................111Appendix B. OUM Committee on E-<strong>learning</strong> Readiness in <strong>Malaysia</strong>..........113Appendix C. Working Group (Phase I)..............................................................115Appendix D. Working Group (Phase III)...........................................................119Appendix E. List of Major Respondents ...........................................................122Appendix F. Survey Instrument for Policy Makers.........................................125Appendix G. Survey Instrument for Providers.................................................129Appendix H. Survey Instrument for Enablers ..................................................134Appendix I. Survey Instrument for Receivers.................................................140Appendix J. Biodata of the Working Group Members ..................................148Joint Study by MEWC and OUMviii
1INTRODUCTION1.1 The StudyThis report presents the findings of a nation-wide study on E-<strong>learning</strong><strong>readiness</strong> (ELR) among <strong>Malaysia</strong>ns. There were four target groups ofrespondents: policy-makers, providers, enablers and receivers (seeSection 1.4.1). The primary aim of the investigation was to assess thecurrent state of E-<strong>learning</strong> <strong>readiness</strong> in the country. The respondents ofthe study were policy-makers, enablers and receivers in higher education,participants of in-service training in government agencies as well asamong E-<strong>learning</strong> providers in the education as well as corporate sector.It is expected that the study will help address issues pertaining to thedigital divide and facilitate the implementation of programmes based onnational goals. The study also provides the government, through theNational Consultative Committee on E-Learning (Appendix A), a baselineset of recommendations aimed at elevating the current level of ELR in<strong>Malaysia</strong>. Four instruments were developed for the study and these wereadministered online via the Internet as well as face-to-face using printedcopies.As nations place greater emphasis on the global impact of e-education,most countries focus on cost effective solutions that may be implementedquickly. Needless to say, such programmes are facilitated by theavailability of and access to ICT applications. It is therefore important tocalibrate the ELR level of <strong>Malaysia</strong>n ICT users so that, where the need be,human capacity development programmes may be implemented. In timeto come, ICT education, knowledge and application will be moremeaningful to <strong>Malaysia</strong>ns, and there will be a greater chance of producingquality local content.The impact of E-<strong>learning</strong> has been felt in both education and industry,particularly in more developed countries. In recent years, ICTdevelopment has spurred the growth of the Internet and networkedtechnologies, influencing lifestyles, businesses, training and workprocesses. In <strong>Malaysia</strong>, a great deal of emphasis has been placed on theJoint Study by MEWC and OUM 1
application of ICT to pave the way for the country to move into the digitalage. The MSC (Multimedia Super Corridor) launched in 1996 is testimonyto the government’s national ICT agenda. Thus, this study on ELR isimportant as it will help formulate new policies or develop initiatives toelevate the nation’s <strong>readiness</strong> for E-<strong>learning</strong>.The integration of ICT in educational institutions has also encouraged theuse of ICT to respond to individuals’ <strong>learning</strong> and training needs. In thecase of distance education or open and distance <strong>learning</strong> institutions, ICThas been used to deliver either parts of the curriculum or the totalcurriculum. In addition, ICT plays an important role in informal <strong>learning</strong>and provides a channel for harnessing the usefulness of informal contentknowledge. The use of ICT in this manner has generally been referred toas e-Learning.E-<strong>learning</strong> has been defined in many ways, but it generally refers to<strong>learning</strong> that depends on or is enhanced by electronic or onlinecommunication using the latest information and communicationtechnologies (Nagy, 2004). As defined by the Development Gateway, E-<strong>learning</strong> is “the application of information and communicationtechnologies (ICT) in support of distance <strong>learning</strong>, self-guided <strong>learning</strong>,and the traditional classroom” (Development Gateway, 2003).For this study, the proposed working definition for E-<strong>learning</strong> by the E-<strong>learning</strong> Readiness Working Group is the use of network and multimediatechnologies to improve the quality of <strong>learning</strong> by enabling access toknowledge and remote resources for the development of a K-society.Across the globe, E-<strong>learning</strong> is growing at a phenomenal rate. It has had atremendous impact on education at all levels of society and is a significantfeature in knowledge-based economies. The use of ICT is increasinglybeing recognized as a building block of development in the knowledgeeconomy. In many ways, expansion in E-<strong>learning</strong> is precipitated bysound ICT policy and programming. In the <strong>Malaysia</strong>n scenario, E-<strong>learning</strong> is not only a growing industry but is, potentially, an importantvehicle for the provision of education, knowledge and information to thepublic. Further, E-<strong>learning</strong> has been used to support formal <strong>learning</strong>,non-formal <strong>learning</strong> and informal <strong>learning</strong>. It has been noted that E-<strong>learning</strong> has succeeded when it is well-planned and implemented.Two of the country’s universities, Unitar (http://www.unitar.edu.my/)and <strong>Open</strong> <strong>University</strong> <strong>Malaysia</strong> (OUM) (http://www.oum.edu.my/) arecurrently offering their academic programmes via the hybrid and blended<strong>learning</strong> modes, respectively. Each incorporates the use of E-<strong>learning</strong> forteaching and <strong>learning</strong>. Combined, these two universities currently servealmost 33,000 students, 75 percent of whom are registered at OUM. Inaddition, a growing number of public and private universities throughoutthe nation are employing E-<strong>learning</strong> methodologies either to offeracademic programmes via distance <strong>learning</strong>, or to support their full-timeon-campus learners.Joint Study by MEWC and OUM 2
Meanwhile, the Internet has been employed to successfully impart newknowledge and information (informal <strong>learning</strong>) via community-basedprojects. As of December 2003, there were 73 projects under theDemonstrator Applications Grant Scheme (DAGS) in <strong>Malaysia</strong>. Examplesare e-Bario (http://www.unimas.my/ebario/), Nutriweb(http://nutriweb.org.my/), e-Pekak (http://www.epekak.net.my), The<strong>Malaysia</strong>n Monarchy (http://www.malaysianmonarchy.org.my/),Reproductive Health of Adolescents (http://www.e-rham.com/), ARBECBiodiversity (http://www.arbec.com.my/), Cybercare(http://www.cybercare.org.my) and Agritani(http://www.taninet.com.my).Other more recent developments include the preparation andimplementation of an ICT roadmap. The roadmap is expected to be readyin 2005 and will be tabled at the meeting of the National InformationTechnology Council (NITC), chaired by Prime Minister Datuk SeriAbdullah Ahmad Badawi. Key to the implementation of the roadmap isthe inclusion of all communities, thus minimizing their chances of beingmarginalized in the digital age (Kasim, 2004).The much-anticipated National Broadband Plan is also expected to kickoff in late 2004. The plan was initiated by the Energy, Water andCommunications Ministry and it aims to achieve a critical mass of 1.2million broadband subscribers through national projects such asSchoolNet, eGovernment, <strong>Malaysia</strong> Research and Education Network(MyREN) and telemedicine. The SchoolNet project will provide a highspeed,always-on networking infrastructure to enable students andteachers to conduct online collaboration, prepare teaching materials andshare documents. The project will link about 10,000 schools by the firstquarter of 2005. Minister Datuk Sri Dr. Lim Keng Yaik was reported tohave said that broadband penetration should be at 50 percent of thepopulation if <strong>Malaysia</strong> is to be a developed country by 2020. Thegovernment’s immediate target is to increase the country’s broadbandpenetration rate from two percent of the population to five percent in 2006and 10 percent in 2008, that is, when industry players are expected to rollout infrastructure at the last mile (Sani, 2004).According to a report by Foo (2004) more will be invested in setting upRural Internet Centres (RICs) throughout the nation as a result of anotherbridging effort by the <strong>Malaysia</strong> govenment. It is expected that thenumber of RICs will grow from the existing 42 centres to over 200 by 2008.The secretary general to Energy, Water and Communications Ministry,Datuk Halim Shafie reported that the RIC project has trained more than45,000 rural folks (farmers, housewives and students) in the year of itsinception.The above are some of the key projects and plans by the Government.Among institutions of higher <strong>learning</strong>, various efforts and initiativesinclude providing not just physically wired networks but wirelessnetworks, in the hope that students will benefit from course materialsmade available online. In some institutions such as Unimas and HELPJoint Study by MEWC and OUM 3
<strong>University</strong> College, lecturers are encouraged to set up online forums forgroup discussions as part of the teaching-<strong>learning</strong> experience. Hence, E-<strong>learning</strong> is currently believed to be a potentially significant area ofdevelopment in <strong>Malaysia</strong>. This study on E-<strong>learning</strong> <strong>readiness</strong> is thereforetimely and will shed light on the current state of E-<strong>learning</strong>, E-<strong>readiness</strong>and E-<strong>learning</strong> <strong>readiness</strong> in <strong>Malaysia</strong>.1.2 Literature ReviewWith respect to E-<strong>learning</strong> <strong>readiness</strong> in the <strong>Malaysia</strong>n context, thefollowing reports represent some of the seminal works on E-<strong>learning</strong>, E-<strong>learning</strong> <strong>readiness</strong> and E-<strong>readiness</strong> in the <strong>Malaysia</strong>n context:1. Report of the National Information Technology Council (NITC)Working Group on Electronic Learning, May 1999 (UNIMAS,1999).2. E-ASEAN Readiness Assessment by ASEAN and IBM GlobalServices, October 2001.3. National ICT Approaches: Selected Case Studies (<strong>Malaysia</strong>) byAccenture, the Markle Foundation and UNDP. www.optinit.org/framework/pages/2.3.html4. Report on 2004 E-<strong>readiness</strong> Ranking- A white paper from theEconomist Intelligence Unit, written in cooperation with IBMCorporation.5. Report of the <strong>Asia</strong> Cooperation Dialogue on E-<strong>learning</strong> by <strong>Open</strong><strong>University</strong> <strong>Malaysia</strong> (2004).The above-mentioned reports have outlined several predictors of acountry’s E-<strong>learning</strong> <strong>readiness</strong>. Some of these are per capita income,telecommunication networks, urbanization, pro-competitive macropolicies and an emphasis on privatization. Research has also utilized acontinuum-based approach to calibrating E-<strong>learning</strong> <strong>readiness</strong> for thepurpose of cross-nation comparison and inter-oranizationalbenchmarking. For example, a report by ASEAN (ASEANSecretariat/IBM, 2001) has indicated that ELR may be determined along afour point scale containing descriptors such as emerging, evolving,embedding and extending to describe the extent of <strong>readiness</strong> or acountry’s level of E-<strong>learning</strong> programme implementation.A significant finding of the review of this literature is that there appears tobe affirmation of a high amount of e-<strong>readiness</strong> among <strong>Malaysia</strong>ns, a pointthat puts us in good standing internationally. In an E-ASEAN ReadinessAssessment Report (ASEAN Secretariat/ IBM, 2001) it was found that<strong>Malaysia</strong> ranked second on all assessment measures pertaining toinfrastructure, E-society, E-commerce and E-Government. In terms of E-<strong>readiness</strong> rankings among countries of the <strong>Asia</strong>-<strong>Pacific</strong> region, <strong>Malaysia</strong>Joint Study by MEWC and OUM 4
has been ranked 8 in the years 2003 and 2004 (Economist Intelligence Unit,2004). Among 64 countries from all over the world, <strong>Malaysia</strong> was ranked33 in 2003 and 2004 for e-<strong>readiness</strong>. The study also found that <strong>Malaysia</strong>has been able to transform its technology manufacturing industry into oneof IT and Internet-friendly support service.However, in the recent Global Competitiveness Report 2004 by the WorldEconomic Forum, <strong>Malaysia</strong> was ranked 27 th in the technology index,down from 20 th in 2003. Minister Datuk Dr. Jamaludin Jarjis’ response tothis was that his ministry has embarked on or will undertake a series ofprogrammes to boost <strong>Malaysia</strong>’s ranking (Chow, 2004). One example isthe plan to increase the broadband penetration rate through the NationalBroadband Plan.Other studies have also found positive indicators of <strong>Malaysia</strong>’s E-<strong>learning</strong><strong>readiness</strong>. In one case study (http://www.optinit.org, 2004), it is reportedthat <strong>Malaysia</strong>’s “Vision 2020” programmes include development of theICT sector to improve its competitiveness at a global level. Some of theinitiatives cited for improving ELR are increasing ICT literacy, developingportals for cooperation among work communities and e-commerceinitiatives.Past research has also provided an understanding of a number ofconstructs that may be used to calibrate the E-<strong>learning</strong> <strong>readiness</strong> of apeople or a region. For example, a report on E-<strong>learning</strong> <strong>readiness</strong> inASEAN countries, examined ELR using constructs such as infrastructure,political will, integration of business requirements into a country’spolicies, legislation and regulation with regards to E-<strong>learning</strong>, as well asinnovations that improve productivity and standard of living. Onanother front, the Economic Intelligent Unit used E- <strong>readiness</strong> criteria thatassessed six categories: technology infrastructure, their general businessenvironment, the degree to which E-business is being adopted byconsumers and companies, social and cultural conditions that influenceInternet usage, and the availability of services to support E-businesses. Incomparison to the above list of ELR criteria, a study by McConnellInternational (2000), examined E-<strong>readiness</strong> using the following:connectivity, E-leadership, informal security, human capital, and the E-business climate.Although operational definitions and assessment criteria for <strong>readiness</strong> arevaried, it may be concluded that most measures of E-<strong>learning</strong> <strong>readiness</strong>examine the following dimensions: the learner, the management, thepersonnel, the culture, the provision of relevant content, as well astechnical, financial, and environmental resources.In addition to measures of E-<strong>learning</strong> <strong>readiness</strong> is the issue ofimplementing sustainable and far-reaching imperatives for creating an E-savvy citizenry. In 1999, the National Information Technology Council(NITC) recommended three broad imperatives for the implementation ofinnovative and indigenous E-<strong>learning</strong> imperatives. These were:Joint Study by MEWC and OUM 5
1. The promotion of information fluency toward the right ofaccess to E- <strong>learning</strong> for all <strong>Malaysia</strong>ns (p.27).2. The creation of windows of opportunity to develop newmodes of <strong>learning</strong> and innovative <strong>learning</strong> strategies based onthe new information and communication technologies (p.29).3. The development of indigenous content so that E-<strong>learning</strong>shall be imbued by <strong>Malaysia</strong>n values, as it further infusesthem into <strong>Malaysia</strong>n Society. E- Learning will be driven byindigenous technology derived from national R&D (p.30).The systematic implementation of the above imperatives is deemedcrucial as there appears to be a short supply of <strong>Malaysia</strong>n professionalswith ICT skills (http://www.opt-init.org/framework/pages/2.3.html).Further, there is a need to cultivate and train more specialists in E-<strong>learning</strong>, particularly instructional designers and E-<strong>learning</strong> contentproviders. Further, there is a need to develop more adequateinfrastructure and to ensure the availability of broadband access to awider spectrum of the society. Bearing this in view, this study on E-<strong>learning</strong> <strong>readiness</strong> in <strong>Malaysia</strong> has been carried out to provide input on<strong>Malaysia</strong>n <strong>readiness</strong> in a number of pertinent areas.1.3 Research QuestionsThe study focused on four groups of individuals: policy makers,providers, enablers and receivers of E-<strong>learning</strong> who were directly orindirectly involved in E-<strong>learning</strong> at the tertiary level of education as wellas in training at the workplace. In particular, the study aimed to answerthe following questions:1. To what extent are policy makers enabling or ready toenable E-<strong>learning</strong> programmes within their respectiveorganisations?2. To what extent are providers (private corporations,organisations, tertiary educational institutions and majortechnology providers) ready to embark or have embarkedon E-Learning programmes?3. To what extent are enablers (tutors, lecturers and trainers)ready to deliver E-<strong>learning</strong> programmes?4. To what extent are receivers (learners and trainees) readyfor E-Learning?The section below describes the methodology used in the study.Operational definitions of terms associated with the study are alsoincluded.Joint Study by MEWC and OUM 6
1.4 MethodologyPrior to the appointment of the Lead Researcher for the study, in-housediscussions by members of the management team at <strong>Open</strong> <strong>University</strong><strong>Malaysia</strong> (see Appendix B) were held to conceptualize the study, discussthe research framework and develop the terms of reference for the study.A Lead Researcher was later appointed and provided the minutes of thein-house meetings and based on these, prepared the Concept Paper. Thelatter was sent to the Ministry of Energy, Water and Communication(MEWC) in early February 2004. The first meeting to discuss the ConceptPaper was held on February 9, 2004 with appointed members of theWorking Group (Phase I, see Appendix C). The Concept Paper hadoutlined that the Working Group members will contribute from the pointof fine-tuning of research objectives to the analysis of findings. This washowever, not feasible as not all Working Group members were able orcould contribute their time to the various phases of the study. A WorkingGroup for Phase III (see Appendix D) of the study was formed comprisingof some members from Phase I together newly incorporated academiciansand researchers.Members of the Working Group were selected from amongst variousorganisations such as universities, research organisations and trainingcorporations. They assisted with the following tasks:1. Providing input on research design and methodology2. Identifying the target population3. Developing the instrument4. Eliciting responses from the target group5. Reporting findings of the study6. Writing the final report7. Recommending future measures based on eight areasrelated to capacity building:a. Human Resource Developmentb. Research and Developmentc. Infrastructured. Infostructuree. Institutional Frameworkf. Policy Initiativesg. BenchmarkingThe study employed a survey methodology using four instruments, onefor each of the identified target groups, namely:1. Policy makers2. Providers3. Enablers4. ReceiversJoint Study by MEWC and OUM 7
1.4.1 The ELR InstrumentFour instruments were developed for the study by members of the WGduring Phase I. A customized instrument was developed for each targetgroup with each instrument comprising of two sections (Section A & B).Section A contains items related to demographic variables and section Bcontains items asking for perceptions of <strong>readiness</strong> in eight areas vialearner, management, personnel, content, technical, environmental,cultural and financial. The means of the <strong>readiness</strong> scores in the eightareas will be tabulated as in Table 1:1. Learner <strong>readiness</strong>2. Management <strong>readiness</strong>3. Content <strong>readiness</strong>4. Personnel <strong>readiness</strong>5. Technical <strong>readiness</strong>6. Financial <strong>readiness</strong>7. Environmental <strong>readiness</strong>8. Cultural <strong>readiness</strong>.The instruments for providers, policy-makers and enablers were preparedin the English language (see Appendices F, G and H). The E-<strong>learning</strong><strong>readiness</strong> instrument for receivers (see Appendix I) was presented inbilingual form (English Language and Bahasa Melayu).TABLE 1. Areas of Readiness Measured forGroups of RespondentsAreas of Readiness Policy Maker Provider Enabler ReceiverLearner Management Personnel Content Technical Environmental Cultural Financial 1.4.2 Phases of the StudyThe study was carried out in three phases. The activities in each of thethree phases of the study are described below:Phase I (January – April 2004)• Preparation of Concept Paper (January 2004)Joint Study by MEWC and OUM 8
• Submission of Concept Paper to Ministry of Energy,Water and Communications (early February 2004)• First Working Group Meeting (9 February 2004)• Second Working Group Meeting (26 February 2004)• Third Working Group Meeting (3 March 2004)• Fourth Working Group Meeting (8 March 2004)• Fifth WG Meeting (24 March 2004)• Development of E-<strong>learning</strong> Research Tools• Pilot Testing (February-April 2004)Phase I involved the preparation of the concept paper outlining thenecessary research activities and methodology. The research design,methodology and development of the instruments of the study were thenrefined and respondents were identified.The four E-<strong>learning</strong> Readiness Research tools for the target group ofrespondents, respectively, were developed, piloted and modified beforethey were finalized. Members of the Working Group (Phase I) met anddiscussed the E-<strong>learning</strong> Readiness Research tool, with most face-to-facemeetings held at the OUM main campus.Both the printed and on-line versions of the tools were pilot-tested withten individuals from each of the four groups of target respondents.Phase II (May-August 2004)• Data Collection• Data Analysis• Tabulation/Graphing/Charting of FindingsThe data were collected via the four E-<strong>learning</strong> <strong>readiness</strong> tools. Thesefour tools were made available online through the OUM Website athttp://www.oum.edu.my/ between May and August 2004 and in printedform. For the latter, organisations representative of the four target groupsthroughout the country were approached for their participation in thestudy.In addition, ongoing reports of the research were published in thenewspapers and the OUM Web site. The electronic version of theinstruments was available for a period of five months, and responses weresought among all members of the academic community and among thecorporate workforce. In addition, 9,950 printed questionnaires weredistributed and administrated face-to-face by several members of theWorking Group and colleagues identified as key contacts in highereducation and training institutions. The privacy of the respondents wasmaintained.Joint Study by MEWC and OUM 9
1.4.3 The RespondentsThe respondents for the study comprised the following:• 102 policy makers in leadership positions (top and middlemanagement) in both private and governmentorganisations• 75 providers from organisations involved in education,training, R&D, ICT and others• 977 enablers who are primarily part of the faculty inprivate and government higher educational institutions,participants attending in-service training programmesand DAGS (Demonstrator Applications Grant Scheme)recipients.• 4,625 learners and trainees from private and governmenthigher education institutions and participants attendingin-service training programmes.A list of the major education institutions that participated in the researchis in Appendix D. Major institutions are defined as institutions with atleast 50 respondents in the receiver category.1.4.4 Data Collection and AnalysisThe data for the study were collected between April and August 2004. Allfour instruments were administered nationwide simultaneously. Inseeking respondents online, several batches of e-mail were sent out toidentify respondents for higher educational institutions, MSC companies,and government agencies. E-mails were sent out to about 3,500 targetrespondents. A first reminder was e-mailed a week after the first e-mailwas sent followed by a second reminder e-mailed ten days after the firstreminder. In addition, a link to the survey was made available on thehomepage of the OUM portal. Further, the study was publicised in theNew Straits Times to invite respondents to the online survey. Targetrespondents were invited to respond online through e-discussion groups,email and during classes or training sessions held in computer labs.Altogether, these efforts brought in 836 completed online forms in all fourcategories.A total of about 9,950 printed copies of the four ELR instruments weredistributed to the four target groups of respondents in as manyeducational institutions, agencies and individuals as possible. A total of5,779 forms for all target groups of respondents were received by August2004. The data were treated to descriptive and inferential analysis. It wasat this time that Phase III of the study commenced.Phase III (August-November 2004)• Workshop to report the findings and makerecommendations (26 – 30 August 2004)Joint Study by MEWC and OUM 10
• Sixth WG meeting to discuss policy implications(9 September 2004)• Preparation for the submission of the final report on theMEWC-OUM E-<strong>learning</strong> Readiness Study to MEWC(September-November 2004)Several members of the WG from Phase I were invited to view thefindings, provide recommendations and suggest policy initiatives duringa three and a half day workshop between 26 th and 30 th August 2004. Therecommendations by the Working Group were incorporated into the finalreport submitted to MEWC.The findings and recommendations of the study were presented tomembers of the National Consultative Committee on E-<strong>learning</strong> (seeAppendix A).1.4.5 Operational DefinitionsThe definitions of the terms used to describe the (a) target respondentsand (b) the areas of <strong>readiness</strong> surveyed are given below. It is to be notedthat the definition of E-Learning had been operationalised by the WorkingGroup as follows: as the use of network and multimedia technologies toimprove the quality of <strong>learning</strong> by enabling access to knowledge andremote resources for the development of a K-society.(a) Target RespondentsEnablerAn individual who enables/facilitates the delivery and implementation ofE-<strong>learning</strong> programmes e.g. lecturers, tutors, facilitators in public andprivate higher education institutions (IPTA/IPTS).Policy MakerAn individual in higher management in charge of formulating orimplementing policies related to training and instruction e.g. CEO,President, Executive Director, Managing Director, General Manager of acompany; Vice Chancellor, Deputy Vice Chancellor, Director, Head of adepartment or educational institution at the tertiary level.ProviderAn individual or an organisation that provides or sells E-<strong>learning</strong> contentand/or technology services to target institutions/learners.ReceiverAn individual who is a learner/trainee enrolled in an educational/traininginstitution for tertiary education or attending an in-service course.Joint Study by MEWC and OUM 11
(b) Area of Readiness:Content ReadinessThis refers to the variety and availability of appropriate E-<strong>learning</strong>materials. Basically it is how ready the institution/organisation is in termsof providing content for E-<strong>learning</strong> as perceived by the providers,enablers and learners/trainees.Cultural ReadinessThe enculturation of E-<strong>learning</strong> in terms of Internet use and networkedtechnologies to disseminate information, communication, interaction andteaching. Basically it is how the institution/organisation is ready toenculturate E-<strong>learning</strong> as a mode for teaching and <strong>learning</strong> as perceivedby the policy makers, enablers and learners/trainees.Environmental ReadinessThis refers to the <strong>readiness</strong> of the country as a whole in terms of thepresence of government policy, the role of mass media, intellectualproperty regulations and proficiency in the English language. It refers toa <strong>readiness</strong> of a society/nation for E-<strong>learning</strong> as perceived by the policymakers, providers, enablers and learners/trainees.Financial ReadinessThis refers to learner/trainee and institutional/organisational <strong>readiness</strong> tospend or allocate funds to develop and/or acquire E-<strong>learning</strong>. It generallyrefers to whether a learner/trainee or institution/organisation is finaciallyready for E-<strong>learning</strong> programmes as perceived by policy makers, enablers,and learners/trainees.Learner ReadinessThis refers to the <strong>readiness</strong> of the learner or trainee in terms of timecommitment to E-<strong>learning</strong>, discipline and interest in E-<strong>learning</strong> as well asperception of the status of qualifications obtained via E-<strong>learning</strong>.Management ReadinessThis refers to the institution/organisation having a vision/mission orformulated policies related to the provision of E-<strong>learning</strong> and theinstitutional/organisational recognition of qualifications obtained via E-<strong>learning</strong>.Joint Study by MEWC and OUM 12
Personnel ReadinessThis refers to the <strong>readiness</strong> of the institution/organisation in terms ofhaving a central unit dedicated to E-<strong>learning</strong> initiatives with a team ofdedicated instructional designers as well as staff development plan for E-<strong>learning</strong>.Technical ReadinessThis refers to the institution/organisation providing the necessaryinfrastructure for E-<strong>learning</strong> in terms of technical help, E-<strong>learning</strong> contentdelivery, broadband facilities as well as a Learning Management System(LMS).1.5 Organisation of the ReportThis report comprises six chapters. This chapter provides an overview ofthe national study on E-<strong>learning</strong> Readiness in <strong>Malaysia</strong>. Chapters 2through 5 present the findings of the respective target groups: Policymakersand Organisations, Providers, Enablers and Receivers. Each set offindings is followed by a summary and a set of recommendations basedon the findings. Finally, Chapter 6 summarizes the research findings andlists the recommendations for capacity building that the government, itsagencies and related organisations could consider for the future of E-<strong>learning</strong> in <strong>Malaysia</strong>.Joint Study by MEWC and OUM 13
2POLICY MAKERS ANDORGANISATIONSThis chapter presents the findings on the extent to which policy makersare enabling or are ready to enable E-<strong>learning</strong> within their organisation.2.1 Demographic ProfileAs shown in Table 2, this study surveyed a total of 102 policy makersconsisting of 30 (21.4 percent) top-level executives (CEOs, Presidents, ViceChancellors, Vice Presidents, Deputy Vice Chancellors, ExecutiveDirectors, Managing Directors and General Managers) and 47 (46.1percent) middle-level management personnel (Directors, Deans,Managers and Heads). The remaining 25 (24.5 percent) were in otherleadership positions.Of the 102 organisations that participated in the study, 43 (41.7 percent)were located in cities and 59 (57.3 percent) in areas outside the city. Therewere more private than government organisations (55.3 percent and 43.7percent respectively). The majority of the organisations (64 or 62.7percent) were involved in education, training and research anddevelopment, while 20 (19.6 percent) were ICT-based organisations.Other organisations (18 of them) made up the remaining 17.7 percent ofthe sample.The number of employees in the organisations surveyed ranged from lessthan 100 to more than 10,000 per organisation. The majority (68.6 percent)of the organisations had less than 500 employees while 25.5 percent hadbetween 500 and 10,000 employees. Only six organisations (5.9 percent)had more than 10,000 employees each.Sixty-nine organisations indicated that they had a student enrolment. Ofthe 69, about one third (36.2 percent) had a student enrolment of less than1,000. Another 33.4 percent had an enrolment between 1,000 and 5,000students, while 28.9 percent had between 5,001 to 25,000 students. Onlyone organisation reported a student enrolment of above 25,000 in itsinstitution.Joint Study by MEWC and OUM 14
In terms of Internet connectivity, 71 (69.2 percent) of the organisationshave broadband facilities (e.g. Streamyx and leased line), while only 6.9percent still use dial-up facilities. A total of 20 (19.6 percent)organisations, probably those requiring bandwidth capable of handling amassive amount of data, depend on ISDN or other lines. These findingsindicate that the majority of organisations already do or are possiblyready to subscribe to higher bandwidths.TABLE 2. Demographic Profile of Policy MakersDescription of RespondentFrequency(N = 102)Percentage(%)Position in the OrganisationCEO/President/Vice Chancellor/ VicePresident/Deputy Vice ChancellorExecutive Director, Managing Director,General Manager21 20.69 8.8Director/Dean, 32 31.4Manager/Head 15 14.7Other 25 24.5Location of OrganisationTotal 102 100Town 59 57.3City 43 41.7Type of OrganisationTotal 102 100Government 45 43.7Private 57 55.3Nature of OrganisationTotal 102 100Education/Training/R&D 64 62.7ICT 20 19.6Others 18 17.7Number of Employees (full time, parttime, contract)Total 102 100Under 100 51 50.0Joint Study by MEWC and OUM 15
TABLE 2. Demographic Profile of Policy Makers (continued)Description of RespondentFrequency(N = 102)Percentage(%)101-500 19 18.6501 to 2,500 15 14.72,501 to 10,000 11 10.8More than 10,001 6 5.9Number of Students Enrolled (forinstitutions with student enrolmentonly)Total 102 100Under 1000 25 36.21,001 to 2,500 12 17.42,501 to 5,000 11 16.05,001 to 10,000 5 7.210,001 to 25,000 15 21.7Above 25,000 1 1.5Connection to the InternetTotal 69 100Dial up 7 6.9Streamyx 40 38.8ISDN 15 14.7Leased Line 31 30.4Other 5 4.9Missing value 4 3.9Total 102 1002.2 Patterns of ReadinessSix dimensions of <strong>readiness</strong> were considered in the survey of policymakers:management, personnel, technical, environmental, cultural andfinancial <strong>readiness</strong>. The data in Tables 3 to 11 indicate the extent towhich policy makers feel their organisations are ready for E-<strong>learning</strong>.Table 3 indicates that about two-thirds of the management inorganisations are committed to E-<strong>learning</strong>. The figures in Table 3 showthat the majority of the organisations (72.5 percent) already have missionstatements on E-<strong>learning</strong> as opposed to 25.5 percent who do not. Almosttwo-thirds (60.8 percent) of the organisations have E-<strong>learning</strong> policies inplace, compared to 37.2 percent that have not formulated such policies. InJoint Study by MEWC and OUM 16
addition, almost two-thirds of the organisations also claimed to recognisequalifications obtained via E-<strong>learning</strong>.TABLE 3. Policy Makers’ Perceptions of Management ReadinessDescriptionYesn(%)Non(%)Institution has avision/mission on E-<strong>learning</strong>74(72.5)26(25.5)Missingvaluen(%)2(2.0)TotalN(%)102(100)Institution has formulatedpolicies62(60.8)38(37.2)2(2.0)102(100)Institution recognisesqualifications obtained viaE-<strong>learning</strong>65(63.7)31(30.4)6(5.9)102(100)Although most of the policy makers feel that their organisations are readyat the management level, they were generally less optimistic about the<strong>readiness</strong> of their personnel (see Table 4). Table 4 shows that almost 60percent of the organisations already have teams set up to implement E-<strong>learning</strong>, as opposed to 39.2 percent who do not. However, not all thoseteams appear to be supported by expertise in instructional design, as lessthan half (46.1 percent) of the institutions claimed to have teams ofdedicated instructional designers. Only about half (55.3 percent) theinstitutions have central units specifically for developing E-<strong>learning</strong>initiatives; 41.7 percent have no such units. A similar division can beobserved between organisations with staff development plans for E-<strong>learning</strong> in place (56.9 percent) versus those without plans (41.2 percent)for E-<strong>learning</strong>. Concern over the lack of support for personnel issubstantiated by qualitative data in the form of policy makers’ responsesto the open-ended questionnaire items, in which they noted theunavailability of a central, focused source of support and the need forsomeone to spearhead and direct E-<strong>learning</strong> efforts at the organisationallevel.In terms of technical <strong>readiness</strong>, the data in Table 5 show that a largenumber of institutions are already using Intranet (85.3 percent) andInternet (91.2 percent) to run their daily operations. These institutions(77.5 percent) have also invested in broadband facilities. However, only37.3 percent use a Learning Management System (LMS) to deliver E-<strong>learning</strong> programmes.The data in Table 6 indicate the extent of environmental <strong>readiness</strong> for E-<strong>learning</strong>. According to two-thirds of the policy makers, governmentpolicies and mass media play a role in stimulating their interest inexploring E-<strong>learning</strong>. The majority (85.3 percent) of policy makersJoint Study by MEWC and OUM 17
surveyed (including one policy maker who specified this his response tothe open-ended questions in the survey, felt that it is important to have acentral agency which plays an active role in regulating competencydevelopment, research, intelligence gathering and E-<strong>learning</strong> initiatives inthe country. However, in terms of question on policy makers’ <strong>readiness</strong>to develop E-<strong>learning</strong> content in their respective institutions that was amixed reaction. This may be due to the absence of legal provisions for theprotection of intellectual property. This concern was echoed in thewritten responses to open-ended questions. Some organisations (43percent) felt that certain government policies hinder the policy makers’plans to invest in E-<strong>learning</strong>. Additionally, over a third of the policymakers (37.3 percent) attributed the lack of environmental <strong>readiness</strong> toinadequate English language proficiency.TABLE 4. Policy Makers’ Perceptions of Personnel ReadinessDescriptionYesn(%)Non(%)Missingvaluen(%)Institution has a central unit 57 43 2dedicated to E-<strong>learning</strong> (55.3) (41.7) (2.0)initiativesTotalN(%)102(100)Institution has a team toimplement E-<strong>learning</strong>60(58.8)40(39.2)2(2.0)102(100)Institution has a team ofdedicated instructionaldesigners47(46.1)54(52.9)1(1.0)102(100)Has a staff developmentplan for E-<strong>learning</strong>58(56.9)42(41.2)2(2.0)102(100)TABLE 5. Policy Makers’ Perceptions of Technical ReadinessDescriptionYesn(%)Non(%)Missingvaluen(%)Institution using intranet 87 14 1technology to runs its daily (85.3) (13.7) (1.0)operationsTotalN(%)102(100)Institution using internettechnology to run its dailyoperations93(91.2)8(7.8)1(1.0)102(100)Institution has broadbandfacilities79(77.5)21(20.6)2(2.0)102(100)Institution has a LearningManagement System (LMS)to deliver E-<strong>learning</strong>38(37.3)62(60.8)2(2.0)102(100)Joint Study by MEWC and OUM 18
TABLE 6. Policy Makers’ Perceptions of Environmental ReadinessDescriptionYesn(%)Non(%)Important to have centralagency play an active role87(85.3)14(13.7)Missingvaluen(%)1(1.0)TotalN(%)102(100)Mass media made myinstitution keen to exploreE-<strong>learning</strong>67(65.7)34(33.3)1(1.0)102(100)Government Policy mademy institution keen toexplore E-<strong>learning</strong>62(60.8)39(38.2)1(1)102(100)Lack of legal provisions onintellectual property52(51.0)49(48.0)1(1.0)102(100)Certain governmentpolicies hindered ourplans to invest44(43.1)56(54.9)2(2.0)102(100)Lack of English languageproficiency38(37.3)62(60.8)2(2.0)102(100)Total 3502548612(57.2)(41.5)(1.3)(100)On the issue of cultural <strong>readiness</strong>, it can be seen from the findingsreported in Table 7 that the majority of the policy makers felt that it islikely for an E-<strong>learning</strong> culture to develop in their organisations. It wasfound that 68.6 percent of the policy makers agreed that E-<strong>learning</strong> shouldultimately be the mode of <strong>learning</strong> in their institution, and the majority(90.2 percent) of them felt that E-<strong>learning</strong> will help their organisation staycompetitive in the K-economy.TABLE 7. Policy Makers’ Perceptions of Cultural ReadinessDescriptionYesn(%)Non(%)Missingvaluen(%)E-<strong>learning</strong> should70 32 0ultimately be the mode of (68.6) (31.4) (0)<strong>learning</strong> in my institutionTotalN(%)102(100)E-<strong>learning</strong> will help myorganisation/institutionremain competitive92(90.2)10(9.8)0(0)102(100)Joint Study by MEWC and OUM 19
According to the data in Table 8 which indicate the extent of financial<strong>readiness</strong> in implementing E-<strong>learning</strong>, almost half of the institutions (48percent) have taken the initiative to provide computer loans which maybe an important factor in motivating employees to engage in E-<strong>learning</strong>.The majority, that is, 68.6 percent of the organisations, provide funds fortraining and conference participation related to E-<strong>learning</strong>. Although E-<strong>learning</strong> content plays a vital role in E-<strong>learning</strong>, only 50 percent of thepolicy makers appear to have allocated a budget for developing E-<strong>learning</strong> content, and even fewer (48 percent) have a budget for acquiringE-<strong>learning</strong> content.TABLE 8. Policy Makers’ Perceptions of Financial ReadinessDescriptionYesn(%)Non(%)Missingvaluen(%)Institution provides a 49 52 1computer loan to the (48.0) (51.0) (1.0)employeesInstitutions provides fundsfor employees to attendconferences and trainingon E-<strong>learning</strong>Institution has allocated abudget to develop E-<strong>learning</strong> contentInstitution has allocated abudget to acquire E-<strong>learning</strong> content70(68.6)51(50.0)49(48.0)31(30.4)50(49.0)52(51.0)1(1.0)1(1.0)1(1.0)TotalN(%)102(100)102(100)102(100)102(100)The survey also identified factors hindering organisations fromexpanding their E-<strong>learning</strong> potential. The data in Table 9 indicate thatalmost half of the policy makers attribute the low rate of expansion tohigh initial investments (47.1 percent) and poor infrastructure (44.1percent) while the rest of the policy makers apparently do not view thesefactors to be hindrances. Although initial investment does not seem to bea major problem, more than half of the organisations find maintenance tobe more difficult, as 57.8 percent of them identify high operating costs as afactor, thus making the heavy investment required in meeting operationalcosts the biggest impeding factor. About the same number of policymakers (56.8 percent) lament a lack of support in developing appropriatepedagogical content. Similar views were noted in the policy makers’responses to the open-ended questionnaire items: they expressed aconcern over the lack of quality-regulated content, training and technicalsupport as well as the absence of clear guidelines and policies. It isencouraging to note that the lack of belief in the necessity for E-<strong>learning</strong> isnot a hindrance, since as many as 80.4 percent of the policy makers do notfind it to be a factor.Joint Study by MEWC and OUM 20
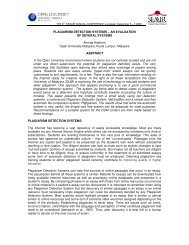
TABLE 9. Factors Hindering Organisations from Expanding E-<strong>learning</strong>EffortsFactorsYesn(%)Non(%)MissingvaluenTotalN(%)(%)High Initial Investments 48(47.1)54(52.9)0(0)102(100)High Operating Costs 59430102(57.8)(42.2)(0)(100)Poor Infrastructure 45570102(44.1)(55.9)(0)(100)Lack of Content 43581102(42.2)(56.8)(1.0)(100)No Necessity for E <strong>learning</strong> 20821102(19.6)(80.4)(1.0)(100)Other 11901102(10.8)(88.2)(1.0)(100)The open-ended responses also revealed an array of other factors thatrespondents felt to be impediments to E-<strong>learning</strong> initiatives. Among thereasons voiced were that E-<strong>learning</strong> is cold and impersonal, and that itshould only be used to complement, not replace, face-to-face classes.Another respondent pointed out that students themselves do not possessthe financial means to purchase computers which would support E-<strong>learning</strong>. Others voiced the need for communities to be more involved,leading to a suggestion by a respondent that broadband access is mademore affordable to home users. There was also a call for greaterrecognition of degrees obtained through E-<strong>learning</strong>.2.3 Overall PerceptionsAn overall picture of the <strong>readiness</strong> of policy makers and organisations isreflected in Tables 10 and 11 and Figures 1 to 7. The <strong>readiness</strong> scaleranges from 1 to 10, where 1 indicates a complete lack of <strong>readiness</strong> and 10indicates total <strong>readiness</strong> (refer Table 10). The findings indicate a largelymoderate degree of organisational <strong>readiness</strong> for all six dimensions (seeFigure 1). The highest rating of a mean of 6.14 was received for technical<strong>readiness</strong> and the lowest rating of 4.76 was attributed to environmental<strong>readiness</strong>. However, a more in-depth analysis of the scenario provided bythe figures in Table 11 indicates that policy makers perceive organisationsto be at a moderate to high level of <strong>readiness</strong> for four dimensions:management, personnel, technical and cultural <strong>readiness</strong>. The reversetrend is seen for environmental and financial <strong>readiness</strong>. The greaterJoint Study by MEWC and OUM 21
difference, however, can be observed in the levels of environmental<strong>readiness</strong>, where 27.5 percent of the organisations indicate a low level of<strong>readiness</strong>, and only 8.7 percent are in the high-level category. This trendwas consistent with the views expressed by policy makers, who, in theirwritten responses, indicate that they are disconcerted by hindrances to theimplementation of E-<strong>learning</strong>. Hindrances were perceived to be in theform of of bureaucratic constraints and the lack of community awarenessabout the benefits of E-<strong>learning</strong>.TABLE 10. Mean Scores of Overall Readiness among Policy MakersArea of ReadinessMean Standard Deviation(N=102)1. Management Readiness 5.98 2.4742. Personnel Readiness 5.87 2.3073. Technical Readiness 6.14 2.3214. Environmental Readiness 4.76 1.9255. Cultural Readiness 6.02 2.1116. Financial Readiness 5.26 2.5522.4 SummaryThe findings indicate that in general, policy makers are financially readyand willing to equip their institutions with the necessary facilities toharness the potential of E-<strong>learning</strong>. They appeared to be most preparedtechnically and felt ready to employ E-<strong>learning</strong> as the mode of <strong>learning</strong>and instruction. Policy makers also feel that they are ready to put in placepolicies and mission statements in support of E-<strong>learning</strong> initiatives.However, at this point in time, these aspirations have not yet beenadequately translated into concrete action or implementation of E-<strong>learning</strong> also initiatives. For example, organisations still need to establisheffective central units for developing high-quality content that wouldmaterialise these aspirations. In addition, there is a lack of qualifiedinstructional designers who can dedicate their time, expertise and effort tohelp develop customised content for the organisation. The biggeststumbling block at the moment seems to be a lack of environmental<strong>readiness</strong> in that the organisations, despite their <strong>readiness</strong> to embark onthe route to E-<strong>learning</strong>, are not being sufficiently supported by sound E-<strong>learning</strong> policies, an effective central E-<strong>learning</strong> agency, and properlyformulated intellectual property regulations appropriate for <strong>Malaysia</strong>.Joint Study by MEWC and OUM 22
TABLE 11. Degree of Overall Readiness among Policy MakersDegree ofOverallReadinessManagementn(%)Personneln(%)Technicaln(%)Environmentaln(%)Culturaln(%)Financialn(%)Low161915281628(1 to 3)(15.8)(18.6)(14.7)(27.5)(15.7)(28.0)Moderate525554655851(4 to 7)(51.5)(53.9)(52.9)(63.7)(56.9)(51.0)High33283392821(8 to 10)(32.7)(27.5)(32.4)(8.7)(27.5)(21.0)N101102102102102100(%)(100.0)(100.0)(100.0)(100.0)(100.0)(100.0)Joint Study by MEWC and OUM 23
Level of Overall Readiness among Policy Makers7063.76051.553.952.956.951.050Percentage403032.727.532.427.527.5 28.02015.818.614.715.721.0108.70Management Personnel Technical Environment Cultural FinancialLevelLow Moderate HighFIGURE 1. Degree of Overall Readiness among Policy MakersJoint Study by MEWC and OUM 24
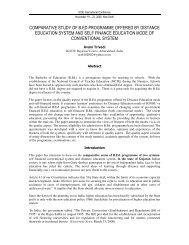
252020.016.8Percent151010.912.98.954.9 4.95.86.96.901 2 3 4 5 6 7 8 9Overall management <strong>readiness</strong>10FIGURE 2. Overall Management Readiness for Policy Makers2016.716.7 16.71513.7Percent107.8 7.86.95.954.92.901 2 3 4 5 6 7 8 9 10Overall personnel <strong>readiness</strong>FIGURE 3. Overall Personnel Readiness for Policy MakersJoint Study by MEWC and OUM 25
2019.616.7Percent1512.813.7106.95.96.97.8 7.852.001 2 3 4 5 6 7 8 9 10Overall technical <strong>readiness</strong>FIGURE 4. Overall Technical Readiness for Policy Makers2018.619.617.71514.7Percent10.8107.85.952.02.001 2 3 4 5 6 7 8 9Overall environment <strong>readiness</strong>1.010FIGURE 5. Overall Environmental Readiness for Policy MakersJoint Study by MEWC and OUM 26
252020.618.6Percent1513.714.711.8107.85.952.0 2.02.901 2 3 4 5 6 7 8 9 10Overall cultural <strong>readiness</strong>FIGURE 6. Overall Cultural Readiness for Policy Makers16.0 16.01512.013.013.010Percent8.0 8.06.054.0 4.001 2 3 4 5 6 7 8 9 10Overall Financial ReadinessFIGURE 7. Overall Financial Readiness for Policy MakersJoint Study by MEWC and OUM 27
3PROVIDERSThis chapter presents the findings on the extent to which providers(private corporations, organisations, tertiary educational institutions andmajor technology providers) are ready to embark or have embarked on E-<strong>learning</strong> programme in institutions of higher education.3.1 Demographic ProfileThere were 75 E-<strong>learning</strong> providers who responded to the survey (seeTable 12). They came from MSC/E-<strong>learning</strong> companies, public institutionsof higher <strong>learning</strong> (IPTAs), private institutes of higher <strong>learning</strong> (IPTSs),and training departments the country. Of from all over the total, 46 ofthese E-<strong>learning</strong> providers (61.3 percent) are located in towns and theremaining 29 (38.7 percent) are located in cities in <strong>Malaysia</strong>. Among therespondents were 54 providers (72 percent) from private organisations,and 21 providers (28 percent) from government agencies in the country.Of these, 43 (57.3 percent) were working in organisations that areinvolved in education, training and/or Research and Development (R&D).There were 24 (32 percent) respondents who represented the ICTindustry, and the remaining eight (10.7 percent) represented those whowere not in the other two previously mentioned categories. These E-<strong>learning</strong> providers also revealed that the organisations they work in haveunder 100 employees (32 out of 75 respondents, or 42.7 percent), between101 and 500 employees (16 respondents, or 21.3 percent), between 501 and2500 employees (4 respondents, or 5.3 percent), between 2501 and 10000employees (15 respondents, or 20 percent), and more than 10001employees (8 respondents, or 10.7 percent).Student EnrolmentThe E-<strong>learning</strong> providers were also asked about student enrolment attheir respective organisations (see Table 13). Based on the responses tothe question on nature of organisation, 43 of the 75 providers were fromthe educational/training/research and development fields. As shown inTable 13 there were 11 providers (25.58 percent) who stated that theirstudent enrolment was between 10,001 and 25,000 students. The secondJoint Study by MEWC and OUM 28
highest number of responses was recorded for 10 organisations (23.26percent) that have less than 1,000 students. Two groups of respondents (7respondents each, or representing 16.28 percent for each group) disclosedthat their student enrolments are between 1,001 and 2,500 (for one group),and between 5,001 and 10,000 (for another group), respectively.TABLE 12. Demographic Profile of ProvidersDescriptionFrequency(N = 75)Percentage(%)Location of OrganisationTown 46 61.3City 29 38.7Type of OrganisationTotal 75 100.0Government 21 28.0Private 54 72.0Nature of OrganisationTotal 75 100.0Education/Training/R&D 43 57.3ICT 24 32.0Others 8 10.7Number of Employees (full time, parttime, contract)Total 75 100.0Under 100 32 42.7101-500 16 21.3501 to 2,500 4 5.32,501 to 10,000 15 20.0More than 10,001 8 10.7Total 75 100.0Bandwidth for E-<strong>learning</strong> DeliveryWhen asked about the ideal bandwidth to deliver E-<strong>learning</strong>, only onethird of these E-<strong>learning</strong> providers (25 respondents, or 33.3 percent)perceived that the ideal bandwidth is 2 Mbps or more (see Table 14).There were 13 respondents (17.3 percent) who said that the idealbandwidth should be between 1 Mbps and 2 Mbps. Another group (22respondents, or 29.3 percent) said that between 512 Kbps and 1 Mbps isJoint Study by MEWC and OUM 29
adequate for achieving the ideal bandwidth to deliver E-<strong>learning</strong>. Theremaining 15 E-<strong>learning</strong> providers (20 percent) said that 256 Kbps or lessis enough for delivering E-<strong>learning</strong>. This finding indicates that there maybe some degree of ambiguity among providers with regards to theminimum bandwidth requirement to for delivery of E-<strong>learning</strong>programmes.TABLE 13. Number of Students EnrolledDescriptionFrequency(N = 75)Percentage(%)Under 1000 10 23.261,001 to 2,500 7 16.282,501 to 5,000 6 13.955,001 to 10,000 7 16.2810,001 to 25,000 11 25.58Above 25,000 1 2.33Missing value 1 2.33Total 43 100.00TABLE 14. Ideal Bandwidth to Deliver E-<strong>learning</strong>DescriptionFrequency(N = 75)Percentage(%)256 Kbps or less 15 20.0512 Kbps to 1 Mbps 22 29.31 Mbps to 2 Mbps 13 17.32 Mbps or more 25 33.3Total 75 100.0Standards in E-<strong>learning</strong>The 75 E-<strong>learning</strong> providers were also asked to respond to issues relatedto standards in E-<strong>learning</strong> (see Table 15). Out of the total, 49 (65.3percent) agreed that there should be an adoption of standards in E-<strong>learning</strong>. The majority (62 respondents, or 82.7 percent) also agreed thatthere is a need for <strong>Malaysia</strong>n instititutions to establish E-<strong>learning</strong>standards.Utilization of LMS/LCMSOne of the modes of delivery for E-<strong>learning</strong> is the Learning ManagementSystem (Learning Content Management System). When the respondentswere asked about the Learning Management System/Learning ContentJoint Study by MEWC and OUM 30
Management System that were used or would be used, the responseswere mixed (see Table 16). There were 20 (26.7 percent) respondents whostated that they are using or would be using an <strong>Open</strong> Source Solution fortheir LMS/LCMS. Another 18 (24 percent) said that they are using, orwould be using, an in-house product. There were also a number of E-<strong>learning</strong> providers who stated that they are using commercially availableproducts like WebCT (16 respondents, or 21.3 percent) and Blackboard (7respondents, or 9.3 percent). The remaining 14 (18.7 percent) respondentsrevealed that they are using other systems, such as TMS Seed and LotusLearning Space.TABLE 15. Standards in E-<strong>learning</strong>DescriptionAdoption of standards forE-<strong>learning</strong>Need for <strong>Malaysia</strong>n E-<strong>learning</strong> StandardsYesn(%)49(65.3)62(82.7)Non(%)26(43.7)13(17.3)TotalN(%)75(100.0)75(100.0)TABLE 16. LMS/LCMS used/to be usedDescriptionFrequency(n)Percentage(%)<strong>Open</strong> source solution 20 26.7In-house product 18 24.0WebCT 16 21.3Blackboard 7 9.3Others 14 18.7The E-<strong>learning</strong> providers were also asked about the applications andprovisions made available to support E-<strong>learning</strong> at their respectiveinstitutions. Table 17 indicates that most, that is, 57 (76 percent) of therespondents provide interactive modules/materials. The survey alsorevealed that 74.7 percent of them (56 respondents) are already using anLMS or LCMS. From the total group of respondents, 73.3 percent (55respondents) have technical support personnel available. The majority ofthe group (65.3 percent) also indicated that they have provided sufficientbandwidth for E-<strong>learning</strong> (49 respondents). Out of these 75 providers, 48(64 percent) have acquired authoring tools to support E-<strong>learning</strong> at theirorganisations. About 44 of them (58.7 percent) said that they have videostreaming capabilities, and 32 of them have server log analysers (42.7percent). There were also six respondents (8 percent) who indicated thatthey also provide other applications and services to support E-<strong>learning</strong> attheir organisations, but the actual applications and services are notrevealed by the respondents in this survey.Joint Study by MEWC and OUM 31
TABLE 17. Provision of Applications and Services to Support E-<strong>learning</strong>DescriptionYesn(%)InteractiveModules/Materials57(76.0)LMS/LCMS 56(74.7)Technical Support 55Personnel(73.3)Sufficient49Bandwidth(65.3)Authoring Tools 48(64.0)Video Streaming 44(58.7)Server Log Analyser 32(42.7)Others 6(8.0)Non(%)18(24.0)19(25.3)20(26.7)26(34.7)26(34.7)30(40.0)43(57.3)69(92.0)Missingvaluen(%)0(0)0(0)0(0)0(0)1(1.3)1(1.3)0(0)0(0)TotalN(%)75(100.0)75(100.0)75(100.0)75(100.0)75(100.0)75(100.0)75(100.0)75(100.0)Security Features in the OrganisationThe E-<strong>learning</strong> providers were asked to give information (see Table 18) onone of the most important features in E-<strong>learning</strong> infrastructure: securityfeatures employed in networks and resource servers (web). A majority ofthe providers, (63 respondents or 84.0 percent) said that they have virusscanners in place. Another 60 respondents (80 percent) said that theyhave firewalls, and according to 56 respondents (74.7 percent), theirorganisations have installed network monitoring systems. There were 37respondents from the group (49.3 percent) who revealed that they havespam filtering in place.Provision for Internet ConnectionThe survey also made inquiries about Internet connection that E-<strong>learning</strong>providers have at their respective organisations/institutions. It was foundthat, 34 respondents (45.3 percent) have provided leased lines at theirorganisations. Another 26 (34.7 percent) said that they have subscribed toa <strong>Malaysia</strong>n broadband service, Streamyx. Another ten (13.3 percent) saidthat they have ISDN lines in place, and two respondents (2.7 percent)indicated that they are using dial-up services to gain access to the Internet.Another three respondents (4.0 percent) affirmed they are using otherconnections to the Internet. These findings are presented in Table 19.Joint Study by MEWC and OUM 32
TABLE 18. Security Features Employed in Networks and ResourceServersDescriptionYesn(%)Non(%)Missingvaluen(%)TotalN(%)Virus Scanner 638475(84.0)(10.7)(5.3)(100.0)Firewall 6011475(80.0)(14.7)(5.3)(100.0)Network MonitoringSystems56(74.7)14(18.7)5(6.7)75(100.0)Spam Filtering 3733575(49.3)(44.0)(6.7)(100.0)TABLE 19. Connection to the InternetDescriptionFrequency(N = 102)Percentage(%)Dial-Up 2 2.7Streamyx 26 34.7ISDN 10 13.3Leased Line 34 45.3Other 3 4.0Total 75 100.0Preferences for Single Point of Access to Local E-<strong>learning</strong> ContentThis E-<strong>learning</strong> providers were asked about their preference for a singlepoint of access to local E-<strong>learning</strong> content, as there are several <strong>Malaysia</strong>nE-<strong>learning</strong> websites available currently (i.e. Utusan Education Portal,Kakaktua.com, CikguNet). More than half of the group (40 respondents,or 53.3 percent) indicated that they prefer to have one single point ofaccess to local E-<strong>learning</strong> content (see Table 20).Joint Study by MEWC and OUM 33
TABLE 20. Preference for Single point of Access for Local E-<strong>learning</strong>ContentDescriptionYesn(%)Single Point of Access 40(53.3)Non(%)34(45.3)Missing valuen(%)1(1.3)TotalN(%)75(100.0)3.2 Patterns of ReadinessThe data in the following tables (Table 21 through Table 25)illustrate/show the extent to which E-<strong>learning</strong> providers are ready toembark or have already embarked on E-<strong>learning</strong> programme. The areasinvestigated in this study were related to the personnel, content, technical,environmental and financial dimensions.Personnel ReadinessThe majority of the group, 56 respondents, or 74.7 percent, stated thattheir organisations have a central unit which is dedicated to E-<strong>learning</strong>initiatives (see Table 21). There were 65 respondents (or 86.7 percent)who revealed that their organisations have a team to implement E-<strong>learning</strong>. There were 41 respondents from the group (54.7 percent) whostated that their organisations have a team of dedicated instructionaldesigners. Almost three-quarters of the group, 54 respondents or 72percent, said that they have a staff development plan for E-<strong>learning</strong> attheir respective organisations. In sum, these data consistently revealedthat the majority of these respondents are ready, or have been ready, toembark in E-<strong>learning</strong> initiatives at their respective organisations.In the open-ended item at the end of the survey, respondents wererequired to give comments on Personnel Readiness. One respondentmentioned that the number of personnel needed for E-<strong>learning</strong>implementation in his organisation is inadequate. Some also remarkedthat their lecturers (or enablers, as termed in this study) have a “couldn’tcare less” attitude towards E-<strong>learning</strong>, and are reluctant to upload theircontents on the E-<strong>learning</strong> system that they are using. There were alsosome skeptical comments that questioned the effectiveness of E-<strong>learning</strong>,which affected the way personnel at their respective organisationsaccepted E-<strong>learning</strong>. One of the issues cited was the lack of infrastructure,and another was the lack of demand for E-<strong>learning</strong>, as some personnel (orenablers) placed high value on the conventional face-to-face classroominteraction and considered it to be more effective than lessons deliveredvia E-<strong>learning</strong>. One respondent identified current practices in theirorganisations’ work culture as one of the factors that deterred personnelfrom implementing E-<strong>learning</strong>.The respondents also believed that E-<strong>learning</strong> should complementtraditional or conventional <strong>learning</strong>, and should not replace theconventional form. It was perceived E-<strong>learning</strong> should be treated as anJoint Study by MEWC and OUM 34
option or an alternative methodology to enhance learners’ skills andknowledge. The respondents also expressed their concern about effortswhich focused on re-developing existing systems (or what they termed as“re-inventing the wheel”). Instead they suggested that more effort shouldbe placed on developing expertise in E-<strong>learning</strong>. They believed that morestaff would be willing to commit to the cause when there is expertiseadequate to implement E-<strong>learning</strong>. Without the existence of proper expertpersonnel to implement policies or E-<strong>learning</strong> plans, the respondentsbelieved that organisations should change the way human resources areassigned and had policies are implemented. In the case of academia, eventhough the management of some universities management had mandatedthe implementation of E-<strong>learning</strong> on campus, some lecturers wereunsupportive and refused to upload their lecture slides, for example, intothe E-<strong>learning</strong> system. Other comments include the lack of personnel tomanage the E-<strong>learning</strong> initiatives, although funds were available. Somerespondents also noted that it is common in many organisations to forcepersonnel to develop their own E-<strong>learning</strong> content, without allocating anyform of rewards or recognition. Though most of the comments collectedin this category were somewhat negative, there were a few which werepositive – some academics who responded to this survey indicated thatthey were very positive about the future of E-<strong>learning</strong> in <strong>Malaysia</strong>.TABLE 21. Providers’ Perceptions of Personnel ReadinessDescriptionYesn(%)Non(%)Missingvaluen(%)TotalN(%)Has a central unit dedicated toE-<strong>learning</strong> initiatives56(74.7)18(24.0)1(1.3)75(100.0)Has a team to implement E-<strong>learning</strong>65(86.7)9(12.0)1(1.3)75(100.0)Has a team of dedicatedinstructional designers41(54.7)33(44.0)1(1.3)75(100.0)Has a staff developmentfor E-<strong>learning</strong>plan54(72.0)20(26.7)1(1.3)75(100.0)Content ReadinessAs shown in Table 22, 48 respondents (64.0 percent) indicated that theircontent for E-<strong>learning</strong> was developed in <strong>Malaysia</strong>. About two-thirds ofthe group, 50 respondents or 66.7 percent said that their E-<strong>learning</strong>content was developed in-house. It is interesting to note that more than65 percent or 49 respondents indicated that their E-<strong>learning</strong> content wasdeveloped using internal expertise. At the same time, there were 45respondents (60 percent) who revealed that they have used externalJoint Study by MEWC and OUM 35
expertise to develop content for E-<strong>learning</strong> at their respectiveorganisations. Although 60 percent revealed that they have used externalexpertise to build their E-<strong>learning</strong> content, a large majority of theserespondents revealed that they are capable in developing content locallyfor E-<strong>learning</strong> purposes. In sum, these data reflect a trend towardsinternal content production.Responses to the open-ended questions of the survey instrumentindicated that there was (a) inadequacy, (b) lack of quality and (c) highcost of development of content. To overcome these obstacles, therespondents suggested the formation of a nationwide content repositoryor an E-<strong>learning</strong> portal. This repository or portal would be used as a onestopcentre to facilitate the delivery of free content to receivers or topurchase content sold by content providers. Thus, E-<strong>learning</strong> contentcould be organized according to different sectors, e.g industries, higher<strong>learning</strong> institutions, schools and E-<strong>learning</strong> providers.TABLE 22. Providers’ Perceptions of Content ReadinessDescriptionYesn(%)Non(%)Missingvaluen(%)Developed locally in 48 26 1<strong>Malaysia</strong>(64.0) (34.7) (1.3)TotalN(%)75(100.0)Developed in-house 5024175(66.7)(32.0)(1.3)(100.0)Developed using internalexpertise49(65.3)24(32.0)2(2.7)75(100.0)Developed using externalexpertise45(60.0)28(37.3)2(2.7)75(100.0)Total 192102675(64.0)(34.0)(2.0)(100.0)Technical ReadinessTechnical <strong>readiness</strong> examines the technical capability of an organisation todeliver E-<strong>learning</strong>. Aspects of technical <strong>readiness</strong> include infrastructure,access, and facilities.For this research, the E-<strong>learning</strong> providers were asked about the technical<strong>readiness</strong> of their organisation, in terms of providing E-<strong>learning</strong>.According to the survey, most organisations are ready to provide E-<strong>learning</strong> programmes (see Table 23). There were 68 respondents or 90.7percent who indicated that their organisation is using Intranet technologyto run their daily operations. The Data also revealed that 86.7 percent (65respondents) are already using Internet technology to run dailyJoint Study by MEWC and OUM 36
administrative tasks. There were also 56 respondents (74.7 percent) whostated that their organisation already had broadband facilities. More thanhalf of the group, 64 percent (48 respondents), indicated that theirorganisation already had a Learning Management System (LMS) todeliver E-<strong>learning</strong>. However, the respondents commented thatorganisations should utilize local E-<strong>learning</strong> applications more them theydid at present.On the other hand, the E-<strong>learning</strong> providers who responded to this surveycommented that receivers did not appear to be technically ready. Forexample, broadband facilities are not available for rural grassrootscommunities. One of the feedback received from the respondents revealedthat broadband connection is expensive in East <strong>Malaysia</strong>. Therefore,reasonable prices for broadband access should be introduced to encourageE-<strong>learning</strong>. Without broadband capability, the delivery of E-<strong>learning</strong> willbe ineffective. Hence, it is recommended that point-to-point broadband(at least Super Jaring 34 Mbps) be provided as a possible solution.The respondents also suggested other system, besides the LMS/LCMS tofurther enhance the E-<strong>learning</strong> experiences of receivers. The suggestionsincluded the establishment of a digital library or knowledge managementportal for reference or research purposes. It was also suggested that all ofthese systems be integrated and parked under a comprehensive CampusManagement System to provide value-added service at each educationalinstitutions suggested services included the following: online studentregistration, online course registration, online academic progressmonitoring, and so on.TABLE 23. Providers’ Perceptions of Technical ReadinessDescriptionYesn(%)Non(%)Missingvaluen(%)TotalN(%)Use intranet technologyto run its dailyoperations68(90.7)6(8.0)1(1.3)75(100.0)Use internet technologyto run its dailyOperations65(86.7)9(12.0)1(1.3)75(100.0)Have broadbandfacilities56(74.7)18(24.0)1(2.0)75(100.0)Have a LearningManagement System(LMS) to deliver E-<strong>learning</strong>48(64.0)26(34.7)1(1.3)75(100.0)Joint Study by MEWC and OUM 37
Finally, it was suggested that steps be taken to secure the systems used tosupport and/or deliver E-<strong>learning</strong> systems from viruses threats, hackingand other deviant Internet practices.From the table, it is clear that E-<strong>learning</strong> providers have a high degree oftechnical <strong>readiness</strong> at their respective organisations.Environmental ReadinessA positive environment for E-<strong>learning</strong> is another crucial factor as itdetermines the success of E-<strong>learning</strong> deployment. For example, thegovernment should establish policies which encourage and sustain thedevelopment and growth of E-<strong>learning</strong> in the country.When looking at the environmental <strong>readiness</strong> pattern in the data analysis(Table 24), 64.0 percent of the providers (48 respondents) governmentpolicies have enhanced E-<strong>learning</strong> in their organisation. On the otherhand 42.7 percent (32 respondents) believed that certain governmentpolicies have hindered plans at their respective organisations to invest inE-<strong>learning</strong>. Almost 90 percent (89.3 percent, or 67 respondents) believedthat it is important to have a central agency to play an active role inregulating, in competency development, in research, and in intelligencegathering of E-<strong>learning</strong> initiatives in <strong>Malaysia</strong>. This perception was heldby almost half of the group (49.3 percent, or 37 respondents) who thoughtthat the mass media has helped to promote the value of E-<strong>learning</strong>.About 62.7 percent of the group (47 respondents) believed that the lack oflegal provisions on Intellectual Property (IP) have hindered thedevelopment of E-<strong>learning</strong> content. When asked about the lack of Englishproficiency, 48 respondents (64 percent) thought that it had hindered theprogress of E-<strong>learning</strong> at their organisation.When asked to elaborate further, respondents stated that the educationalsector like the Ministry of Education had not given full support andcommitment towards E-<strong>learning</strong> initiatives. There is a lot of talk about E-<strong>learning</strong>, but generally most of the steps taken have not been effective. Sofar, most of the E-<strong>learning</strong> initiatives have been exclusive to anorganisation, even though these initiatives could be extended to otherorganisations. So, it is proposed that a centralized agency set up tocoordinate the efforts of different organisations.The mass media’s role as an agent of awareness was also seen to beimportant. The media was expected to expose the public to vitalinformation on E-<strong>learning</strong> to enhance the public’s understanding of theconcept of E-<strong>learning</strong>. I was perceived that once the concept isunderstood, the public would be more receptive towards the concept of<strong>learning</strong> via electronic means.The respondents stated that the issue of Intellectual Property should beaddressed by the Government to encourage subject matter experts toJoint Study by MEWC and OUM 38
develop E-<strong>learning</strong> content as most SMEs want to safeguard their IP.English is the most commonly used language for content delivery. Hence,the providers felt their receivers may be overwhelmed by the contentavailable, and consequently became discouraged from <strong>learning</strong> online.TABLE 24. Providers’ Perceptions of Environmental ReadinessDescriptionYesn(%)Non(%)Government Policies mademy institution keen toexplore E-<strong>learning</strong>Mass media made myInstitution keen to explore E-<strong>learning</strong>The lack of legal provisionson intellectual property hashindered the development ofE-<strong>learning</strong> contentCertain government policieshindered our plans to investin E-<strong>learning</strong>Lack of English languageProficiency hinders theprogress of E-<strong>learning</strong>Important to have centralagency to play an active rolein regulating, in competencydevelopment, in research, inintelligence gathering, andE-<strong>learning</strong> initiatives in<strong>Malaysia</strong>48(64.0)37(49.3)47(62.7)32(42.7)48(64.0)67(89.3)26(34.0)38(50.7)28(37.3)43(57.3)27(36.0)7(9.3)Missingvaluen(%)1(1.3)0(0.0)0(0.0)0(0.0)0(0.0)1(1.3)TotalN(%)75(100.0)75(100.0)75(100.0)75(100.0)75(100.0)75(100.0)Financial ReadinessFinancial <strong>readiness</strong> refers to perception of the adequacy of funds allocatedfor E-<strong>learning</strong>.Table 25 shows that in terms of financial <strong>readiness</strong>, 64 percent (48respondents) indicated that their organisations have not allocated enoughfunding for E-<strong>learning</strong>. The data revealed that 53.3 percent (40respondents) stated that their organisations had plans to allocate fundingfor E-<strong>learning</strong>; in comparison, another 21.4 percent (16 respondents)revealed that their organisations did not have these financial plans, whileanother 25.3 percent (19 respondents) did not respond at all to thisquestion.Joint Study by MEWC and OUM 39
According to a respondent, one of the reasons for the reluctance to investin E-<strong>learning</strong> (systems, human resource and so forth) is the lack ofjustification on the returns of investment. In sum, insufficient funds wereperceived to be one of the factors that hindered the execution of E-<strong>learning</strong>.TABLE 25. Providers’ Perceptions of Financial ReadinessDescriptionYesn(%)Non(%)Missingvaluen(%)Institution have allocated 27 48 0adequate funding for E- (36.0) (64.0) (0.0)<strong>learning</strong>Institutions have plans toallocate Funding for E-<strong>learning</strong>40(53.3)16(21.3)19(25.3)TotalN(%)75(100.0)75(100.0)Factors that Hinder E-Learning ExpansionWhen asked about factors that hinder their organisations from goingfurther into E-<strong>learning</strong> in a bigger way or for expanding further, E-<strong>learning</strong> providers indicated a range of opinions. There was an almost 50-50 split in the group’s perception on whether high initial investmentshindered into E-<strong>learning</strong> in a greater scale. There were 52 percent (39respondents) who agreed to this factor, and the remaining 48 percent (36respondents) disagreed. On high operating costs, 54.7 percent (41respondents) did not agree that this factor hindered their organisation’sdirections in E-<strong>learning</strong>, while the remaining 44 percent (33 respondents)agreed that it did. When looking at infrastructure issues, 54.7 percent (41respondents) disagreed that poor infrastructure caused their organisationsto go into E-<strong>learning</strong> to a larger extent. However, the other half of thegroup (45.3 percent, or 34 respondents) agreed with this factor. In termsof content, or the lack of it, 72 percent of the group (54 respondents)disagreed that the lack of content held up plans to increase E-<strong>learning</strong>initiatives.Only 28 percent (21 respondents) agreed that the lack of content wasaffecting the expansion of their E-<strong>learning</strong> initiatives. The rest of therespondents, 72 percent (54 respondents) thought that the contentsavailable were adequate. This suggests that the providers were confidentof the quantity of content offered to receivers.A majority, that is, 88 percent (66 respondents) indicated that they did notagree that their organisations were not reluctant to expand their E-<strong>learning</strong> plans, but there wasn’t any necessity for E-<strong>learning</strong>. There wereabout 88.2 percent (58 respondents) disagreed on factors other than thosecategorized in the survey, and the remaining 10.8 percent (17Joint Study by MEWC and OUM 40
espondents) agreed. However, the “other factors” were not stated by therespondents.TABLE 26. Factors Hindering Organisations from Expending E-<strong>learning</strong> EffortsDescriptionYesn(%)Non(%)Missingvaluen(%)TotalN(%)High Initial Investments 3936075(52.0)(48.0)(0.0)(100.0)High Operating Costs 3341175(44.0)(54.7)(1.3)(100.0)Poor Infrastructure 3441075(45.3)(54.7)(0.0)(100.0)Lack of Content 2154075(28.0)(72.0)(0.0)(100.0)No Necessity for E-<strong>learning</strong>8(10.7)66(88.0)1(1.3)75(100.0)Others 1758075(10.8)(88.2)(0.0)(100.0)3.3 Perception of ReadinessE-<strong>learning</strong> providers’ perceptions on the overall <strong>readiness</strong> of theirrespective organisations were generally positive. Using a ten-point Likertscale (the value “1” being “not ready” and the value “10” being “veryready”), E-<strong>learning</strong> providers were asked to rate the <strong>readiness</strong> ofpersonnel, content, technical, environmentad and financial factors.It was found that technical <strong>readiness</strong> was the highest rated factor amongthe five areas of <strong>readiness</strong>. This was indicated by a mean score of 6.85 fortechnical <strong>readiness</strong>, with a standard deviation of 2.44.The second highest rating was on personnel <strong>readiness</strong>. A mean value of6.52 on the 10-point Likert scale was recorded. The standard deviationvalue recorded for this item was 2.28, indicating a notably divergentspread of scores from the group.Content <strong>readiness</strong> was ranked third. The group’s average score oncontent <strong>readiness</strong> was 6.16, on the 10-point Likert scale (mean value =6.16), and the standard deviation was 2.53.Joint Study by MEWC and OUM 41
In terms of financial <strong>readiness</strong>, the group’s perception was tabulated at amean value of 5.81 and a standard deviation value of 2.447. In theiropinion, organisations were moderately ready to invest in E-<strong>learning</strong>.The lowest score was recorded for the item on environmental <strong>readiness</strong>.The group concluded that they have a slightly lower perception about the<strong>readiness</strong> of the environment (government policies, mass media and soforth), and the mean score for this item was 4.71, with a standarddeviation score of 1.71, indicating a fair amount of agreement among themembers of the group.To conclude, the E-<strong>learning</strong> providers who responded to the surveyperceived that they were generally ready to embark E-<strong>learning</strong>. However,they implied that the environmental factors need to be improved beforethe society/nation can be ready for E-<strong>learning</strong>.TABLE 27. Mean Score of Overall Readiness among ProvidersArea of Readiness Mean Standard Deviation(N=75)Personnel Readiness 6.52 2.28Content Readiness 6.16 2.53Technical Readiness 6.85 2.44Environmental Readiness 4.71 1.71Financial Readiness 5.81 2.45Overall E-Learning Readiness among ProvidersTo investigate the overall perceptions of <strong>readiness</strong> among all E-<strong>learning</strong>providers who participated in this survey, an eye-ball observation of theoverall data indicated that these providers’ perceptions were in themoderate range of agreement (between values 4 and 7, on a 10-pointLikert scale), for four out of five areas presented in this survey. There areillustrated in Table 28 and in Figures 8 through 13.For personnel <strong>readiness</strong>, 40 respondents from the group (53.3 percent)indicated a moderate rating. Another 25 respondents (33.3 percent)scored on the higher end (between values 8 and 10, on the 10-point Likertscale), and the remaining 10 respondents (13.3 percent) indicated a lowperception (between values 1 and 3).When asked to rate content <strong>readiness</strong>, the group continued to respondsomewhere between the moderate and high values (between values 4 and10, on a 10-point Likert scale). There were 39 respondents who had amoderate perception about their content <strong>readiness</strong> (52.7 percent), whileanother 23 respondents (31.1 percent) indicated a higher perception oftheir organisation’s <strong>readiness</strong> for E-<strong>learning</strong> content. The remaining 12Joint Study by MEWC and OUM 42
espondents (16.2 percent) held perceptions that fell under the lowestlevel (between values 1 and 3) on the 10-point Likert scale. It isinteresting to note that almost all of these E-<strong>learning</strong> providers, that is, 68respondents (91.8 percent) indicated a more positive perception (scoringbetween values 4 and 10) about technical <strong>readiness</strong> at their organisations.Only six respondents (8.1 percent) thought they were not technicallyready to provide E-<strong>learning</strong> at their organisations.For environmental <strong>readiness</strong> for E-<strong>learning</strong>, the majority of therespondents (52 respondents, or 70.3 percent) gave moderate ratings.There were four respondents (5.4 percent) who recorded higherperception values (between values 8 and 10, on a 10-point Likert scale),and another group (18 respondents, or 24.3 percent) indicated the lowestperception values (between values 1 and 3).Finally, for financial <strong>readiness</strong>, the group again recorded a more positiveperception about their organisations’ <strong>readiness</strong> to provide E-<strong>learning</strong>.There were 40 respondents (54.8 percent) who believed that theirorganisations were moderately ready to finance E-<strong>learning</strong>, while another20 respondents (27.4 percent) said that their organisations are very readyto finance E-<strong>learning</strong>. The remaining 13 respondents (17.8 percent)thought that their respective organisations were not ready to finance E-<strong>learning</strong> initiatives at their organisations.Joint Study by MEWC and OUM 43
TABLE 28. Level of Overall Readiness among ProvidersLevel of OverallReadinessLow(1 to 3)Moderate(4 to 7)High(8 to 10)N(%)PersonnelN(%)10(13.3)40(53.3)25(33.3)75(100.0)ContentN(%)12(16.2)39(52.7)23(31.1)74(100.0)TechnicalN(%)6(8.1)32(43.2)36(48.6)74(100.0)EnvironmentalN(%)18(24.3)52(70.3)4(5.4)74(100.0)FinancialN(%)13(17.8)40(54.8)20(27.4)73(100.0)Joint Study by MEWC and OUM44
Level of Overall Readiness among Providers807070.3Percentage6050403053.333.352.731.143.248.624.354.827.42013.316.217.8108.15.40Personnel Content Technical Environment FinancialLevelLow Moderate HighFIGURE 8. Level of Overall Readiness among ProvidersJoint Study by MEWC and OUM45
2524.02017.315Percent1012.013.310.79.352.75.3 5.302.00 5.001.00 2 .00 3.00 5 .00 6.00 7.00 8.00 9 .00 10.00Overall Personnel ReadinessFIGURE 9. Overall Personnel Readiness for Providers2017.5716.221513.5113.5113.51Percent106.76 6.7655.414.052.701.00 2.00 3.00 4.00 5.00 6.00 7.00 8.00 9.00 10.00Overall Content ReadinessFIGURE 10. Overall Content Readiness for ProvidersJoint Study by MEWC and OUM 46
2521.62018.916.2Percent151055.46.810.89.58.11.4 1.401.00 2.00 3.00 4.00 5.00 6.00 7.00 8.00 9.00 10.00Overall Technical ReadinessFIGURE 11. Overall Technical Readiness for ProvidersFIGURE 12. Overall Environmental Readiness for ProvidersJoint Study by MEWC and OUM 47
201516.4415.0716.4415.07Percent1010.966.856.8554.115.482.7401.00 2.00 3.00 4.00 5.00 6.00 7.00 8.00 9.00 10.00Overall Financial ReadinessFIGURE 13. Overall Financial Readiness for ProvidersJoint Study by MEWC and OUM 48
3.4 SummaryThis chapter presented the varying levels of <strong>readiness</strong> among E-<strong>learning</strong>providers in <strong>Malaysia</strong>. It may be concluded that these providers arereasonably ready, or have been ready to embark on E-<strong>learning</strong> due to thefollowing reasons:1. Personnel <strong>readiness</strong>A majority of providers who participated in this survey declaredthat their organisation either has a central unit which iscommitted towards developing E-<strong>learning</strong> or a dedicated team toimplement E-<strong>learning</strong>. This unit or team also comprisesinstructional designers. In addition, the respective organisationshave a staff development plan for E-<strong>learning</strong> which reflects thesignificance of E-<strong>learning</strong> personnel.2. Content <strong>readiness</strong>Most providers believe that they are capable of developing E-<strong>learning</strong> content. The providers claimed that the E-<strong>learning</strong>content, which was either developed in house or outsourcedlocally, is adequate for their respective organisations. A majorityalso stressed that they already have internal expertise to developE-<strong>learning</strong> content.3. Technical <strong>readiness</strong>Most providers stated that their organisations have adequatetechnical infrastructure, facilities and services to successfullydevelop and/or deliver E-<strong>learning</strong>. A majority of these E-<strong>learning</strong>providers already have Intranet and Internet technologies,broadband facilities, and also Learning Management Systems inplace for E-<strong>learning</strong> delivery. The respondents were highlypositive about the <strong>readiness</strong> of their organisations.Although these E-<strong>learning</strong> providers perceived that they are ready, orhave been ready to go into E-<strong>learning</strong>, in terms of personnel, content andtechnical <strong>readiness</strong>, they were also discouraged about the levels of<strong>readiness</strong> brought about by environmental and financial factors. Themixed perceptions are healthy, as they indicate the sensitivity andawareness of these E-<strong>learning</strong> providers towards elements that work andneed to work, to ensure that E-<strong>learning</strong> deployment is effective and of ahigh quality.Joint Study by MEWC and OUM 49
4ENABLERSThis section presents findings on the extent to which enablers (tutors,lecturers and trainers) are ready to deliver E-<strong>learning</strong>.4.1 Demographic ProfileThe demographic profile of the enablers is shown in Table 29. The totalnumber of enablers who responded to this study was 977, out of which522 (53.3 percent) were males and 451 (46.2 percent) were females. Themajority (37.8 percent) of the respondents were from the 31 to 40 agegroup. Another 28.2 percent were from the 41 to 50 age group; 23.9percent were less than 30 years old and the rest (9.8 percent) were morethan 51 years old.In terms of positions held, most of the respondents (90.2 percent) wereprofessors, lecturers, tutors or teachers and a very small group of trainers(1.9 percent) and DAGS recipients (0.5 percent). The enablers werepredominantly from educational institutions (92.2 percent). The rest werefrom government agencies (3.9 percent) and private organisations (2.6percent). The main type of educational institution was public colleges oruniversities (55.6 percent) followed by private colleges or universities(29.3 percent). Training institutions made up 3.4 percent while the rest(4.9 percent) were from other types of institutions. The organisationswere located mainly in cities (49.4 percent) and towns (48.9 percent).TABLE 29. Demographic Profile of EnablersGenderDescriptionFrequency(N = 977)Percentage(%)Male 522 53.4Female 451 46.2Missing value 4 0.4Total 977 100Joint Study by MEWC and OUM 50
TABLE 29. Demographic Profile of Enablers (continued)DescriptionFrequency(N = 977)AgePercentage(%)Less than 30 233 23.931 to 40 369 37.841 to 50 275 28.2More than 51 96 9.8Missing value 4 0.4PositionTotal 977 100Prof/Lecturer/Tutor/Teacher 881 90.2Trainer 19 1.9DAGS Recipient 5 0.5Other 67 6.9Missing value 5 0.5OrganisationTotal 977 100Educational Institution 901 92.2Government Agency 38 3.9Private 25 2.6Other 8 0.8Missing value 5 0.5Educational InstitutionTotal 977 100Private college/university 286 31.7Public college/university 542 60.2Training Institute 33 3.7Other 40 4.4Location of organizationTotal 901 100City 483 49.4Town 478 48.9Other 5 0.6Missing value 11 1.1Total 977 100The findings on computer use among the enablers are shown in Table 30.Out of a total of 977 respondents, 98.6 percent had access to a computer.A high percentage of the enablers (95.8 percent) used a computer at theirworkplace. As for frequency of use, 95.9 percent used a computer dailyor almost daily; three percent of the respondents used a computer once aweek and the rest either never used or used it a few times a year or once aJoint Study by MEWC and OUM 51
month. This shows that, in general, the enablers are keeping pace withthe current trend of using computer technology for work relatedpurposes.The list of some popular uses of the computer among enablers is shown inTable 31. The two most popular uses of computers were email (93.4percent) and application software (91.8 percent) while the two leastpopular uses were chatting/instant messaging (38.0 percent) and onlineshopping/reservation/banking (35.2 percent).TABLE 30. Computer Use among EnablersAccess to a computerFrequency(N = 977)Percentage(%)Yes 963 98.6No 10 1.0Missing value 4 0.4Use of computer at workTotal 977 100Yes 936 95.8No 12 1.2Missing value 29 3.0Frequency of computer useTotal 977 100Never 3 0.3A few times a year 2 0.2Once a month 3 0.3Once a week 29 3.0Daily/almost daily 937 95.9Missing value 3 0.3Total 977 100TABLE 31. Popular Uses of Computer among EnablersDescriptionFrequency(N = 977)Percentage(%)Email 913 93.4Application software 897 91.8Information 771 78.9Research 672 68.8Downloading software 620 63.5File sharing with friends and colleagues 567 58.0E-Library 501 51.3E-discussion/E-forum/Listservs473 48.4/NewsgroupChatting/Instant messaging 371 38.0Online shopping/online344 35.2reservation/online bankingOthers 41 4.2Joint Study by MEWC and OUM 52
Four aspects of Internet use among enablers are shown in Table 32. Themajority of the enablers (70.9 percent) admitted to having Internetconnection at home; however, only 39.5 percent accessed Internet fromtheir homes. A larger number (57.3 percent) said they accessed Internetfrom their workplace space. The most common type of Internetconnection at home was dial up at 54.4 percent followed by Streamyx(13.3 percent). The two most common Internet connections at theworkplace were ISDN (23.8 percent) and leased line (23.7 percent). This ismost probably due to the fact that the enablers themselves do not wish topay more than necessary for Internet usage at home whereasorganisations/institutions have provided higher speed connectivity.TABLE 32. Internet Use among EnablersPlace of Internet accessFrequency(N = 977)Percentage(%)Home 386 39.5Workplace 560 57.3Others 12 1.2Missing value 19 2.0Internet connection at homeTotal 977 100Yes 693 70.9No 284 29.1Type of connection at homeTotal 977 100Dial-Up 531 54.4Streamyx 130 13.3ISDN 26 2.7Other 6 0.6Type of Internet connection for workplaceTotal 977 100Dial-Up 120 12.3Streamyx 175 17.9ISDN 233 23.8Leased line 232 23.7Other 68 7.0Missing value 149 15.3Total 977 100Joint Study by MEWC and OUM 53
As shown in Table 33, the top three preferred channels of communicationwere email (94.0 percent), face-to-face (89.0 percent) and SMS (84.2percent).TABLE 33. Preferred Channels of Communication among EnablersDescriptionFrequency(N = 977)Percentage(%)Email 918 94.0Face-to-face 870 89.0SMS 823 84.2Written memo 392 40.1Chat on the Internet 379 38.8Postal mail 236 24.2The figures in Table 34 show that the three most preferred modes of<strong>learning</strong> among enablers were the use of printed materials (83.6 percent),online material (83.4 percent) and face-to-face sessions (78.0 percent).TABLE 34. Preferred Mode/Media of Learning among EnablersDescriptionFrequency(N = 977)Percentage(%)Printed materials 817 83.6Online materials 815 83.4Face to face 762 78.0CD-Rom, DVD 681 69.7Online lectures/tutorials 409 41.9Online conference 182 18.64.2 Patterns of ReadinessThe study on enablers investigated eight dimensions of <strong>readiness</strong>, namelylearner, management, personnel, content, technical, environmental,cultural and financial <strong>readiness</strong>.Learner ReadinessAs indicated in Table 35, 82.5 percent of the enablers felt that theirstudents/community members are interested in upgrading theiracademic/professional qualification through E-<strong>learning</strong>. Another 80.2percent claimed that their students/community members have used theopportunity to engage in E-<strong>learning</strong>. This augurs well for theJoint Study by MEWC and OUM 54
development of E-<strong>learning</strong> in <strong>Malaysia</strong>. Further, 74.0 percent of theenablers were of the opinion that their students/community members areworried that the qualifications obtained via E-<strong>learning</strong>, althoughrecognized by the government are not of the same standard as thoseobtained via on-campus courses. This requires a more assertive role onthe part of the policy makers to acknowledge that E-<strong>learning</strong>qualifications are on par with conventional qualifications.TABLE 35. Enablers’ Perceptions of Learner ReadinessDescriptionYesn(%)Non(%)Missingvaluen(%)Students/community 806 150 21members are interested to (82.5) (15.4) (3.3)upgrade their academicqualificationStudents /communitymembers have used theopportunity to engage inE-LearningStudents/members arecapable of managing theirtime for E-<strong>learning</strong>Students/members arecommitted to E-<strong>learning</strong>Students/members musthave good interpersonal orsocial skillsStudents/members areworried that qualificationsobtained via E-<strong>learning</strong>will not be recognizedStudents/members areworried that qualificationsobtained via E-<strong>learning</strong> arenot the same784(80.2)572(58.8)517(52.9)646(66.1)661(67.7)723(74.0)171(17.5)373(38.2)415(42.5)296(30.3)250(25.6)74.0(22.1)22(2.3)32(3.3)45(4.6)35(3.6)38(3.9)38(3.9)TotalN(%)977(100)977(100)977(100)977(100)977(100)977(100)977(100)An analysis of the qualitative data indicated that learner <strong>readiness</strong> isdependent on several factors. The enablers were of the opinion that urbanlearners are more ready than their rural counterparts. Besides that, theyfelt that E-<strong>learning</strong> is more appropriate and effective for those pursuinghigher education and working adults and for those who are moreproficient in the English Language. Most enablers perceived that greateraccess and know-how among enablers could ensure greater sensitizationto E-<strong>learning</strong> which will in turn lead to a higher level of learner <strong>readiness</strong>.Another point raised by the enablers was that E-<strong>learning</strong> is very muchJoint Study by MEWC and OUM 55
learner-centred and therefore learners need to be more proactive andresponsible when engaging in this mode of <strong>learning</strong>. It was alsohighlighted that E-<strong>learning</strong> is more suitable for non-technical subjects. Itwas observed that enablers did not refer to local content written in BahasaMelayu or any other language.Management ReadinessAs for management <strong>readiness</strong>, the most obvious finding was that 82.6percent of the enablers claimed that their organisation or institution has avision and or mission on E-<strong>learning</strong> (refer to Table 36). Besides that, 66.7percent of the enablers said that their organisation/institution hasformulated policies related to the provision of E-<strong>learning</strong> and 61.2 percentbelieved that their organisation/institution is ready for E-<strong>learning</strong>.TABLE 36. Enablers’ Perceptions of Management ReadinessDescriptionYesn(%)Non(%)Missingvaluen(%)Organisation has a807 150 20vision/mission on E-<strong>learning</strong> (82.6) (15.4) (2.0)Organisation has formulatedpolicies related to theprovision of E-LearningOrganisation recognizesqualifications obtained via E-<strong>learning</strong>Organisation is ready for E-<strong>learning</strong>652(66.7)592(60.6)598(61.2)300(30.7)323(33.1)329(33.7)25(2.6)62(6.3)50(5.1)TotalN(%)977(100)977(100)977(100)977(100)According to the qualitative data analysis, management <strong>readiness</strong> isreflected in institutional investment in E-<strong>learning</strong> programmes. Althoughsome enablers felt that institutions have a budget allocated to E-<strong>learning</strong>,it was also perceived that the lack of exposure and technical skills mayhinder the implementation of E-<strong>learning</strong> initiatives. Generally, it was feltthat co-ordination efforts, complemented by a well-planned and carefullymonitored programme would ensure greater <strong>readiness</strong>. Most enablersthought that E-<strong>learning</strong> is a positive step towards the future of educationand there would be a higher level of <strong>readiness</strong> if E-<strong>learning</strong> wereimplemented in schools for young children.Personnel ReadinessIn terms of personnel <strong>readiness</strong>, 71.5 percent of the enablers indicated thattheir organisation/institution provides technical assistance to staff andstudents. An important point to note is that over 60 percent of theenablers claimed that their organisation/institution has a central dedicatedJoint Study by MEWC and OUM 56
unit as well as a team to implement E-<strong>learning</strong>. This explains the lowpercentage (35.4) accorded to outsourcing of the organisation’s entire E-<strong>learning</strong> project and staff development plan for E-<strong>learning</strong> as shown inTable 37.TABLE 37. Enablers’ Perceptions of Personnel ReadinessDescriptionYesn(%)Non(%)Missingvaluen(%)Has a central unit635 307 35dedicated to E-<strong>learning</strong> (65.0) (31.4) (3.6)initiativesHas a team to implementE-<strong>learning</strong>Has a team of dedicatedinstructional designersOutsources its entire E-<strong>learning</strong> project to anexternal party/partiesHas a staff developmentplan for E-<strong>learning</strong>Provides training on howto support E-<strong>learning</strong>Provides technicalassistance to staff andstudents664(68.0)519(53.1)346(35.4)346(35.4)628(64.3)699(71.5)281(28.8)410(42.0)570(58.3)570(38.4)314(32.1)227(23.2)32(3.3)48(4.9)61(6.3)61(6.2)35(3.6)51(5.2)TotalN(%)977(100)977(100)977(100)977(100)977(100)977(100)977(100)To a large extent, enablers indicated that there was a dire need for trainingthe workforce to manage E-<strong>learning</strong> programmes. There were many callsfor “manpower training” and for efforts to be stepped up toward theupgrading of enablers’ skills. Hence the qualitative data underscored theperception that there was a lack of personnel <strong>readiness</strong>.Content ReadinessWith regards to enablers’ perception of content <strong>readiness</strong>, 83.8 percentbelieved that the content for E-<strong>learning</strong> is useful and 80.8 percent said thatit is meaningful. However, only 42.3 percent were of the opinion that thecontent for E-<strong>learning</strong> is sufficient (refer to Table 38).Qualitative data indicates that there appears to be a common perceptionamong enablers that a great deal needs to be done before there is content<strong>readiness</strong>. This view is substantiated by the fact that enablers were“skeptical” and requested for more research on content. They alsoexpressed the hope that issues of plagiarism and authenticity beJoint Study by MEWC and OUM 57
addressed. Further, enablers felt that there is little or no <strong>readiness</strong> in asfar as technical fields are concerned. They cited examples such asmedicine, architecture, engineering and technical or science basedsubjects. Finally, there was a strong voice indicating a lack of <strong>readiness</strong> inreplacing book-based and face-to-face <strong>learning</strong> with the E-<strong>learning</strong> modeof instruction.TABLE 38. Enablers’ Perceptions of Content ReadinessDescriptionYesn(%)Non(%)Missingvaluen(%)Variety of E-<strong>learning</strong> 733 209 35materials(75.0) (21.4) (3.6)Content for E-<strong>learning</strong> issufficientContent for E-<strong>learning</strong> isappropriate for the needsof the target groupContent for E-<strong>learning</strong> isusefulContent for E-<strong>learning</strong> ismeaningfulAdequate online contentsupport413(42.3)604(61.8)819(83.8)789(80.8)528(54.0)527(53.9)326(33.5)116(11.9)144(14.7)396(40.6)37(3.8)46(4.7)42(4.3)44(4.5)53(5.4)TotalN(%)977(100)977(100)977(100)977(100)977(100)977(100)Technical ReadinessAs shown in from Table 39, 67.6 percent said that theirorganisation/institution is using Intranet technology to run its dailyoperations, whereas 66.0 percent claimed that theirorganisation/institution is using Internet technology. Also, 65.2 percent ofthe enablers perceived that their organisation/institution provides thenecessary infrastructure for E-<strong>learning</strong>.By and large, qualitative data showed that enablers strongly felt that therewas little or no technical <strong>readiness</strong> as far as educational institutions,especially those offering higher education, were concerned. Oft-citedexamples supporting the lack of <strong>readiness</strong> included the lack of access toInternet, lack of software, hardware and other equipment, as well asdisruptive electrical power. In fact, one enabler said that “<strong>Malaysia</strong>nswere not really prepared for E-<strong>learning</strong>” and we needed “more of thetraditional method.” Some enablers felt that <strong>readiness</strong> was directlyrelated to access to the Internet, especially for all individuals who are in E-<strong>learning</strong> programmes.Joint Study by MEWC and OUM 58
TABLE 39. Enablers’ Perceptions of Technical ReadinessDescriptionYesn(%)Non(%)Missingvaluen(%)Provides the necessaryinfrastructure for E-<strong>learning</strong>Provides technical helpto E-learnersOvercome most of thetechnical problemsmyselfContent delivery issatisfactoryUsing IntranettechnologyUsing Internettechnology637(65.2)505(51.7)419(42.9)455(46.6)645(66.0)660(67.6)310(31.7)442(45.2)528(54.0)485(49.6)292(29.9)267(27.3)30(3.1)30(3.1)30(3.1)37(3.8)40(4.1)50(5.1)TotalN(%)977(100)977(100)977(100)977(100)977(100)977(100)Environmental ReadinessThe enablers’ perception regarding environmental <strong>readiness</strong> is shown inTable 40. When asked if they thought that the mass media has createdpublic awareness in E-<strong>learning</strong>, 71.9 percent agreed. Meanwhile, 63.9percent were of the opinion that government policies have made theirstudents/community members interested in E-<strong>learning</strong>. On the otherhand, 72.3 percent of the enablers believed that the lack of Englishlanguage proficiency hinders E-<strong>learning</strong> adoption by theirstudents/community.TABLE 40. Enablers’ Perceptions of Environmental ReadinessDescriptionYesn(%)Non(%)Missingvaluen(%)Government policies 624(63.9)Mass media has createdpublic awarenessLack of legal provisionson intellectual propertyCertain governmentpoliciesLack of English languageproficiency702(71.8)317(32.4)414(42.4)220(22.5)319(32.7)248(25.4)611(62.6)498(51.0)706(72.3)34(3.4)27(2.8)49(5.0)65(6.6)51(5.2)TotalN(%)977(100)977(100)977(100)977(100)977(100)Joint Study by MEWC and OUM 59
Although most enablers acknowledge personal awareness of E-<strong>learning</strong>,many respondents lamented the lack of publicity, institutionalinvolvement and government support for this mode of <strong>learning</strong>. Thus, byway of showing that there was a general lack of <strong>readiness</strong>, enablers feltthat there was a need for strong policies to be put in place and for therecognition of E-<strong>learning</strong> initiatives. Further, enablers commented on theneed to disseminate more information on E-<strong>learning</strong>, and for moreliterature on converting traditional modes of <strong>learning</strong>, or incorporating E-<strong>learning</strong> into current day educational programmes. Most enablers feltthat there would be more environmental <strong>readiness</strong> if the governmentplayed a bigger role in making E-<strong>learning</strong> a more acceptable andrecognized form of becoming qualified for a particular field of work. Tothat end, there were many calls for a national policy on E-<strong>learning</strong>.Cultural ReadinessWith reference to cultural <strong>readiness</strong> (Table 41), 86 percent thought that E-<strong>learning</strong> is an efficient means of disseminating information and 85.6percent agreed that E-<strong>learning</strong> is an advanced mode of teaching and<strong>learning</strong>. However, 87.9 percent of the enablers believed that the personaltouch is important in the <strong>learning</strong> process when using technology for E-<strong>learning</strong>. In line with that, 84.6 percent were of the opinion that the mosteffective method of <strong>learning</strong> is face-to-face and 76.5 percent said that theteacher is still the best information provider.TABLE 41. Enablers’ Perceptions of Cultural ReadinessDescriptionYesn(%)Non(%)Missingvaluen(%)Effective method of827 127 23<strong>learning</strong>(84.6) (13.0) (2.4)The teacher is still the bestinformation providerAn efficient means ofdisseminating informationEnables learners and tutorsto communicate andinteract betterDiscussions via theInternet make <strong>learning</strong>more meaningfulThe personal touch isimportant In the E-<strong>learning</strong> processAn advanced mode/stagein teaching and <strong>learning</strong>748(76.5)840(86.0)678(69.4)679(69.5)859(87.9)836(85.6)206(21.1)111(11.4)271(27.7)267(27.3)87(8.9)97(9.9)23(2.4)26(2.6)28(2.9)31(3.2)31(3.2)44(4.5)TotalN(%)977(100)977(100)977(100)977(100)977(100)977(100)977(100)Joint Study by MEWC and OUM 60
The main theme that emerged from an analysis of the qualitative data oncultural <strong>readiness</strong> is that there is a <strong>readiness</strong> to take part in E-<strong>learning</strong>programmes, provided that it is not the sole mode of delivery. There wasa resounding call for maintaining the traditional form of <strong>learning</strong> by aface-to-face interactive means where the human touch would allow forfeedback and interaction. To quote one enabler, “a judicious mix of faceto-faceand E-<strong>learning</strong> would probably provide the best results. E-<strong>learning</strong> programmes are in their infancy. Much more needs to bedeveloped if we want it to be really effective.” Most respondents felt thatthe electronic mode of <strong>learning</strong> could enhance <strong>learning</strong> and is affordableand practical. However, there was a cultural gap between fully electronicsolutions and those that provided traditional or blended <strong>learning</strong>programmes.Financial ReadinessIt is interesting to note from Table 42 that 85.3 percent of the enablers canafford to buy a computer and pay for Internet access. Further, 82.9percent are willing to spend on Internet connection and 79.8 percent saidthat they are willing to buy a computer for E-<strong>learning</strong>. More than sixtypercent of the enablers perceived that their organisations are willing toinvest in E-<strong>learning</strong> for their employees. It is noteworthy that only 26.2percent has taken a loan to buy a computer.TABLE 42. Enablers’ Perceptions of Financial ReadinessDescriptionYesn(%)Non(%)Willing to buy a computer 780(79.8)170(17.4)Missingvaluen(%)27(2.8)TotalN(%)977(100)Willing to spend on Internetconnection810(82.9)139(14.2)28(2.9)977(100)Taken a loan to buy acomputer256(26.2)687(70.3)34(3.5)977(100)Afford to buy a computer andpay for Internet access833(85.3)114(11.7)30(3.1)977(100)Organisation providescomputer loans to employees653(66.8)284(29.1)40(4.1)977(100)Organisation has invested inthe provision of E-<strong>learning</strong> toits employees610(62.4)322(33.0)45(4.6)977(100)Qualitative analysis on financial <strong>readiness</strong> indicated that enablers thoughtthat Internet charges ought to be kept to the minimum to encourageJoint Study by MEWC and OUM 61
greater usage for E-<strong>learning</strong>. In addition, they expressed concern thatlearners from rural areas may not be able to afford computers. Aninteresting point to note is that while the enablers felt that all enablerswho are involved in E-<strong>learning</strong> ought to be provided with notebooks, notall organisations can afford to do so. In line with that, they proposed thatthe EPF withdrawal scheme for purchasing computers be revived to helpmore people buy computers.4.3 Perception of ReadinessEnablers’ overall perception on the eight dimensions of <strong>readiness</strong> isshown in Table 43. The mean score for seven out of the eight dimensionswas more than 5.50. The highest mean score was for cultural <strong>readiness</strong>(6.77) and the lowest was for environmental <strong>readiness</strong> (5.27), whichhappens to be the only dimension with a mean score of less than 5.50.TABLE 43. Mean Score of Overall Readiness among EnablersArea of Readiness Mean Standard Deviation(N=977)Leaner Readiness 5.73 1.85Management Readiness 6.24 2.24Personnel Readiness 5.88 2.15Content Readiness 5.91 2.11Technical Readiness 5.95 2.10Environmental Readiness 5.27 1.78Cultural Readiness 6.77 1.97Financial Readiness 5.99 1.97Further analysis on the overall <strong>readiness</strong> is shown in Table 44. The figuresindicate that the majority of the enablers perceived that the overall<strong>readiness</strong> for each of the eight dimensions is at the moderate level (refer toFigures 14 through 22). For all dimensions of <strong>readiness</strong>, the percentage ofenablers who felt that the overall <strong>readiness</strong> was at the high level was morethan those who thought that the overall <strong>readiness</strong> was at a low level.However, this trend does not apply to environmental <strong>readiness</strong>; a higherpercentage was recorded for the low level of overall <strong>readiness</strong>.Percentages for the high level of <strong>readiness</strong> were more than for the lowlevel of <strong>readiness</strong> for cultural, management as well as financialdimensions. This indicates that cultural, management and financialdimensions are favourable as far as E-<strong>learning</strong> is concerned.Joint Study by MEWC and OUM 62
TABLE 44. Level of Overall Readiness among EnablersLevel ofOverallReadinessLeanern(%)Managementn(%)Personneln(%)Contentn(%)Technicaln(%)Environmentaln(%)Culturaln(%)Financialn(%)Low1181391461301291655680(1 to 3)(12.5)(14.3)(15.8)(14.1)(13.8)(16.6)(6.1)(8.6)Moderate659518556575565685501560(4 to 7)(70.0)(52.0)(60.1)(62.2)(60.5)(73.9)(54.0)(60.1)High16532022322024088371291(8 to 10)(17.5)(32.7)(24.1)(23.7)(25.7)(9.5)(39.9)(31.3)N942977925925934928928931(%)(100.0)(100.0)(100.0)(100.0)(100.0)(100.0)(100.0)(100.0)Joint Study by MEWC and OUM 63
Level of Overall Readiness among Enablers807070.073.96052.060.162.260.554.060.150Percentage4032.739.931.33024.123.725.7201012.517.514.315.814.113.816.69.56.18.60Learner Management Personnel Content Technical Environment Cultural FinancialLevelLow Moderate HighFIGURE 14. Level of Overall Readiness among EnablersJoint Study by MEWC and OUM 64
2522.22017.818.5Percent1511.512.3108.551.22.83.22.001 2 3 4 5 6 7 8 9Overall Learner ReadinessFIGURE 15. Overall Learner Readiness for Enablers1015.61514.714.813.6Percent109.18.79.27.553.03.801 2 3 4 5 6 7 8 9 10Overall ManagementFIGURE 16. Overall Management Readiness For EnablersJoint Study by MEWC and OUM 65
2017.518.51514.913.8FIGURE 17. Overall Personnel Readiness for EnablersPercent109.27.57.45.552.82.901 2 3 4 5 6 7 8 910Overall Personnel Readiness2018.516.617.31512.4Percent109.78.26.755.12.33.101 2 3 4 5 6 7 8 9 10Overall Content ReadinessFIGURE 18. Overall Content Readiness for EnablersJoint Study by MEWC and OUM 66
2017.91516.416.516.1Percent109.754.96.96.03.62.001 2 3 4 5 6 7 8 9 10Overall Technical ReadinessFIGURE 19. Overall Technical Readiness for Enablers2523.021.020Percent1514.915.0109.65.96.0502.51.21 2 3 4 5 6 7 8 9Overall Environmental Readiness1.01010FIGURE 20. Overall Environmental Readiness for EnablersJoint Study by MEWC and OUM 67
252020.017.6 17.0Percent1512.612.6106.87.3503.71.60.81 2 3 4 5 6 7 8 9 10Overall Cultural ReadinessFIGURE 21. Overall Cultural Readiness for Enablers2520.92017.816.2 15.8Percent15109.67.252.84.43.91.401 2 3 4 5 6 7 8 9 10Overall Financial ReadinessFIGURE 22. Overall Financial Readiness for EnablersJoint Study by MEWC and OUM 68
4.4 SummaryFrom this study, it can be concluded that generally, the enablers have apositive attitude towards E-<strong>learning</strong>. This is reflected in the highpercentage of enablers that have access to a computer with Internetfacilities, and are using it on a daily basis. However, the enablers felt thatE-<strong>learning</strong> is best used together with the printed mode and the moreconventional face-to-face mode of interaction.Overall, the enablers perceived that the <strong>readiness</strong> of each of the eightdimensions is at a moderate level. The factors which appear to impedethe overall <strong>readiness</strong> as highlighted by the enablers include:a. the poor recognition of qualifications obtained via E-<strong>learning</strong>;b. the perceived lack of effectiveness of its use in specialized andtechnical subjects;c. insufficient software, hardware and other computer relatedequipment;d. the lack of availability of Internet access, especially in ruralareas;e. accessibility and last-mile problems when using the Internet;f. the high financial demands on learners in acquiringcomputers and using Internet in E-<strong>learning</strong>;g. insufficient E-<strong>learning</strong> content;h. the lack of proficiency in the English Language amonglearners;i. the lack of training on E-<strong>learning</strong> for enablers; andj. the lack of aggressiveness on the part of the authoritiesconcerned in disseminating information on E-<strong>learning</strong> as wellas inculcating the culture of E-<strong>learning</strong> amongst <strong>Malaysia</strong>ns.On a positive note, cultural <strong>readiness</strong> was accorded the highest rating bythe enablers. This is most probably due to their strong belief that E-<strong>learning</strong> is an advanced mode of teaching and <strong>learning</strong> as well as anefficient way of sharing information. On the other hand, they feltapprehensive about the use of E-<strong>learning</strong> as the sole mode of instruction.They advocated an integration of E-<strong>learning</strong> with other conventionalmodes of instruction such as face-to-face interaction and the use of printbasedmaterials for a more meaningful teaching and <strong>learning</strong> experience.Joint Study by MEWC and OUM 69
5RECEIVERSThis section reports the results of the study on E-<strong>learning</strong> <strong>readiness</strong>among receivers who are generally students enrolled in higher educationinstitutions or trainees of corporate in-service training courses.5.1 Demographic ProfileA total of 4,625 learners and trainees responded to the questionnaire. Ofthese, 1,804 (39 percent) were males and 2,813 (60.8 percent) were females.The figures in Table 45 show that the number of females who participatedin the study was a third more than the number of males.From the tabulation of data on age group, it can be seen that the majorityof receivers were in the age cohort of 25 and below. This age group madeup 70.7 percent of the total sample. The percentage of respondents tendedto decrease as age increased. Thus, most of the learners and traineesinvolved in the study were young adults and only a few, 177 or 3.8percent, were 41 years and above. The data is presented in Table 45 below.TABLE 45. Number of Receivers According to AgeAgeFrequency(N = 4625)Percentage(%)25 and below 3269 70.726-30 436 9.431-35 447 9.736-40 283 6.141 and above 177 3.8Missing value 13 0.3TOTAL 4625 100.0Joint Study by MEWC and OUM 70
The respondents came from various types of residential areas. About halfof the receivers (59.5 percent) stated that they normally resided in towns,while about 27 percent stated that they lived in cities, and the remaining12.7 percent claimed they stayed in rural areas. The complete tabulationof data on the receivers’ place of permanent residence is presented inTable 46.TABLE 46. Receivers’ Place of Permanent ResidencePlaceFrequency(N = 4625)Percentage(%)City 1250 27.0Town 2753 59.5Rural areas 589 12.7Missing value 33 0.7Total 4625 100.0As to where they were studying, the majority of the learners and traineeswho were involved in the study stated that they were enrolled in publiccolleges or universities. They made up 66.2 percent of the totalpopulation. About one third of the population (31.3 percent) wereenrolled in private colleges or public universities. Only 1.1 percent wereenrolled in training institutes and 0.6 from other types of institutions (seeTable 47).TABLE 47. Organisation Enrolment/AttendanceInstitutionFrequency(N = 4625)Percentage(%)Private college/university 1447 31.3Public college/university 3064 66.2Training institute 52 1.1Others 27 0.6Missing value 35 0.7Total 4625 100.0Out of 4,625 learners and trainees who responded to the questionnaire,the majority (63.8 percent) was pursuing a Bachelor Degree, and 25.1percent were enrolled in a certificate/pre-<strong>University</strong>/Diploma programme.There were only 5.1 percent of receivers who were pursuing a Master’sDegree, and a small percentage of receivers were in a PhD programme.Joint Study by MEWC and OUM 71
Refer to Table 48 for data on the type of course or training undertaken byreceivers.TABLE 48. Type of Course/training:DescriptionFrequency(N = 4625)Percentage(%)Certificate/Pre-U/Diploma 1161 25.1Bachelors Degree 2953 63.8Postgraduate Diploma 86 1.9Masters Degree 237 5.1PhD 32 0.7Professional Course 15 0.3Certificate Course 8 0.2In-service Course 69 1.5Other 9 0.2Missing value 55 1.2Total 4625 100.0The respondents were asked to indicate whether they were enrolled inpart-time or full-time study. It was found that the majority of the receivers(77.1 percent) were full-time students and only 21.4 percent enrolled aspart- time learners (see Table 49).TABLE 49. Enrolment StatusDescriptionFrequency(N = 4625)Percentage(%)Full time 3566 77.1Part time 989 21.4Missing value 70 1.5Total 4625 100.0TABLE 50. Computer Access among ReceiversDescriptionFrequency(N = 4625)Access to a computerPercentage(%)Yes 3970 85.8No 570 12.3Missing value 85 1.8Total 4625 100.0Joint Study by MEWC and OUM 72
The data in Table 50 indicated that not every receiver has access to acomputer. Those who do, however, represent a large majority (85.8percent).Where computer usage is concerned, the data presented in Table 51 reflectthat a good majority of the receivers (75.5 percent) use computers daily.Only one percent said that they have never used a computer before.TABLE 51. Frequency of Computer UseDescriptionFrequency(N = 4625)Percentage(%)Never 47 1.0A few times a year 130 2.8Once a month 118 2.6Once a week 809 17.5Daily/Almost daily 3493 75.5Missing value 28 0.6Total 4625 100.0In response to the question on whether they used the computer at work,73.0 percent of the receivers (n=3821) who responded said that they used acomputer at work and about 27.0 percent did not use one at all. A total of804 (17.4 percent) of those sampled did not respond to the question,perhaps because it was only applicable to those who were working. Table52 presents the data on this subject.TABLE 52. Computer Use at WorkDescription Frequency PercentageYes 2790 73.0No 1031 27.0Total 3821 100.0Table 53 provides a more detailed scenario of the purposes for whichcomputers are most popularly used. A total of 82.7 percent of therespondents said that they used it primarily for academic/trainingpurposes, a finding that is consistent with the fact that they werestudentsor trainees. Other purposes include the use of application software (73.1percent) and e-mail (72.2 percent). The high percentage is expected in theuse of e-mail because it is very popular among the younger generation.Chatting was popular among 43.9 percent of respondents, followed bydownloading of software (44 percent), and downloading of music (39.3Joint Study by MEWC and OUM 73
percent). Other uses of the computer included file sharing with friendsand colleagues, network games, e-discussions online, shopping andblogging. Table 53 displays the complete list of the most popular uses ofthe computer among receivers.TABLE 53. Popular Uses of the Computer among ReceiversDescriptionFrequency(N = 4625)Percentage(%)Application Software 3381 73.1E-mail 3340 72.2Chatting/Instant Messaging 2028 43.9Downloading software 2035 44.0Downloading music 1818 39.3File sharing with friends & colleagues 1441 31.2Network games 1282 27.7E-discussion/eforum/listservs/newsgroup1091 23.6Online shopping/online banking 517 11.2Blog 191 4.1Academic/training purposes 3825 82.7TABLE 54. Popular Uses of the Computer for Academic/TrainingPurposesDescriptionFrequency(N = 4625)Percentage(%)Online Application 1301 28.1Course Registration 2184 47.2Course-related Materials 2309 49.9E-library 1631 3.35Information 2964 58.3Course Assignment 2941 63.6Research 2020 43.7Others 118 2.6On the question of what learners used computers for in relation toacademic work, a majority of the receivers indicated that they used it towrite their course assignments (63.6 percent). Computers were also usedby about half the receivers for obtaining information (58.3 percent),research (43.7 percent), obtaining course related materials (49.9 percent)and course registration (47.2 percent). A very small percentage, that is,Joint Study by MEWC and OUM 74
3.3 percent, mentioned that they used the computer to access materialsfrom the e-library (see Table 54).Since the receivers are all students or trainees, one would expect them touse Internet facilities available at their institution of <strong>learning</strong> more oftenthan at other places. However, the findings reflect that this was not thecase. The data presented in Table 55 show that a higher percentage ofstudents (39.5 percent) accessed the Internet at home. Only 25.3 percentaccessed the Internet at school/college/university. About 23.7 percentwent to cyber cafés for these facilities. Table 55 presents the Internet useamong receivers.TABLE 55. Internet Use among ReceiversDescriptionPlace of Internet AccessFrequency(N = 4625)Percentage(%)Home 1829 41.6Cyber café 1098 25.0School/college/university 1172 26.7Work place 273 6.2Other 22 0.5Total 4394 100.0TABLE 56. Internet Connection at HomeDescriptionFrequency(N = 4625)Percentage(%)Yes 2596 56.1No 2029 43.9Total 4625 100.0Out of those who have computers at home, about half (56.1 percent)stated that they have Internet connection at home (see Table 56).The data presented in Table 57 show that the majority of receivers choseto use dial-up (78.0 percent) as their mode to connect to the Internetcompared with other modes. Streamyx was the second most frequentlyused mode (17.2 percent).With regards to the channel of communication receivers liked to use, ahigh percentage of receivers indicated a liking for SMS (85.8 percent), e-mail (83.5 percent) and face-to-face (76.4 percent). About half of thereceivers chat on the Internet (57.2 percent) as a mode of communication.These results concur with the earlier findings on popular use of computerwhere a high percentage of the learners (72.2 percent) stated that theyJoint Study by MEWC and OUM 75
used it for emailing. The use of the written memo (25.0 percent) andpostal mail (22.6 percent) was minimal compared to the other channels ofcommunication.TABLE 57. Type of Connection at HomeDescriptionFrequency(N = 4625)Percentage(%)Dial-up 2025 78.0Streamyx 447 17.2ISDN 71 2.7Other 53 2.0Total 2596 100.0TABLE 58. Preferred Channels of CommunicationDescriptionFrequency(N = 4625)Percentage(%)SMS 3966 85.8E-mail 3861 83.5Face to face 3532 76.4Chat on the Internet 2647 57.2Written memo 1156 25.0Postal mail 1044 22.6Data on mode/media used by the receivers for <strong>learning</strong> show that themajority of them like written or printed materials (86.0 percent). A largepercentage (72.9 percent) of students like online materials which includee-books, e-journals and other web materials, and 72.2 percent like the faceto-facemode of <strong>learning</strong>. Only a small portion of the receivers like toattend online lectures or tutorials (48.1 percent) and online conferences(16.8 percent) (see Table 59).TABLE 59. Preferred Mode/Media for LearningDescriptionFrequency(N = 4625)Percentage(%)Written (printed materials) 3974 86.0Online materials (including e-books, e-journals and other web materials)3370 72.9Face to face 3338 72.2CD-ROM, DVD, other multimediamaterials3094 66.9Online lectures/tutorials 2224 48.1Online conference 777 16.8Joint Study by MEWC and OUM 76
Where point of access is concerned, the majority of the receivers (62.1percent) did not indicate a preference for a single point of access. Only33.5 percent said that they preferred a single point of access for local E-<strong>learning</strong> content (see Table 60).When the receivers were asked to predict how E-<strong>learning</strong> would be usedin the future, 78.7 percent of them agreed that training for every job onearth will be available on the Internet and only 19.2 percent disagreed (seeTable 61).TABLE 60. Preference for Single Point of Access for Local E-<strong>learning</strong>ContentDescriptionFrequency(N = 4625)Percentage(%)Yes 1550 33.5No 2874 62.1Missing value 201 4.3Total 4625 100.0TABLE 61. Predicted Use of E-<strong>learning</strong>DescriptionYesn(%)Non(%)Missingvaluen(%)TotalN(%)One day, training for everyjob on earth will be availableon the Internet3638(78.7)887(19.2)100(2.2)4625(100)5.2 Patterns of ReadinessTable 62 displays the number of receivers who responded to this sectionof the questionnaire. In this section, ten items that deal with the receivers’general perception of E-<strong>learning</strong> were asked. Overall, the receiversresponded positively to all the items. The majority of them (89 percent)indicated that they were willing to make time for E-<strong>learning</strong>. About 83.5percent perceived themselves as able to manage their time for E-<strong>learning</strong>and about 80.2 percent responded that they could discipline themselves tofollow E-<strong>learning</strong> courses. The high percentages of responses reflect thatthe receivers were positive towards E-<strong>learning</strong>.In relation to the support given by their family members, 3,889 (84.1percent) of the receivers felt that their family was supportive and only afew (13.6 percent) responded that their family was not supportive of E-<strong>learning</strong>. A majority of the receivers, 3,869 or 83.7 percent felt that inJoint Study by MEWC and OUM 77
order to be a successful e-learner, they must have good interpersonal orsocial skills. About two thirds of the receivers were concerned about therecognition of the E-<strong>learning</strong> programmes (67.5 percent). In the openendedsection, some expressed strongly that they would only go for E-<strong>learning</strong> if such a mode was recognized by all sectors. To quote one:“My main concern is whether the government and privatesector will recognize the degree I’m taking. Recentlygovernment made it clear that distant <strong>learning</strong> is notrecognized. Is this true?”On the subject of whether they were interested in upgrading theiracademic or professional qualifications through E-<strong>learning</strong>, a very highpercentage (83.0 percent) responded positively and only 15.1 percent saidotherwise. The majority of them (85.5 percent) also responded that theywould grab the opportunity to engage in E-<strong>learning</strong>. A big percentage (73percent) also responded that they would be committed to E-<strong>learning</strong>.Only a few (12.7 percent) responded negatively. Many of the receivers(78.7 percent) felt that one day, training on every job on earth will beavailable on the Internet.Most of the receivers felt that their employers too are skeptical about E-<strong>learning</strong> as they felt that will not allow them to take time off for E-<strong>learning</strong> (21.0 percent) and not allow them to use office facilities outsideoffice hours for E-<strong>learning</strong> (19.5 percent). A total of 36.1 percent of thereceivers themselves were reluctant to use E-<strong>learning</strong> to improve theirwork performance.Content ReadinessMost of the receivers responded positively to questions on content<strong>readiness</strong>. A majority of the receivers, that is, 3,763 (81.4 percent) said thatthere was a variety of E-<strong>learning</strong> materials for them to choose from. Asmall percentage (15.3 percent) said otherwise. Where availability of thecontent of <strong>learning</strong> was concerned, a high percentage of the learners (76.6percent) said that it was available for them but 913 receivers or 19.7responded otherwise.About 70.6 percent felt that the content for E-<strong>learning</strong> was appropriate fortheir needs and only 25.3 percent or 1,172 responded negatively. To thestatement on the usefulness of content of E-<strong>learning</strong>, 85.8 percent said thatit was useful whereas 10.3 percent said it was not. A big number, that is,3787 (81.9 percent) perceived that the content for E-<strong>learning</strong> wasmeaningful whereas only 619 (13.4 percent) perceived it differently.A majority of them (74.1 percent) also agreed that the courses providedonline opportunity for them to discuss and work collaboratively onprojects but only 920 (19.9 percent) did not agree with the statement.About half of the receivers (66.5 percent) felt that the online support suchas library facilities, tutorials and e-discussions were inadequate (see Table63).Joint Study by MEWC and OUM 78
TABLE 62. Receivers’ Perceptions of Learner ReadinessDescriptionYesn(%)Non(%)Missingvaluen(%)I am willing to make thetime for E-<strong>learning</strong>I am able to manage myti for E-<strong>learning</strong> meI can discipline myself tofollow E-<strong>learning</strong>coursesMy family is supportiveof my study via E-<strong>learning</strong>To be a successful e-learner, I must havegood interpersonal orsocial skillsI am worried thatqualifications obtainedvia E-<strong>learning</strong> will notbe recognizedI am interested toupgrade myacademic/professionalqualification through E-<strong>learning</strong>Will you grab theopportunity to engage inE-<strong>learning</strong>?Do you think you will becommitted to E-<strong>learning</strong>?One day, training forevery job on earth willbe available on theInternet(If employed):My employer will giveme the time off to studyvia E-<strong>learning</strong>My employer will let meuse the facilities at workoutside office hours forE-<strong>learning</strong>I am interested toimprove my workperformance through E-<strong>learning</strong>4131(89.3)3861(83.5)3707(80.2)3889(84.1)3869(83.7)3122(67.5)3837(83.0)3955(85.5)3377(73.0)3638(78.7)973(21.0)903(19.5)1668(36.1)435(9.4)694(15.0)841(18.2)629(13.6)659(14.2)1411(30.5)697(15.1)589(12.7)1155(25.0)887(19.2)776(16.8)857(18.5)157(3.4)59(1.3)70(1.5)77(1.7)107(2.3)97(2.1)92(2.0)91(2.0)81(1.8)93(2.0)100(2.2)2876(62.2)2865(61.9)2800(60.5)TotalN(%)4625(100)4625(100)4625(100)4625(100)4625(100)4625(100)4625(100)4625(100)4625(100)4625(100)4625(100)4625(100)4625(100)Joint Study by MEWC and OUM 79
The open-ended responses yielded a few salient points regarding content<strong>readiness</strong>. A few respondents mentioned the necessity of having E-<strong>learning</strong> content in Malay or languages other than English so that it couldreach more people. Others asked for the language to be made simple sothat it would be easy to understand, and be useful to students, withoutcompromising on quality. One stressed on the importance of providingappropriate guidelines on how to access the Internet. Some learnersexpressed their dissatisfaction over matters related to the content. One ofthem was unhappy with the fact that reading materials in the e-librarywere insufficient and that they did not cover all areas.TABLE 63. Receivers’ Perception of Content ReadinessYes No MissingDescriptionn n value(%) (%) n(%)There is a variety of E- 3763 706 156<strong>learning</strong> materials for me (81.4) (15.3) (3.4)to choose fromTotalN(%)4625(100)Content for E-<strong>learning</strong> isavailable3543(76.6)913(19.7)169(3.7)4625(100)Content for E-<strong>learning</strong> isappropriate for my needs3267(70.6)1172(25.3)186(4.0)4625(100)Content for E-<strong>learning</strong> isuseful3969(85.8)475(10.3)181(3.9)4625(100)Content for E-<strong>learning</strong> ismeaningful3787(81.9)619(13.4)219(4.7)4625(100)There is adequate onlinecontent support (e.g.library, tutorials, e-discussions)3074(66.5)1357(29.3)194(4.2)4625(100)The course provides theopportunity for learnersto discuss and workcollaboratively onprojects3425(74.1)920(19.9)280(6.1)4625(100)Joint Study by MEWC and OUM 80
Technical ReadinessReceivers’ perception of technical <strong>readiness</strong> was also analysed. Out ofthose who responded, more than 3,004 (65 percent) receivers reported thattheir institution provided them the necessary infrastructure for E-<strong>learning</strong>, while 1,430 (30.9 percent) reported otherwise. More than half ofthe receivers (60.4 percent) reported that technical help was available forthem and 1,625 (35.1 percent) indicated that this was not true. Althoughtechnical help was available to most of the receivers, only 2,543 (55percent) receivers reported that the technical support was reliable while1,853 (40.1 percent) found it unreliable. In terms of solving technicalproblems, only 1,843 (39.8 percent) of the receivers were able to handlethem, while about two third of receivers (55.8 percent) failed to overcomemost of the technical problems and needed technical help. The speed ofE-<strong>learning</strong> content delivery was satisfactory for 2,280 (49.3 percent)receivers and was unsatisfactory for 2,125 (45.9 percent) receivers. Interms of hands-on training in the context of E-<strong>learning</strong>, 2,214 (47.9percent) receivers had hands-on training from their institutions and 2,103(45.5 percent) receivers did not receive this sort of training from theirinstitutions (see Table 64).TABLE 64. Receivers’ Perceptions of Technical ReadinessYes No MissingDescriptionn n value(%) (%) n(%)The institution where I 3004 1430 191study provides the(65.0) (30.9) (4.1)necessary infrastructure forE-<strong>learning</strong>TotalN(%)4625(100)Technical help is availablefor e-learners2795(60.4)1625(35.1)205(4.4)4625(100)When requested, technicalhelp has proven reliable2543(55.0)1853(40.1)229(5.0)4625(100)I can overcome most of thetechnical problems myself1843(39.8)2581(55.8)201(4.3)4625(100)The speed of E-<strong>learning</strong>content delivery issatisfactory2280(49.3)2125(45.9)220(4.8)4625(100)The institution where Istudy provides hands-ontraining to students of E-<strong>learning</strong>2214(47.9)2103(45.5)308(7.7)4625(100)From the open ended questions, receivers voiced their concern aboutseveral aspects, namely, the availability of computing facilities and accessJoint Study by MEWC and OUM 81
to the Internet as well as, bandwidth of Internet access. This is supportedby the statement below:“technology is ever changing. New tools and products arecreated and built within a short span of time. Hence E-<strong>learning</strong> capability to cope with these rapid technologicalchanges should be in sync with their enthusiastic search forknowledge”The second issue observed from the responses to open-ended questionwas that receivers requested hands-on or practical training beforeembarking on E-<strong>learning</strong> programmes. That technical assistance shouldavailable to assist them is supported by the statements below:“Give practical training to students just before starting theE-<strong>learning</strong> programmme”“The infrastructure of E-<strong>learning</strong> and backups on technicalshould be available all day”Environment ReadinessTABLE 65. Receivers’ Perceptions of Environment ReadinessDescriptionYesn(%)Non(%)Missingvaluen(%)TotalN(%)Government policies havemade me interested in E-<strong>learning</strong>3235(69.9)1220(26.4)170(3.7)4625(100)Mass media has createdpublic awareness in E-<strong>learning</strong>3492(75.5)964(20.8)169(3.7)4625(100)Receivers’ perception of environment <strong>readiness</strong> was also determined inthis section. About two thirds of receivers (3,235 or 69.9 percent) agreedthat government policies ignited their interest in E-<strong>learning</strong> while 1,220(26.4 percent) disagreed. A majority of the receivers (75.5 percent) agreedthat the mass media played an important role in creating publicawareness in E-<strong>learning</strong> and only 964 (20.8 percent) of the receiversdisagreed with this statement (see Table 65). The open ended responsesshowed that the majority of the receivers want the mass media to play agreater role in promoting E-<strong>learning</strong>. That E-<strong>learning</strong> needs to bestrategically publicised is supported by the responses below:“Give more information about E-<strong>learning</strong> through the massmedia”Joint Study by MEWC and OUM 82
“Perlu pendedahan kepada semua lapisan masyarakat”“tingkatkan kesedaran tentang e-pembelajaran kepada masyarakatmelalui media cetak dan media elektronik”Cultural ReadinessReceivers’ perceptions of cultural <strong>readiness</strong> showed that, a majority ofreceivers (4,110 or 88.9 percent) agreed that the face-to-face method is themost effective method for teaching and <strong>learning</strong>. Only a small percentage8.8 percent (406) of receivers disagreed with this. Similar results wereobtained when 87.1 percent receivers agreed that teacher is the bestinformation provider. This concurs with the finding that a majority of thereceivers 4,062 (87.8 percent) felt that when using technology for E-<strong>learning</strong>, the personal touch is important in the <strong>learning</strong> process. Only afew of the receivers 441 (9.5 percent) disagreed with to the statement.Many receivers requested for more face-to-face interaction while E-<strong>learning</strong> was viewed as a supplementary mode of <strong>learning</strong>, as in thestatements below.“Face to face of <strong>learning</strong> is primary but E-<strong>learning</strong> isoptional”“E-<strong>learning</strong> both has advantages and disadvantages. UsingE-<strong>learning</strong> itself is not enough to acquire knowledge. Itshould be using both E-<strong>learning</strong> and cultural method withlearners”High percentage of receivers agreed that E-<strong>learning</strong> is an advanced modein teaching (85.8 percent) and responded positively that E-<strong>learning</strong> is anefficient means of disseminating information (81.3 percent).More than half of the receivers (66.4 percent) felt that the discussions viathe Internet make <strong>learning</strong> more meaningful. However, 1,419 (30.7percent) receivers felt otherwise. The overall result of the section ispresented in Table 66.Financial ReadinessWith respect to financial <strong>readiness</strong>, a majority of receivers (3,646 or 78.8percent) were willing to purchase computers for E-<strong>learning</strong> purposes and(3,628 or 78.4 percent) to spend on Internet connection for E-<strong>learning</strong>purposes. Most of the receivers (2,989 or 64.6 percent) were financiallysound as they did not require loans to purchase computers for E-<strong>learning</strong>purposes. However (2,759 or 59.7 percent) many receivers could afford topurchase computer and the Internet charges. However, there were some1,472 or 31.8 percent of receivers who require loans to purchasecomputers for E-<strong>learning</strong> and 1,672 or 36.2 percent either could not affordJoint Study by MEWC and OUM 83
TABLE 66. Receivers’ Perceptions of Cultural ReadinessDescriptionYesn(%)Non(%)Missingvaluen(%)The most effective method 4110 406 109of <strong>learning</strong> is face-to-face (88.9) (8.8) (2.4)TotalN(%)4625(100)The teacher is still the bestinformation provider4028(87.1)492(10.6)105(2.3)4625(100)Discussions via the Internetmake <strong>learning</strong> moremeaningful3073(66.4)1419(30.7)133(2.9)4625(100)When using technology forE-<strong>learning</strong>, the personaltouch is important in the<strong>learning</strong> process4062(87.8)441(9.5)122(2.6)4625(100)E-<strong>learning</strong> is an efficientmeans of disseminatinginformation3760(81.3)740(16.0)125(2.7)4625(100)E-<strong>learning</strong> is an advancedmode/ stage in teachingand <strong>learning</strong>3967(85.8)474(10.2)184(4.0)4625(100)TABLE 67. Receivers’ Perceptions of Financial ReadinessDescriptionYesn(%)Non(%)Missingvaluen(%)I am willing to buy acomputer for E-<strong>learning</strong>purposesI am willing to spend onInternet connection for E-<strong>learning</strong> purposesI have taken a loan to buy acomputer for E-<strong>learning</strong>purposesI can afford to buy acomputer and pay forInternet access3646(78.8)3628(78.4)1472(31.8)2759(59.7)839(18.1)858(18.6)2989(64.6)1672(36.2)140(3.0)139(3.0)164(3.5)194(4.2)TotalN(%)4625(100)4625(100)4625(100)4625(100)Joint Study by MEWC and OUM 84
to purchase computers or pay for Internet access. This is supported by theresponses such as the following.“Untuk e-pembelajaran yang lebih berkesan, harga untukkomputer dan Internet perlu dikurangkan. Disini kerajaan perlumemain peranan yang besar terutamanya untuk menolong rakyatluar Bandar”“Reduce the price for computer or other Internet access”5.3 Perceptions of ReadinessAn overall picture of receivers’ <strong>readiness</strong> is shown in Table 68 and Table69. On the <strong>readiness</strong> scale of 1 to 10, where 1 indicates a complete lack of<strong>readiness</strong> and 10 indicates total <strong>readiness</strong>, learners indicated the highestlevel overall <strong>readiness</strong>. From Table 68, a majority of the receivers gave amoderate to high level of <strong>readiness</strong> to learner, content, technical, culturaland financial <strong>readiness</strong>. This pattern indicate that receivers are ready toembark on and willing to change or adapt to E-<strong>learning</strong>. In terms ofenvironmental <strong>readiness</strong>, receivers gave a moderate to low level of<strong>readiness</strong> and (lowest mean, 5.39). This perhaps shows that receivers feltthat government agencies, companies and organisations should moreactively promote the benefits of <strong>learning</strong> through E-<strong>learning</strong>.Table 69 and Figures 23 through 29 further illustrate the overall <strong>readiness</strong>among receivers.TABLE 68. Mean Score of Overall Readiness among ReceiverArea of ReadinessMean Standard Deviation(N=4625)Learner Readiness 6.33 2.085Content Readiness 5.88 2.004Technical Readiness 5.59 2.046Environmental Readiness 5.39 1.882Cultural Readiness 5.99 1.930Financial Readiness 6.06 2.250Table 69 and Figures 23 through 29 further illustrate the overall <strong>readiness</strong>among receivers. The perception is that receivers are largely moderatelyready in the areas of <strong>readiness</strong> surveyed.Joint Study by MEWC and OUM 85
E-<strong>learning</strong> Readiness in <strong>Malaysia</strong> 2004TABLE 69. Level of Overall Readiness among ReceiversLevel ofOverallReadinessLearnern(%)Contentn(%)Technicaln(%)Environmentaln(%)Culturaln(%)Financialn(%)Low305475642662408588(1 to 3)(9.9)(11.4)(15.3)(15.3)(9.6)(13.5)Moderate181927662769308428592502(4 to 7)(59.0)(66.4)(65.8)(71.2)(67.4)(57.5)High9589257895879771263(8 to 10)(31.1)(22.2)(19.0)(13.5)(23.0)(29.0)N308241664200433342444353(%)(100.0)(100.0)(100.0)(100.0)(100.0)(100.0)Joint Study by MECW and OUM 86
E-<strong>learning</strong> Readiness in <strong>Malaysia</strong> 2004Level of Overall Readiness among Receivers8071.27066.465.867.46059.057.550Percentage403020109.931.111.422.215.319.015.313.59.623.013.529.00Learner Content Technical Environment Cultural FinancialLevelLow Moderate HighFIGURE 23. Level of Overall Readiness among ReceiversJoint Study by MEWC and OUM 87
2524.620Percent1514.515.5 15.9108.556.04.86.7FIGURE 20. Overall Learner Readiness for Receivers1.8 1.701 2 3 4 5 6 7 8 9Overall Learner Readiness10FIGURE 24. Overall Learner Readiness for Receivers302525.120Percent1517.115.112.9109.156.35.04.32.5 2.50101 2 3 4 5 6 7 8 9 10Overall Content ReadinessFIGURE 25. Overall Content Readiness for ReceiversJoint Study by MECW and OUM 88
3025.825Percent201515.313.910.911.4108.253.4 3.74.53.001 2 3 4 5 6 7 8 9 10Overall Technical ReadinessFIGURE 26. Overall Technical Readiness for Receivers3028.02520Percent16.81513.213.2109.08.252.24.13.22.201 2 3 4 5 6 7 8 9 10Overall Environment ReadinessFIGURE 27. Overall Environment Readiness for ReceiversJoint Study by MEWC and OUM 89
2523.72017.7 17.2Percent1513.7108.86.05.251.92.53.301 2 3 4 5 6 7 8 9 10Overall Cultural ReadinessFIGURE 28. Overall Cultural Readiness for Receivers2521.220Percent1514.4 14.0 14.5106.57.97.47.153.5 3.501 2 3 4 5 6 7 8 9 10Overall Financial ReadinessFIGURE 29. Overall Financial Readiness for ReceiversJoint Study by MEWC and OUM 90
5.4 SummaryThe analysis showed that receivers were moderately ready for E-<strong>learning</strong>.Among the six dimensions, the learner <strong>readiness</strong> has the highest meanfollowed by financial, cultural, content, technical and environmental<strong>readiness</strong>. Receivers were moderately ready to commit, manage, anddiscipline themselves to E-<strong>learning</strong>. They also were willing to allocatetime to upgrade their academic or professional knowledge through E-<strong>learning</strong>. However, most receivers stated their worries regarding therecognition or quality of online education. The primary concern ofreceivers before was recognition of E-<strong>learning</strong> and could be thecontributing factor to the moderate level of learner <strong>readiness</strong> found in thestudy.As for financial <strong>readiness</strong>, it can be generalized that receivers were willingto spend on Internet access and purchase of computers for E-<strong>learning</strong>.However, from the open ended section many of the receivers voiced theirfrustrations over the high cost of Internet connection, broadband and thepurchase of computer peripherals. They also proposed that loans topurchase computer should be made more accessible and tax exemptionson the purchase of computers should be extended to them. Manyreceivers were unaware of tax exemption for computer loans.For cultural <strong>readiness</strong>, most receivers believed that the most effectivemethod of <strong>learning</strong> is face-to-face tutors E-<strong>learning</strong> is viewed as aneffective tool for disseminating information. From the qualitativeresponses many of the receivers felt that E-<strong>learning</strong> must be supportedwith more face-to-face meetings and suggested the face-to-face sessions tobe held during their holidays so that they could meet and discuss theirdifficulties and problems with their tutors. They believed that E-<strong>learning</strong>is an efficient means of information dissemination and an advanced modeof teaching and <strong>learning</strong>. In terms of content <strong>readiness</strong>, receivers appearedto be as moderately ready for E-<strong>learning</strong>. Perhaps receivers viewed thatthe content available was not up to their expectations as most of thecontent were in English medium and local content was not incorporated.On the technical and environmental <strong>readiness</strong>, again, the mean scoresshowed that the receivers were moderately ready for E-<strong>learning</strong>. Thismay be done to the fact that their institutions were in the midst ofembarking on E-<strong>learning</strong> programme and thus, the services and facilitieswere lacking. Receivers also felt that the nation needs to publicize E-<strong>learning</strong> more aggressively in the media. Facilities in the rural areas,electricity connections and broadband facilities also should be extended toall.Table 68 summarizes the levels of <strong>readiness</strong> in the six dimensionsmentioned above. It can be noted that learner and cultural <strong>readiness</strong> wereranked highest while environmental <strong>readiness</strong> was rated the lowest by thereceivers.Joint Study by MECW and OUM 91
6SUMMARY AND RECOMMENDATIONSThis chapter presents the summary of the findings of this study, as well asrecommendations for increasing E-<strong>learning</strong> <strong>readiness</strong> among individualswho works in or study at tertiary-level institutions in <strong>Malaysia</strong>.6.1 SummaryAt the onset, a few general conclusions may be drawn in relation to thefindings on eight areas of <strong>readiness</strong>, Learner, Management, Personnel,Content, Technical, Environmental, Cultural, and Financial Readiness.For the purpose of comparison, the means for overall <strong>readiness</strong> (see Table70 and Figure 30) were compared for all eight areas.To begin, it was found that the findings across all four groups ofrespondents indicated that the lowest degree of <strong>readiness</strong> was in theenvironmental sphere. However, there was little consensus on the areawith the highest degree of <strong>readiness</strong>. Both the Policy Makers andProviders indicated that they were most ready in the technical sphere.TABLE 70. Overall Means for E-<strong>learning</strong> Readiness among PolicyMakers, Providers, Enablers and ReceiversArea of<strong>readiness</strong>PolicyMakerProvider Enabler ReceiverLearner - - 5.73 6.33Management 5.98 - 6.24 -Personnel 5.87 6.52 5.88 -Content - 6.24 5.91 5.88Technical 6.14 6.95 5.95 5.59Environmental 4.76 4.77 5.27 5.39Cultural 6.02 - 6.77 5.99Financial 5.26 5.97 6.39 6.06KeyHighest MeanLowest MeanJoint Study by MEWC and OUM 92
Overall Means for E-<strong>learning</strong> Readiness among Policy Makers, Providers, Enablers and Receivers876Groups of Respondents543210Learner Management Personnel Content Technical Environment Cultural FinancialArea of <strong>readiness</strong>Policy Maker Provider Enabler ReceiverFigure 30. Level of Overall Means for E-<strong>learning</strong> Readiness among Policy Makers, Providers, Enablers and ReceiversJoint Study by MECW and OUM 93
TABLE 71. Areas of Readiness among Respondents by RankArea ofReadinessPolicy Maker Provider Enabler ReceiverMeanStdDevArea ofReadinessMeanStdDevArea ofReadinessMeanStdDevArea ofReadinessMeanStdDevTechnical 6.14 2.32 Technical 6.95 2.44 Cultural 6.77 1.97 Learner 6.33 2.09Cultural 6.02 2.10 Personnel 6.52 2.28 Financial 6.39 1.97 Financial 6.06 2.25Management 5.98 2.47 Content 6.24 2.53 Management 6.24 2.24 Cultural 5.99 1.93Personnel 5.87 2.31 Financial 5.97 2.45 Technical 5.95 2.10 Content 5.88 2.00Financial 5.26 2.55 Environmental 4.77 1.71 Content 5.91 2.11 Technical 5.59 2.05Environmental 4.76 1.93 Personnel 5.88 2.15 Environmental 5.39 1.88Learner 5.73 1.85Environmental 5.27 1.78Joint Study by MEWC and OUM 94
E-<strong>learning</strong> Readiness in <strong>Malaysia</strong> 2004Enablers perceived that the highest level of <strong>readiness</strong> was in the culturalrealm, while Learners felt that their own preparedness was the area ofgreatest <strong>readiness</strong>. These observations are further illustrated in Table 71.In order to facilitate comparisons across groups of respondents as well asamong the eight constructs, the findings were subjected to a macroanalysis.The key features under each construct were consolidated andpresented in a summary table (Table 72). Thus, the key features for eachconstruct (Table 72), and the overall means for <strong>readiness</strong> (Table 71)provided a composite image of degree of <strong>readiness</strong> for each construct.The systematic analysis, combined with in-depth discussion amongparticipant researchers, provided an understanding of degree of<strong>readiness</strong>. Finally, a code (R meaning ‘low amount of <strong>readiness</strong>,’ RRmeaning ‘moderate amount of <strong>readiness</strong>,’ and RRR meaning ‘highamount of <strong>readiness</strong>’) was then assigned to each construct/group. Thisprocess facilitated the drawing up of conclusions in terms of degree of<strong>readiness</strong> for each construct and group of respondents.Based on the above process, a number of conclusions may be drawn aboutthe E-<strong>learning</strong> <strong>readiness</strong> of the nation’s Policy Makers, Providers,Enablers and Receivers. First, all four groups of people involved in E-<strong>learning</strong> were found to be of a low to moderate degree of E-<strong>learning</strong><strong>readiness</strong>. First, Policy Makers were found to be moderately ready interms of management, technical and cultural initiatives, and mildly readyfor personnel, environmental and financial initiatives. Second, Providerswere found to have a high amount of technical <strong>readiness</strong>, but moderateamounts of personnel and content <strong>readiness</strong>. Providers were also notvery advanced in terms of environmental and financial <strong>readiness</strong> as theywere accorded a ‘low’ grade for these areas.Among the four groups of respondents, Enablers were found to be lackingin terms of <strong>readiness</strong> for several constructs under study. When it came totheir conceptions about learner, personnel, content, technical andenvironmental <strong>readiness</strong>, Enablers were accorded only a low or mildamount of <strong>readiness</strong>. However, they were found to be moderately readywhen it came to management, cultural and financial <strong>readiness</strong>.Similarly, Receivers were found to be generally poor in terms of their<strong>readiness</strong> for most of the constructs that were examined. In terms of theirperspective on content, technical, environmental, and cultural <strong>readiness</strong>,Receivers were found to be mildly ready for E-<strong>learning</strong>. However, theywere more or moderately ready when it came to gauging themselves(learner <strong>readiness</strong>), as well as their financial <strong>readiness</strong> for E-<strong>learning</strong>.To conclude, the analysis shows that there is a greater amount of<strong>readiness</strong> on the part of Policy Makers and Organisations as well asProviders in comparison to Enablers and Receivers. On the other hand,while Policy Makers and Organisations as well as Providers present apicture of greater <strong>readiness</strong> where constructs such as management,technical and cultural initiatives are concerned, there appears to be alesser degree of <strong>readiness</strong> for other areas such as of environmental andJoint Study by MECW and OUM 95
financial <strong>readiness</strong>. This may reflect the perspective that although a largeamount of resources have been allocated for management and technicalfacilities, there remains a sense of need for more financial assistance andfor more infrastructure projects in the country. Further, the fact thatEnablers and Receivers reportedly recorded low levels of <strong>readiness</strong> forcontent, technical and environmental <strong>readiness</strong> calls for a throughexamination of procedures for resource allocation and technical initiativesthat are implemented to ensure greater environmental and cultural<strong>readiness</strong> in the country.Joint Study by MEWC and OUM 96
TABLE 72. Summary of FindingsConstruct Policy Maker Provider Enabler ReceiverLearner ReadinessNANAMean 5.73 SD 1.85Students/members interested toupgrade academic/professionalqualification through E-<strong>learning</strong>Mean 6.33 SD 2.09Ready to commit to, manageand discipline themselves fore-<strong>learning</strong>High percentage have used theopportunity to engage in E-<strong>learning</strong>Urban learners are more ready thantheir rural counterpartsThe lack of interest in E-<strong>learning</strong> dueto the lack of recognition ofqualification obtained in E-<strong>learning</strong>E-<strong>learning</strong> is ineffective due to learnerexpectations about teacher role as“sage on stage”Lack of proficiency in EnglishWilling to allocate time toupgrade academic orprofessional knowledgethough E-<strong>learning</strong>Believe E-<strong>learning</strong> is anefficient means ofinformation disseminationand an advanced mode ofteaching and <strong>learning</strong>Concern about recognition ofqualifications accruedthrough online educationE-<strong>learning</strong> is considered moreappropriate for higher level educationKeyDegree of <strong>readiness</strong>R-mild or lowRR-moderate or mediumRRR-highRRRJoint Study by MECW and OUM 97
TABLE 72. Summary of Findings (continued)Construct Policy Maker Provider Enabler ReceiverManagementReadinessMean 5.98 SD 2.47Ready to put in place policiesand mission statements insupport of E-<strong>learning</strong> initiativesNAMean 6.24 SD 2.24Most organisations have vision aswell as policies on E-<strong>learning</strong>NAAspirations have not beenadequately translated intoconcrete action andimplementation plansLack of emphasis on E-<strong>learning</strong> inschoolsLack of coordination efforts inmonitoring of E-<strong>learning</strong>programmes by organisationsRRRRPersonnelReadinessMean 5.87 SD 2.31Inadequate development ofhuman resources such asinstructional designersConcerted effort needed todevelop and organize HRdevelopmentMean 6.52 SD 2.28Most organisations have acentral unit/team dedicated todeveloping & implementing E-<strong>learning</strong>Most organisations have a staffdevelopment plan for E-<strong>learning</strong>Mean 5.88 SD 2.15Lack of E-<strong>learning</strong> exposure andtrainingLack of long term staffdevelopment plan for E-<strong>learning</strong>Greater access and know-howamong enablers could ensuregreater sensitization of E-<strong>learning</strong>NARRRRJoint Study by MEWC and OUM 98
TABLE 72. Summary of Findings (continued)Construct Policy Maker Provider Enabler ReceiverContentReadinessNAMean 6.16 SD 2.53Most providers have internalexpertise capable of developingE-<strong>learning</strong> content in-house orare able to outsource from localdevelopersStill lacking in quality andquantityMean 5.91 SD 2.11Insufficient E-<strong>learning</strong> contentPerceived lack of effectiveness ofits use in specialized andtechnical fieldsAvailable content for E-<strong>learning</strong>is meaningful and usefulMean 5.88 SD 2.0Concern over quality of onlinecontentContent not up toexpectations: content is inEnglish and local content notincorporatedHigh cost of developmenthinders E-<strong>learning</strong> investmentsNeed for nationwide contentrepository (one-stop centre toaccess content)RRRRTechnicalReadinessMean 6.14 SD 2.32Ready to employ E-<strong>learning</strong> as themode of <strong>learning</strong>and instructionMean 6.85 SD 2.44Most organisations haveadequate technicalinfrastructure, facilities andservices to successfully developand/or deliver E-<strong>learning</strong>Mean 5.95 SD 2.10Insufficient software, hardwareand other computer relatedequipmentMean 5.59 SD 2.05Inability to meet high cost ofinternet connection,broadband and purchase ofcomputer peripheralsMost providers already haveIntranet and Internettechnologies, broadbandfacilities, and LMS for E-<strong>learning</strong>deliveryRRRRRRRJoint Study by MEWC and OUM 99
TABLE 72. Summary of Findings (continued)Construct Policy Maker Provider Enabler ReceiverEnvironmentalReadinessMean 4.76 SD 1.93Organisations notsupported by sound E-<strong>learning</strong> policies,effective central E-<strong>learning</strong> agency, andproperly formulatedintellectual propertyregulationsMean 4.71 SD 1.71Government policieshindered plans to invest inE-<strong>learning</strong>.Ministries do not give fullsupport towards E-<strong>learning</strong>implementationNeed for a Central Agencyto coordinate and regulatee-<strong>learning</strong>Mean 5.27 SD 1.78Lack of assertiveness on thepart of the authorities indisseminating informationon E-<strong>learning</strong> as well asinculcating the culture of E-<strong>learning</strong> amongst<strong>Malaysia</strong>nsLack of Internet access,especially in rural areasMean 5.39 SD 1.88Nation needs to publiciseE-<strong>learning</strong> moreaggressively in the mediaPoor facilities in ruralareas; electricity andbroadband facilities notavailable to allProvide legal provisions forIntellectual Property RightsWeak proficiency inEnglish is another obstaclefor e-<strong>learning</strong>RRRRJoint Study by MEWC and OUM 100
TABLE 72. Summary of Findings (continued)Construct Policy Maker Provider Enabler ReceiverMean 6.0 SD 2.1Mean 6.77 SD 1.97Mean 5.99 SD 1.93CulturalReadinessE-<strong>learning</strong> vision appears to beshared by the other personnelin the organisation and in the<strong>Malaysia</strong>n communityNAE-<strong>learning</strong> is viewed as aneffective tool fordisseminating informationE-<strong>learning</strong> must besupported with more faceto face meetingE-<strong>learning</strong> is viewed as anadvanced mode of <strong>learning</strong>Teacher is the bestinformation providerEffective method of<strong>learning</strong> is face-to-facewhile E-<strong>learning</strong> isviewed as an effectivetool for disseminatinginformationLack of recognition ofqualifications obtained via E-<strong>learning</strong>Lack of integration of E-<strong>learning</strong> with otherconventional modes ofinstruction such as face-tofaceinteraction and the use ofprint-based materials for amore meaningful teachingand <strong>learning</strong> experienceRRRRRJoint Study by MEWC and OUM 101
TABLE 72. Summary of Findings (continued)Construct Policy Maker Provider Enabler ReceiverMean 5.26 SD 2.55Mean 5.81 SD 2.45Mean 5.99 SD 1.97Mean 6.06 SD 2.25FinancialReadinessPolicy makers are financiallyready and willing to equiptheir institutions with thenecessary facilities to meetthe challenges of E-<strong>learning</strong>Organisations do notprovide adequatefundingLack of appreciation forvalue of trainingMost able and willing toinvest in hardware andInternetOrganisations providecomputer loans and haveinvested in E-<strong>learning</strong>Willing to spend on theInternet access andpurchase of computersfor e-<strong>learning</strong>Organisations arereluctant to invest in E-<strong>learning</strong> because ROI isnot justifiedRRRRRRJoint Study by MEWC and OUM 102
6.2 RecommendationsBased on the findings of the study, a number of recommendations can bemade with regards to the future of E-<strong>learning</strong> in <strong>Malaysia</strong>. The primaryarea of development for harnessing the E-<strong>learning</strong> potential is capacitybuilding, which refers to the development of individuals andorganisations in order to attain the national goal of becoming aneducational hub in the region. Thus, E-<strong>learning</strong> will feature as a majorcontributor to knowledge building and lifelong <strong>learning</strong> in formal,informal and non-formal <strong>learning</strong> environments, while E-<strong>learning</strong><strong>readiness</strong> would be a necessary ingredient in the realisation of such agoal.Recommendations for the enhancement of E-<strong>learning</strong> <strong>readiness</strong> have beenmade with reference to each of the following areas:1. Human Resource Development2. Research and Development3. Infrastructure4. Infostructure5. Institutional Framework6. Policy Initiatives7. BenchmarkingDetails pertaining to each of these areas follow:6.2.1 Human Resource DevelopmentThe primary goal of human resource development in relation to E-<strong>learning</strong> is to produce local expertise in developing and deployingeffective E-<strong>learning</strong> applications. In this sense, the term ‘humanresource’ refers to policy makers, providers and enablers. Further, thepotential of receivers has to be developed so that there is a ready poolof knowledge workers in the future. The attainment of expertise isessential to the provision of E-<strong>learning</strong>, as this will propel policymakers, providers and enablers to become authorities in E-<strong>learning</strong>,and to build a reputation for their skills and experience in deployingeffective E-<strong>learning</strong> plans in their organisations.To realize these aims, the following recommendations are forwarded:-(a) Appoint a Chief Learning Officer (CLO) in every educationalorganisation who will provide E-leadership to strategise andimplement all E-<strong>learning</strong> initiatives in the institution. The CLOwould implement a change management programme to cultivatean E-<strong>learning</strong> culture among all staff in the institution. He or sheshould be an educationist with training especially in the field ofinstructional/educational technology in particular.(b) Train a core group of E-<strong>learning</strong> experts within each institution sothat they may become trainers of international calibre.Joint Study by MECW and OUM 103
(c) Employ a core team of personnel for E-<strong>learning</strong> consisting ofqualified instructional designers, programmers, graphic designerswho will work with subject matter experts in the institution.Qualified instructional designers are individually trained in thefield of instructional/educational technology in particular.(d) Employ a core team of adequate technical personnel for themaintenance of the E-<strong>learning</strong> infrastructure in each institution.(e) Recognize academic contribution to the development of E-<strong>learning</strong> content by giving significant weightage to such effortsduring annual appraisals and promotion exercises.(f) Ensure that policy makers, providers and enablers are givenperiodic international exposure for the purpose of raisingawareness and building knowledge capability in the field of E-<strong>learning</strong>.(g) Provide sufficient scholarships or educational loans for staffdevelopment in the field of E-<strong>learning</strong>.6.2.2 Research and DevelopmentE-<strong>learning</strong> research should focus on developing a deepereducational vision and to present opportunities for greater accessto innovate instructional facilities. There is also a need fortrainees and researchers to carry out evaluation studies,institutional research and contribute to the development ofquality E-<strong>learning</strong> programmes. Thus, the followingrecommendations are offered for human capacity building in thisarea:(a) Create a new category of grants for E-<strong>learning</strong> research anddevelopment under IRPA (Intensification Research in PriorityAreas) grants by the Ministry of Science, Technology andInnovation.(b) Introduce tax incentives for organisations involved in E-<strong>learning</strong>research and development.(c) Encourage collaborative research on E-<strong>learning</strong> among nationsand among <strong>Malaysia</strong>n institutions using existing networks suchas the ASEAN E-<strong>learning</strong> Network (AEN) and the ASEAN E-<strong>learning</strong> Centre (AEC).6.2.3 InfrastructureThe primary issues with regards to infrastructure for E-<strong>learning</strong> areaccessibility, affordability and connectivity, all of which contribute toJoint Study by MEWC and OUM 104
the existence of the digital divide among <strong>Malaysia</strong>ns. In order toaddress these issues, the following recommendations are forwarded:(a) Ensure equity in accessibility for everyone in rural and urbanareas by providing broadband facilities for all communities.Thus, the goal should be to provide adequate infrastructure for allcommunities, irrespective of where these communities are located.(b) Invigorate an ‘Internet in every home’ campaign (IIEH) so that allresponsible authorities may work toward a common goal. Underproper management, the ‘A computer in every home’ (ACIEH)campaign should also be revitalized.(c) Subsidise broadband Internet access to all schools and extendexisting computing facilities in IPTAs to the public.(d) Reduce Internet and broadband costs so that more individualscan afford to take advantage of the facility in order to run E-<strong>learning</strong> applications.(e) Ensure that providers are able to cater to large volumes ofinternet and broadband traffic by providing adequate bandwidthand with the use of appropriate technology.(f) Provide a national cost-free or subsidised Learning ManagementSystem (LMS) for all E-<strong>learning</strong> institutions, which may then beadapted and adopted.6.2.4 InfostructureThe main concerns with regards to infostructure are the development ofcontent, software, applications and authoring tools that are of high qualitydetermine the success of E-<strong>learning</strong>. Further, the presence of technicalstandards and criteria will facilitate informed decision-making in E-<strong>learning</strong>. For these reasons, the following recommendations areforwarded.(a) Select and adopt an appropriate LMS to cater to the needs ofusers in every organisation.(b) Integrate E-<strong>learning</strong> with tertiary, secondary and primaryeducation.(c) Train learners to use E-<strong>learning</strong> facilities in an ongoing manner.(d) Use a combination of print and online materials to ensure thatstudents who are yet to master the technical aspects ofdownloading and accessing materials are not left out.(e) Establish specific standards for Quality assurance and qualitycontrol so that content is appropriate and meets learner needs.Joint Study by MEWC and OUM 105
(f) Give incentives to companies that develop local E-<strong>learning</strong>contents E-<strong>learning</strong> content.(g) Develop E-<strong>learning</strong> content that multilingual. Libraries wheresuch material is stored should be digitized, user friendly andaccessible to all, with a minimal membership fee being imposed.There should also be technical expertise at libraries to cater tolearner needs.(h) Utilize local expertise in developing E-<strong>learning</strong> content byfarming out the development of E-<strong>learning</strong> content to institutionswith well established content development teams.(i) Develop a system for sharing E-<strong>learning</strong> content among ASEANcountries.(j) Expand academicians’ role include E-content development inorder that E-<strong>learning</strong> becomes the mainstay of higher educationalinstitutions.(k) Introduce easily-operable authoring tools for the purpose ofcreating courseware and for conducting lectures in highereducational institutions.(l) Encourage electronic modes of communication so that all staff arecomputer and Internet savvy.(m) Conduct some training programmes online so that there is greaterawareness among government agencies, IPTAs, IPTS, and<strong>learning</strong> institutions.(n) Establish E-<strong>learning</strong> clubs throughout the country as one stopcenters for technical problems and queries.(o) Make broadband facilities available nationwide to reduceaccessibility problems and the digital divide.6.2.5 Policy InitiativesAn important determinant of E-<strong>readiness</strong> in a country is the move towardestablishing effective policy initiatives geared toward E-<strong>learning</strong>effectives. To this end, the following recommendations are forwarded:a) Investigate factors that hinder E-<strong>learning</strong>. For this purpose, anacademy of E-<strong>learning</strong> should be set up. Here experts wouldbestow recognition of e-<strong>learning</strong> expertise and specialization at anational level. The Academy would also initiate a systematiccompetency mapping effort to develop a database repository oflocal and international experts to promote collaboration of E-<strong>learning</strong> for continuous development.Joint Study by MEWC and OUM 106
) Formulate a strategic business plan to ensure the success of E-<strong>learning</strong> initiatives. Subsequently, the components of an E-<strong>learning</strong> system should be utilised to further develop knowledgemanagement systems and practices within an organisation.c) Improve E-<strong>learning</strong> technology through active research anddevelopment. Members of the Academy ought to implementprogrammes and make policy decisions on E-<strong>learning</strong> standardsas well as undertake quality E-<strong>learning</strong> research anddevelopment.6.2.7 Institutional FrameworkIt is important to view E-<strong>learning</strong> as an integrated system of teaching and<strong>learning</strong>, of research and development, as well as one that is goaloriented.For this reason, all higher education institutions shouldintegrate E-<strong>learning</strong> into their teaching and <strong>learning</strong> not only to upgradetheir qualifications but also to cater for those who want to gain knowledgein certain areas of interest.The institutions of higher <strong>learning</strong> should take the view that E-<strong>learning</strong> isan important mode of delivery that makes <strong>learning</strong> available to a largersection of the population. Thus, the following recommendations may beconsidered:-a) Increase emphasis of E-<strong>learning</strong> in all schools so that youngchildren are exposed to E-<strong>learning</strong> as all schools will be smartschools by 2008, having a systematic e-<strong>learning</strong> programme isvital.b) Enable students in higher education institutions to take upcourses on basic IT skills and information retrieval skills.c) Engage in active discussion with the National ConsultativeCouncil on E-<strong>learning</strong> (NCCeL) in order to formulate and addresspolicy issues.d) Set up a fully operational National E-<strong>learning</strong> Centre (NeLC) tooversee all E-<strong>learning</strong> activities such as policy implementation,R&D training, promotion, quality control and accreditation.e) Formulate policies and establish a national e-<strong>learning</strong> centre topromote and monitor E-<strong>learning</strong> initiatives.f) Co-ordination efforts and monitor E-<strong>learning</strong> development at allorganisations through the creation of MyGfL, which serves as aone-stop centre for the depositing and retrieval of all e-content.g) Make legal provisions for intellectual property rights.Joint Study by MEWC and OUM 107
h) Recognise qualifications acquired through E-<strong>learning</strong> means inthe same light as those acquired through traditional means.i) Use E-<strong>learning</strong> as flexible and highly accessible route to <strong>learning</strong>opportunities for all. This can be quickly realized with thepervasive implementation of policies such as:o Low interest loans and tax exemptions should beavailable for purchasing IT related equipmentso Tax rebates for the trainers and trainees who embark in E-<strong>learning</strong>o Incentives to trainers and academic staff who work extrahours to response to queries and give feedback to E-<strong>learning</strong> userso Allocation of grants to all schools that have plans toembark in E-<strong>learning</strong>6.2.7 Benchmarkinga) Adopt international standards for the preparation of E-<strong>learning</strong>content. The Shareable Content Objects Reference Model may beused for this purpose.b) Promote the use of common platforms such as the <strong>Malaysia</strong>n Gridfor Learning (MyGfL) initiative for sharing and disseminatingcontent and information and providing financial incentives tocontent providers.Joint Study by MEWC and OUM 108
REFERENCESChow, K. H. (2004, October 26). Cheaper broadband can fortify <strong>Malaysia</strong>as ICT hub. Computimes, The New Straits Times, p. 20.Development Gateway (2004, 4 December). Government ICT policy andplan- A catalyst for E-<strong>learning</strong>. Retrieved 25 August, 2004.http://topics.developmentgateway.org/e<strong>learning</strong>/highlights/viewHighlight.do~docName=Government%20ICT%20Policy%20and%20Planse-ASEAN Readiness Assessment by ASEAN and IBM Global Services,October 2001. Retrieved August 18, 2004.http://www.itu.int/asean2001/documents/pdf/Document-28.pdfFoo, E. J. (2004, October 14). More rural Internet centres.Computimes, The New Straits Times, p. 4.Kasim, S. (2004, September 9). National ICT roadmap.Computimes, The New Straits Times, p. 4.Nagy, A. (2004). E-Learning. E-Content Report 6. Retrieved August 18,2004. http://www.acten.net/uploads/images/423/e-<strong>learning</strong>.pdfNational ICT Approaches: Selected Case Studies (<strong>Malaysia</strong>) by Accenture,the Markle Foundation and UNDP. Retrieved August 18, 2004.www.opt-init.org/framework/pages/2.3.html<strong>Open</strong> <strong>University</strong> <strong>Malaysia</strong> (2004). <strong>Asia</strong> Cooperation Dialogue on E-<strong>learning</strong>. KL: <strong>Open</strong> <strong>University</strong> <strong>Malaysia</strong>. Unpublished.Report of the National Information Technology Council (NITC) WorkingGroup on Electronic Learning (UNIMAS, 1999).Report on 2004 E-<strong>readiness</strong> Ranking. A white paper from the EconomistIntelligence Unit, written in cooperation with IBM Corporation.Retrieved August 18, 2004.http://www5.ibm.com/dk/news/pressepdf/e_ready04_full_rep.pdfSani, R. (2004, August 19). Government push to increase broadbandpenetration rate. Computimes, The New Straits Times, p. 4.Joint Study by MEWC and OUM 109
AppendixesJoint Study by MEWC and OUM 110
Appendix ANational Consultative Committee on E-<strong>learning</strong>Joint Study by MEWC and OUM 111
ChairpersonChief Secretary, Ministry of Energy, Communications and MultimediaMembersGovernment AgenciesMinistry of Energy, Communications and MultimediaMinistry of EducationMinistry of Human ResourceMinistry of DefenseEconomic Planning UnitInstitut Tadbiran Awam Negara (INTAN)Unit Pemodenan Tadbiran dan Perancangan Pengurusan <strong>Malaysia</strong>(MAMPU)Jabatan Standard <strong>Malaysia</strong>Wakil Pejabat Setiausaha Kerajaan Negeri PerakEducational Institutions<strong>Open</strong> <strong>University</strong> <strong>Malaysia</strong>UnitarUnitenUniversiti MalayaUniversiti Multimedia <strong>Malaysia</strong>Universiti Sains <strong>Malaysia</strong>Universiti Teknologi MaraIndustryTelekom <strong>Malaysia</strong> BerhadTelekom <strong>Malaysia</strong> Smart SchoolMIMOS BerhadMultimedia Development CorporationJoint Study by MEWC and OUM 112
Appendix BOUM Committee on E-<strong>learning</strong> Readiness in <strong>Malaysia</strong>Joint Study by MEWC and OUM 113
OUM Committee on E-<strong>learning</strong> Readiness in <strong>Malaysia</strong>ChairmanProfessor Dr. Hairudin HarunDirectorCentre for Quality Management and Research & Innovation (COMRI)<strong>Open</strong> <strong>University</strong> <strong>Malaysia</strong>Jalan Tun Ismail50480 Kuala LumpurProfessor Dr. Mohammed YusoffDeanFaculty of Information Technology and Multimedia Communications<strong>Open</strong> <strong>University</strong> <strong>Malaysia</strong>Jalan Tun Ismail50480 Kuala LumpurAssociate Professor Dr. Abd. Razak HabibDeanFaculty of Education, Art and Social Sciences<strong>Open</strong> <strong>University</strong> <strong>Malaysia</strong>Jalan Tun Ismail50480 Kuala LumpurAssociate Professor Dr. Abtar KaurDirector<strong>Open</strong> & Distance Learning Pedagogy Centre<strong>Open</strong> <strong>University</strong> <strong>Malaysia</strong>Jalan Tun Ismail50480 Kuala LumpurAssociate Professor Dr. Ahmad HashemHeadICT Services and Communication<strong>Open</strong> <strong>University</strong> <strong>Malaysia</strong>Jalan Tun Ismail50480 Kuala LumpurAssociate Professor Dr. Syed Abdullah Syed OthmanHeadLearning Management System Unit (myLMS Portal)<strong>Open</strong> <strong>University</strong> <strong>Malaysia</strong>Jalan Tun Ismail50480 Kuala LumpurProfessor Dr. Kasiran BuangConsultantFaculty of Information Technology and Multimedia Communications<strong>Open</strong> <strong>University</strong> <strong>Malaysia</strong>Jalan Tun Ismail50480 Kuala LumpurJoint Study by MEWC and OUM 114
Appendix CWorking Group (Phase I)Joint Study by MEWC and OUM 115
Phase I (January – April 2004)Head, Research Project/ Lead ResearcherAssociate Professor Dr Zoraini Wati AbasFaculty of Education, Arts and Social Sciences<strong>Open</strong> <strong>University</strong> <strong>Malaysia</strong>Jalan Tun Ismail50480 Kuala LumpurHead, SecretariatNik Azlina Nik YaacobManagerResearch and Innovation UnitCentre for Quality Management and Research & Innovation (CQMRI)<strong>Open</strong> <strong>University</strong> <strong>Malaysia</strong>Jalan Tun Ismail50480 Kuala LumpurMembersProfessor Dr Abu Talib b OthmanDirectorInformation Technology CentreUniversiti Perguruan Sultan Ibrahim (UPSI)35400 Tanjung MalimPerakDr Aini IbrahimSpecialist, Organisational Learning and DevelopmentStrategic Planning UnitBank Negara <strong>Malaysia</strong>13th Floor, No. 4, Jalan Sultan Sulaiman50000 Kuala LumpurChng Loi PengFaculty of Science and Foundation Studies<strong>Open</strong> <strong>University</strong> <strong>Malaysia</strong>Jalan Tun Ismail50480 Kuala LumpurAssociate Professor Dr Halimah AwangHeadDept of Administrative Studies and PoliticsFaculty of Economics and AdministrationUniversiti Malaya59100 Kuala LumpurJoint Study by MEWC and OUM 116
Professor Khairuddin HashimDeanFaculty of Information TechnologyUniversiti Tun Abdul RazakKelana Jaya Study Center18-5 Plaza CCL Jalan SS6/12Off Jalan Perbandaran47301 Kelana JayaProfessor Kasiran BuangConsultantFaculty of Information Technology<strong>Open</strong> <strong>University</strong> <strong>Malaysia</strong>Jalan Tun Ismail50480 Kuala LumpurAssociate Professor Dr Kuldip KaurFaculty of Education, Arts and Social Sciences<strong>Open</strong> <strong>University</strong> <strong>Malaysia</strong>Jalan Tun Ismail50480 Kuala LumpurDr Norrizan RazaliManagerSmart School Flagship<strong>Malaysia</strong>n Development CorporationCyberjayaSelangorAssociate Professor Dr Nuraihan Mat DaudDeputy DeanAcademic AffairsUniversiti Islam AntarabangsaJalan Gombak53100 Kuala LumpurAssociate Professor Dr Rahmah HashimConsultantFaculty of Information Technology<strong>Open</strong> <strong>University</strong> <strong>Malaysia</strong>Jalan Tun Ismail50480 Kuala LumpurAssociate Professor Dr Raja Maznah Raja HussainHeadDept of Instructional TechnologyFaculty of EducationUniversiti Malaya50603 Kuala LumpurJoint Study by MEWC and OUM 117
Rohani IsmailManagerTechnology Assimilation & DeploymentMIMOS BerhadTechnology Park <strong>Malaysia</strong>57000 Kuala LumpurSanthi RaghavanFaculty of Business and Management<strong>Open</strong> <strong>University</strong> <strong>Malaysia</strong>Jalan Tun Ismail50480 Kuala LumpurSukor ‘AinProvostInstitut Infotech MaraTingkat 3 & 4, Lot 11C&11DJalan Medan Tuanku50300 Kuala LumpurProfessor Szarina AbdullahPresident-Elect<strong>Malaysia</strong>n Association for Distance Educationc/o Fakulti Pengajian MaklumatUniversiti Teknologi MARA40450 Shah AlamSelangorTengku Putri Norishah Tengku SharimanKetua Unit Program Berasaskan InternetMultimedia <strong>University</strong>Jalan Multimedia63100 CyberjayaSelangorResearch AssistantsIna Mazniza Md IsaLily Suriyani ZahariJoint Study by MEWC and OUM 118
Appendix DWorking Group (Phase III)Joint Study by MEWC and OUM 119
Phase III (August – October 2004)Head, Research Project/ Lead ResearcherAssociate Professor Dr Zoraini Wati AbasFaculty of Education, Arts and Social Sciences<strong>Open</strong> <strong>University</strong> <strong>Malaysia</strong>Jalan Tun Ismail50480 Kuala LumpurMembersProfessor Dr Abu Talib b OthmanDeanInstitut Infotech MaraUniversiti Kuala LumpurTingkat RG, Komplek PertamaJalan Tuanku Abdul Rahman50100 Kuala LumpurChng Loi PengFaculty of Science and Foundation Studies<strong>Open</strong> <strong>University</strong> <strong>Malaysia</strong>Jalan Tun Ismail50480 Kuala LumpurFitri Suraya MohamadDeputy DeanEducational TechnologyCentre for Applied Learning & Multimedia (CALM)Universiti <strong>Malaysia</strong> Sarawak94300 Kota SamarahanSarawakAssociate Professor Dr Kuldip KaurFaculty of Education, Arts and Social Sciences<strong>Open</strong> <strong>University</strong> <strong>Malaysia</strong>Jalan Tun Ismail50480 Kuala LumpurAssociate Professor Dr Latifah Abdol LatifDirectorStudent Affairs<strong>Open</strong> <strong>University</strong> <strong>Malaysia</strong>Jalan Tun Ismail50480 Kuala LumpurJoint Study by MEWC and OUM 120
Associate Professor Dr Mardziah Hayati AbdullahJabatan Bahasa InggerisFakulti Bahasa Moden dan KomunikasiUniversiti Putra <strong>Malaysia</strong>43400 SerdangSelangorPuan Norhaizan Mat TalhaResearch OfficerMIMOS Berhad, Kompleks MIMOSTaman Teknologi <strong>Malaysia</strong>57000 Bukit JalilKuala LumpurDr Norrizan Abdul RazakSchool of Language Studies and LinguisticsFaculty of Social Sciences and HumanitiesUniversiti Kebangsaan <strong>Malaysia</strong>UKM Bangi43650 SelangorAssociate Professor Dr Nuraihan Mat DaudDeputy DeanAcademic AffairsUniversiti Islam AntarabangsaJalan Gombak53100 Kuala LumpurSulaiman SarkawiFakulti Teknologi Maklumat & Komunikasi,Universiti Pendidikan Sultan Idris35900 Tanjong MalimPerakTengku Putri Norishah Tengku SharimanKetua Unit Program Berasaskan InternetMultimedia <strong>University</strong>Jalan Multimedia63100 CyberjayaSelangorDr Tina Lim Swee KimMaktab Perguruan Ipoh Perak31150 Ulu KintaPerakResearch AssistantsIna Mazniza Md IsaSiti Haslinah Abdul RahmanNovel AK LyndonJoint Study by MEWC and OUM 121
Appendix EList of Major RespondentsJoint Study by MEWC and OUM 122
Organisations with 50 respondents or more1. Informatics Smart-Tech Citicampus2. Institut Bahasa Melayu <strong>Malaysia</strong>3. Institut Jati (Legenda Group of Colleges)4. Institut Tadbiran Awam Negara (INTAN)5. INTI International College6. International Islamic <strong>University</strong> <strong>Malaysia</strong>7. Kolej Uniti8. Kolej Universiti Sains dan Teknologi <strong>Malaysia</strong> (KUSTEM)9. Kolej Universiti Teknologi Tun Hussein Onn (KUiTTHO)10. Majlis Amanah Rakyat11. Maktab Perguruan Batu Lintang, Sarawak12. Maktab Perguruan Gaya, Sabah13. Maktab Perguruan Ilmu Khas, Kuala Lumpur14. Maktab Perguruan Ipoh, Perak15. Maktab Perguruan Miri, Sarawak16. Maktab Perguruan Teknik, Kuala Lumpur17. Multimedia <strong>Malaysia</strong> <strong>University</strong>18. Nilai International College19. <strong>Open</strong> <strong>University</strong> <strong>Malaysia</strong>20. Politeknik Port Dickson, Negeri Sembilan21. Politeknik Sultan Haji Hamid (POLISAS), Kuantan22. Sunway College23. Swinburne <strong>University</strong> of Technology (Sarawak branch)24. Telekom Training College, Kota Kinabalu, Sabah25. Universiti Institut Teknologi MARA26. Universiti Kebangsaan <strong>Malaysia</strong>27. Universiti Kuala Lumpur <strong>Malaysia</strong>28. Universiti Malaya29. Universiti <strong>Malaysia</strong> Sarawak30. Universiti Pendidikan Sultan Idris31. Universiti Putra <strong>Malaysia</strong>32. Universiti Sabah <strong>Malaysia</strong>Joint Study by MEWC and OUM 123
33. Universiti Sains <strong>Malaysia</strong>34. Universiti Teknologi <strong>Malaysia</strong>35. Universiti Tenaga Nasional (UNITEN)36. Universiti Utara <strong>Malaysia</strong>37. <strong>University</strong> College Sedaya InternationalJoint Study by MEWC and OUM 124
Appendix FSurvey Instrument for Policy MakersJoint Study by MEWC and OUM 125
A Study on E-<strong>learning</strong> Readiness in <strong>Malaysia</strong>What Policy Makers Have to SayA study on E-<strong>learning</strong> Readiness in <strong>Malaysia</strong> is being conducted nationwide by the Ministry of Energy, Water andCommunications with the assistance of the <strong>Open</strong> <strong>University</strong> <strong>Malaysia</strong>. The study seeks to determine the E-<strong>learning</strong><strong>readiness</strong> of the country as perceived by policy makers, providers, enablers and learners in organisations andinstitutions of higher education/training centres, in both the government and private sectors.We value your input to the study. The questionnaire comprises of two parts, Section A and Section B. It will take about 5-10 minutes of your time. Please be assured that your responses will be held in the strcitest confidence.For this study, E-<strong>learning</strong> is defined as “the use of networked and web-based technologies to enhance the quality of<strong>learning</strong>.”_______________________________________________________________________________1. Your position in the organisation/institution:SECTION AٱٱٱٱٱٱٱٱCEO/President/Vice ChancellorVice President/Deputy Vice ChancellorExecutive DirectorManaging DirectorGeneral ManagerDirector/DeanManager/HeadOther (pls specify): ____________________________2. Name of organisation/institution: __________________________3. Location of organisation/institution:Town/City: _____________________State: _________________________4. Type of organisation/institution:ٱGovernment ٱPrivate 5. Nature of organisation/institution:ٱٱٱBanking/Finance/Accounting/InsuranceEducation/Training/R&DEnergy/TelecommunicationٱEntertainment/Production/Broadcasting ٱICT ٱMedical/Dental/Healthcare ٱState/Local/Federal Government ٱOther (pls specify): ____________________________ Joint Study by MECW and OUM 126
6. Number of employees (full-time, part-time, contract) in the whole organisation/institution:ٱAbove 25,000 ٱ10,001 to 25,000 ٱ5,001 to 10,000 ٱ2,501 to 5,000 ٱ1,001 to 2,500 ٱ501 to 1,000 ٱ101 to 500 ٱUnder 100 7. If you are an educational institution, number of students enrolled:ٱAbove 25,000 ٱ10,001 to 25,000 ٱ5,001 to 10,000 ٱ2,501 to 5,000 ٱ1,001 to 2,500 ٱUnder 1000 8. What connection to the Internet does your organisation/institution have?ٱDial up ٱStreamyx ٱISDN ٱLeased Line ٱOther (pls specify): ________________________ Instruction: Please respond to the following.SECTION BA. Management Readiness Yes No1. My organisation/institution has a vision / mission on E-<strong>learning</strong>.2. My organisation/institution has formulated policies related to the provision of E-<strong>learning</strong>.3. My organisation/institution recognizes qualifications obtained via E-<strong>learning</strong>.4. On a scale of 1 to 10, how ready is the management in your organisation/institution for E-<strong>learning</strong>?1 2 3 4 5 6 7 8 9 10Not readyVery readyB. Personnel Readiness Yes No1. My organisation/institution has a central unit dedicated to E-<strong>learning</strong> initiatives.2. My organisation/institution has a team to implement E-<strong>learning</strong>.3. My organisation/institution has a team of dedicated instructional designers.4. My organisation/institution has a staff development plan for E-<strong>learning</strong>.5. On a scale of 1 to 10, how ready are the personnel for E-<strong>learning</strong>?1 2 3 4 5 6 7 8 9 10Not readyVery readyC. Technical Readiness Yes No1. Is your organisation/institution using Intranet technology to run its daily operations?2. Is your organisation/institution using Internet technology to run its daily operations?3. Does your organisation/institution have broadband facilities?4. Does your organisation/institution have a Learning Management System (LMS) to deliver e-<strong>learning</strong>?5. On a scale of 1 to 10, how ready are you technically (infrastructure, access, facilities, etc.) for E-<strong>learning</strong>?1 2 3 4 5 6 7 8 9 10Not readyVery readyJoint Study by MEWC and OUM 127
D. Environmental Readiness Yes No1. Government policies have made my organisation/institution keen to explore E-<strong>learning</strong>.2. Mass media has made my organisation/institution keen to explore E-<strong>learning</strong>.3. The lack of legal provisions on intellectual property has hindered the development of E-<strong>learning</strong>in my organisation/institution.4. Certain government policies have hindered our plans to invest in E-<strong>learning</strong>.5. Lack of English language proficiency hinders E-<strong>learning</strong> in my organisation/institution.6. It is important to have a central agency to play an active role in regulating, competencydevelopment, research, intelligence gathering and E-<strong>learning</strong> initiatives in <strong>Malaysia</strong>.7. On a scale of 1 to 10, how ready is the society / nation for E-<strong>learning</strong>?1 2 3 4 5 6 7 8 9 10Not readyVery readyE. Cultural Readiness Yes No1. Ultimately, E-<strong>learning</strong> should be the mode of <strong>learning</strong> in my organisation/institution.2. We believe that E-<strong>learning</strong> will help my organisation/institution remain competitive in the K-based economy.On a scale of 1 to 10, how ready are you in using E-<strong>learning</strong> for teaching and <strong>learning</strong>?1 2 3 4 5 6 7 8 9 10Not readyVery readyF. Financial Readiness Yes No1. My organisation/institution provides a computer loan to the employees.2. My organisation/institution provides funds for employees to attend conferences and training onE-<strong>learning</strong>.3. My organisation/institution has allocated a budget to develop E-<strong>learning</strong> content.4. My organisation/institution has allocated a budget to acquire E-<strong>learning</strong> content.5. On the scale of 1 to 10, how would you rate the overall financial <strong>readiness</strong> in your organisation/institution towardsE-<strong>learning</strong>?1 2 3 4 5 6 7 8 9 10Not readyVery readyG. What factors have hindered your organisation from going into E-<strong>learning</strong> in a bigger way or from expandingfurther? (Select all that apply)ٱhigh initial investment ٱhigh operating costs ٱpoor infrastructure ٱlack of content ٱno necessity for E-<strong>learning</strong> ٱOther (pls specify): _________________________________ H. Other Comments (Your other opinions, perceptions and suggestions relating to E-<strong>learning</strong> are appreciated)____________________________________________________________________________________________________________________________________________________________________________________________________________________________________________________________________________________________________________________________________________________________________________________________________Joint Study by MEWC and OUM 128
Appendix GSurvey Instrument for ProvidersJoint Study by MECW and OUM 129
A Study on E-<strong>learning</strong> Readiness in <strong>Malaysia</strong>What Providers Have to SayA study on E-<strong>learning</strong> Readiness in <strong>Malaysia</strong> is being conducted nationwide by the Ministry of Energy, Water andCommunications with the assistance of the <strong>Open</strong> <strong>University</strong> <strong>Malaysia</strong>. The study seeks to determine the E-<strong>learning</strong><strong>readiness</strong> of the country as perceived by policy makers, providers, enablers and learners in organisations andinstitutions of higher education/training centres, in both the government and private sectors.We value your input to the study. The questionnaire comprises of two parts, Section A and Section B. It will take about 5-10 minutes of your time. Please be assured that your responses will be held in the strictest confidence.For this study, E-<strong>learning</strong> is defined as “the use of networked and web-based technologies to enhance the quality of<strong>learning</strong>.”____________________________________________________________________________________SECTION A1. Your position in the organisation/institution: ____________________________2. Name of organisation: __________________________3. Location of organisation:Town/City: ________________________State: ________________________4. Type of organisation:ٱGovernment ٱPrivate 5. Nature of organisation:ٱٱٱٱٱٱٱٱBanking/Finance/Accounting/InsuranceEducation/Training/R&DEnergy/TelecommunicationEntertainment/Production/BroadcastingICTMedical/Dental/HealthcareState/Local/Federal GovernmentOther (pls specify): ____________________________6. Number of employees (full-time, part-time, contract) in the whole organisation/institution:ٱAbove 25,000 ٱ10,001 to 25,000 ٱ5,001 to 10,000 ٱ2,501 to 5,000 ٱ1,001 to 2,500 ٱ501 to 1,000 ٱ101 to 500 ٱUnder 100 7. If you are an educational institution, number of students enrolled:Joint Study by MECW and OUM 130
ٱAbove 25,000 ٱ10,001 to 25,000 ٱ5,001 to 10,000 ٱ2,501 to 5,000 ٱ1,001 to 2,500 ٱUnder 1000 8. What is the ideal bandwidth required to deliver your E-<strong>learning</strong> solution?ٱ256 Kbps or less ٱ512 kbps to 1 Mbps ٱ1 Mbps to 2 Mbps ٱ2 Mbps or more 9. Are you adopting any particular standards in the area of E-<strong>learning</strong> content and system?ٱYes ٱNo 10. Is there a need for <strong>Malaysia</strong>n E-<strong>learning</strong> Standards?ٱYes ٱNo 11. Which of the following LMS/LCMS do you use or intend to use?ٱWebCT ٱIn-house product ٱBlackboard ٱ<strong>Open</strong> source solution ٱOther (pls specify): _________________________ 12. The applications & services provided to support E-<strong>learning</strong>:ٱLMS/LCMS ٱauthoring tools ٱinteractive modules/materials ٱvideo (on demand) streaming ٱserver log analyzer ٱsufficient bandwidth ٱtechnical support personnel ٱOthers: _________________________________ 13. Security features employed in your network and resource servers (web):ٱfirewall ٱnetwork monitoring system ٱvirus scanner ٱspam filtering 14. What connection to the Internet does your organisation/institution have?ٱDial up ٱStreamyx ٱISDN ٱLeased Line ٱOther (pls specify): ________________________ 15. Several local E-<strong>learning</strong>websites (e.g. Utusan Education Portal, Kakaktua.com, and Cikgu.Net) are currentlyavailable. Would you prefer to have one single point of access to local E-<strong>learning</strong> content?ٱYes ٱNo SECTION BJoint Study by MEWC and OUM 131
Instruction: Please respond to the following.A. Personnel Readiness Yes No5. My organisation/institution has a central unit dedicated to E-<strong>learning</strong> initiatives.6. My organisation/institution has a team to implement E-<strong>learning</strong>.7. My organisation/institution has a team of dedicated instructional designers.8. My organisation/institution has a staff development plan for E-<strong>learning</strong>.9. On a scale of 1 to 10, how ready are the personnel for E-<strong>learning</strong>?1 2 3 4 5 6 7 8 9 10Not readyVery readyB. Content Readiness Yes No1. Content for E-<strong>learning</strong> is developed locally in <strong>Malaysia</strong>2. Content for E-<strong>learning</strong> is developed in-house.3. Content for E-<strong>learning</strong> is developed using internal expertise4. Content for E-<strong>learning</strong> is developed using external expertise5. On a scale of 1 to 10, how ready are you in terms of content for E-<strong>learning</strong>?1 2 3 4 5 6 7 8 9 10Not readyVery readyC. Technical Readiness Yes No6. Is your organisation/institution using Intranet technology to run its daily operations?7. Is your organisation/institution using Internet technology to run its daily operations?8. Does your organisation/institution have broadband facilities?9. Does your organisation/institution have a Learning Management System (LMS) to deliverE-<strong>learning</strong>?10. On a scale of 1 to 10, how ready are you technically (infrastructure, access, facilities, etc.) for E-<strong>learning</strong>?1 2 3 4 5 6 7 8 9 10Not readyVery readyD. Environmental Readiness Yes No7. Government policies have enhanced the relevance of my organisation/institution in theprovision of E-<strong>learning</strong>.8. Mass media has helped to promote the value of e-<strong>learning</strong>.9. The lack of legal provisions on intellectual property has hindered the development of E-<strong>learning</strong> content.10. Certain government policies have hindered our plans to further invest in E-<strong>learning</strong>.11. Lack of English language proficiency hinders the progress of E-<strong>learning</strong>.12. It is important to have a central agency to play an active role in regulating, competencydevelopment, research, intelligence gathering and E-<strong>learning</strong> initiatives in <strong>Malaysia</strong>.8. On a scale of 1 to 10, how ready is the society / nation for e-<strong>learning</strong>?1 2 3 4 5 6 7 8 9 10Not readyVery readyE. Financial Readiness Yes No6. The organisation has/organisations we work with have allocated adequate funding for E-<strong>learning</strong>If NO to the above question:7. The organisation has/organisations we work with have plans to allocate funding for E-<strong>learning</strong>.Joint Study by MEWC and OUM 132
8. On a scale of 1 to 10, how ready is your organisation/institution to invest in E-<strong>learning</strong>?1 2 3 4 5 6 7 8 9 10Not readyVery readyF. What factors have hindered your organisation from going into E-<strong>learning</strong> in a bigger way or from expandingfurther? (Select all that apply)ٱhigh initial investment ٱhigh operating costs ٱpoor infrastructure ٱlack of content ٱno necessity for E-<strong>learning</strong> ٱOther (pls specify): _________________________________ G. Other Comments (Your other opinions, perceptions and suggestions relating to E-<strong>learning</strong> are appreciated)______________________________________________________________________________________________________________________________________________________________________________________________________________________________________________________________________________________________________________________________________________________________________________________________________________________________________________________________________________________________________________________________________________________________________________________________________Joint Study by MEWC and OUM 133
Appendix HSurvey Instrument for EnablersJoint Study by MECW and OUM 134
A Study on Readiness in <strong>Malaysia</strong>What Enablers Have to SayA study on E-<strong>learning</strong>Readiness in <strong>Malaysia</strong> is being conducted nationwide by the Ministry of Energy, Water andCommunications with the assistance of the <strong>Open</strong> <strong>University</strong> <strong>Malaysia</strong>. The study seeks to determine the E-<strong>learning</strong><strong>readiness</strong> of the country as perceived by policy makers, providers, enablers and learners in organisations andinstitutions of higher education/training centres, in both the government and private sectors.We value your input to the study. The questionnaire comprises of two parts, Section A and Section B. It will take about 5-10 minutes of your time. Please be assured that your responses will be held in the strictest confidence.For this study, E-<strong>learning</strong> is defined as “the use of networked and web-based technologies to enhance the quality of<strong>learning</strong>.”____________________________________________________________________________________1. Gender:SECTION AٱMale ٱFemale 2. Age:ٱ18 - 25 ٱ 26 - 30 ٱ 31 - 35 ٱ 36 – 40 ٱ 41 – 45 ٱ 46 - 50 ٱ 51 - 55 ٱ > 55 3. I am a/an:ٱProf/Lecturer/Tutor/Teacher ٱTrainer ٱDAGS Recipient ٱOther (pls specify): ________________________ 4. Type of organisation/institution:ٱEducational institution □ private college/university□ public college/university□ training institute□ Other: _________________________ٱGovernment agency ٱPrivate ٱOther (pls specify): _________________________ 5. Name of organisation: __________________________6. Location of organisation:Town/City:ٱCity ٱTown ٱOther (pls specify): _____________________ State: _________________________7. Do you have access to a computer?ٱYes ٱNo Joint Study by MECW and OUM 135
8. Do you use a computer?ٱNever ٱ Once a month ٱ Daily/Almost daily ٱA few times a year ٱOnce a week If NEVER, skip to No. 159. Do you use a computer at work?ٱYes ٱNo 10. I use a computer for: (tick all that apply)ٱApplication software (e.g. word processing, spreadsheet, statistical analysis, database, presentations, computergames, graphics)ٱE-mail ٱChatting/instant messaging ٱE-discussion/E- forum/listservs/newsgroup ٱFile sharing with friends & colleagues ٱDownloading software ٱOnline shopping/online reservation/online banking, etc.ٱe-library ٱinformation ٱresearch ٱOthers (pls specify): ________________ 11. I access the Internet mostly from the:ٱHome ٱWork place ٱOthers (pls specify): ________________________ 12. Do you have Internet connection at home?ٱYes ٱNo 13. If you access the Internet from home, what connection to the Internet do you use?ٱDial up ٱStreamyx ٱISDN ٱOther (pls specify): ________________________ 14. What connection to the Internet do you use from your work place?ٱDial up ٱStreamyx ٱISDN ٱLeased Line ٱOther (pls specify): ________________________ 15. Choose up to 4 of the following channels of communication that you most prefer:ٱٱٱٱٱٱFace-to-faceSMSE-mailChat on the InternetWritten memoPostal mailJoint Study by MEWC and OUM 136
16. Choose up to 4 of the following mode/media for <strong>learning</strong> that you most prefer:ٱٱٱٱٱٱWritten (printed materials)Online materials (include e-books, e-journals and other web materials)CD-ROM, DVD, other multimedia materialsFace-to-faceOnline conferenceOnline lectures / tutorials16. Several local E-<strong>learning</strong> websites (e.g. Utusan Education Portal, Kakaktua.com, and Cikgu.Net) are currentlyavailable. Would you prefer to have one single point of access to local E-<strong>learning</strong> content?ٱYes ٱNo SECTION BInstruction: Please respond to the following.A. Learner Readiness Yes No1. One day, training for every job on earth will be available on the Internet.2. My students/community members are interested to upgrade their academic/professionalqualification through E-<strong>learning</strong>.3. My students/community members have used the opportunity to engage in E-<strong>learning</strong>.4. My students/community members are capable of managing their time for E-<strong>learning</strong>.5. My students/community members are committed to E-<strong>learning</strong>.6. To be a successful e-learner, my students/community members must have good interpersonalor social skills.7. My students/community members are worried that qualifications obtained via E-<strong>learning</strong> are notof the same standard as qualifications obtained via on-campus courses, although recognizedby the government.8. My students/community members are worried that qualifications obtained via E-<strong>learning</strong> will notbe recognized.9. On a scale of 1 to 10, how ready are your students/community members for E-<strong>learning</strong>?1 2 3 4 5 6 7 8 9 10Not readyVery readyB. Management Readiness Yes No6. My organisation/institution has a vision/mission on E-<strong>learning</strong>.7. My organisation/institution has formulated policies related to the provision of E-<strong>learning</strong>.8. My organisation/institution recognizes qualifications obtained via E-<strong>learning</strong>.9. My organisation/institution is ready for E-<strong>learning</strong>.10. On a scale of 1 to 10, how ready is the management in your organisation/institution for E-<strong>learning</strong>?1 2 3 4 5 6 7 8 9 10Not readyVery readyC. Personnel Readiness Yes No10. My organisation/institution has a central unit dedicated to E-<strong>learning</strong> initiatives.11. My organisation/institution has a team to implement E-<strong>learning</strong>.12. My organisation/institution has a team of dedicated instructional designers.13. My organisation/institution outsources its entire E-<strong>learning</strong> project to an external party/parties.14. My organisation/institution has a staff development plan for E-<strong>learning</strong>.Joint Study by MEWC and OUM 137
15. My organisation/institution provides training on how to support E-<strong>learning</strong>.16. My organisation/institution provides technical assistance to staff and students17. On a scale of 1 to 10, how ready are the personnel for E-<strong>learning</strong>?1 2 3 4 5 6 7 8 9 10Not readyVery readyD. Content Readiness Yes No6. There is a variety of E-<strong>learning</strong> materials to choose from.7. Content for E-<strong>learning</strong> is sufficient.8. Content for E-<strong>learning</strong> is appropriate for the needs of the target group.9. Content for E-<strong>learning</strong> is useful.10. Content for E-<strong>learning</strong> is meaningful.11. There is adequate online content support (e.g. library, tutorials, e-discussions)12. On a scale of 1 to 10, how ready are you in terms on content for E-<strong>learning</strong>?1 2 3 4 5 6 7 8 9 10Not readyVery readyE. Technical Readiness Yes No1. The organisation/institution where I work provides the necessary infrastructure for E-<strong>learning</strong>.2. I am able to provide technical help to e-learners.3. I can overcome most of the technical problems myself.4. The speed of E-<strong>learning</strong> content delivery is satisfactory.5. My organisation/institution is using Intranet technology to run its daily operations.6. My organisation/institution is using Internet technology to run its daily operations.11. On a scale of 1 to 10, how ready are you technically (infrastructure, access, facilities, etc.) for E-<strong>learning</strong>?1 2 3 4 5 6 7 8 9 10Not readyVery readyF. Environmental Readiness Yes No9. Government policies have made my students/community members interested in E-<strong>learning</strong>.10. Mass media has created public awareness in E-<strong>learning</strong>.11. The lack of legal provisions on intellectual property has hindered the development of E-<strong>learning</strong>in my organisation/institution.12. Certain government policies have hindered our plans to invest in E-<strong>learning</strong>.13. Lack of English language proficiency hinders E-<strong>learning</strong> adoption by my students/community14. On a scale of 1 to 10, how ready is the society/nation for E-<strong>learning</strong>?1 2 3 4 5 6 7 8 9 10Not readyVery readyG. Cultural Readiness Yes No1. The most effective method of <strong>learning</strong> is face-to-face.2. The teacher is still the best information provider.3. E-<strong>learning</strong> is an efficient means of disseminating information.4. E-<strong>learning</strong> enables learners and tutors to communicate and interact better with one another.5. Discussions via the Internet make <strong>learning</strong> more meaningful.6. When using technology for e-<strong>learning</strong>, the personal touch is important in the <strong>learning</strong> process.7. E-<strong>learning</strong> is an advanced mode/stage in teaching and <strong>learning</strong>.8. On a scale of 1 to 10, how ready are you in using E-<strong>learning</strong> for teaching and <strong>learning</strong>?1 2 3 4 5 6 7 8 9 10Not readyVery readyJoint Study by MEWC and OUM 138
H. Financial Readiness Yes No9. I am willing to buy a computer for E-<strong>learning</strong> purposes.10. I am willing to spend on Internet connection for E-<strong>learning</strong> purposes.11. I have taken a loan to buy a computer for E-<strong>learning</strong> purposes.12. I can afford to buy a computer and pay for Internet access.13. Our organisation provides computer loans to employees.14. Our organisation has invested in the provision of E-<strong>learning</strong> to its employees.15. On the scale of 1 to 10, how would you rate the overall financial <strong>readiness</strong> in your organisation/institution towardsE-<strong>learning</strong>?1 2 3 4 5 6 7 8 9 10Not readyVery readyI. Other Comments (Your other opinions, perceptions and suggestions relating to E-<strong>learning</strong> are appreciated)__________________________________________________________________________________________________________________________________________________________________________________________________________________________________________________________________________________________________________________________________________________________________________________________________________________________________________________________________________________________________________________________________________________________________________________________________________________________________________________________________________________________________________________________________________________________________________________________________________________________________________________________________________________________________________________________________________________________________________________Joint Study by MEWC and OUM 139
Appendix ISurvey Instrument for ReceiversJoint Study by MECW and OUM 140
A Study on E-<strong>learning</strong>Readiness in <strong>Malaysia</strong>What Learners Have to SayA study on E-<strong>learning</strong> Readiness in <strong>Malaysia</strong> is beingconducted nationwide by the Ministry of Energy, Waterand Communications with the assistance of the <strong>Open</strong><strong>University</strong> <strong>Malaysia</strong>. The study seeks to determine the E-<strong>learning</strong> <strong>readiness</strong> of the country as perceived by policymakers, providers, enablers and learners inorganisations and institutions of higher education/trainingcentres, in both the government and private sectors.We value your input to the study. The questionnairecomprises of two parts, Section A and Section B. It willtake about 5-10 minutes of your time. Please be assuredthat your responses will be held in the strictestconfidence.Kajian Kesediaan E-Pembelajaran di <strong>Malaysia</strong>Apa Kata Pelajar/PesertaKajian tentang Kesediaan E-Pembelajaran di <strong>Malaysia</strong>sedang dijalankan di seluruh negara oleh KementerianTenaga, Air & Komunikasi dengan kerjasama UniversitiTerbuka <strong>Malaysia</strong> (OUM). Kajian ini bertujuan menentukantahap kesediaan e-pembelajaran di negara ini sebagaimanapersepsi pembuat dasar, pembekal, pihak yangmembolehkan (enablers) dan pelajar/peserta diorganisasi dan institusi pengajian tinggi/pusat latihan, baiksektor awam mahupun swasta.Kami menghargai respon anda kepada kajian ini.Soalselidik ini mengandungi dua bahagian, Bahagian A danBahagian B. Kajian ini akan mengambil kira-kira 5-10 minit.Respon anda adalah dirahsiakan.For this study, E-<strong>learning</strong> is defined as “the use ofnetworked and web-based technologies to enhancethe quality of <strong>learning</strong>.”Untuk kajian ini, e-pembelajaran ditakrifkan sebagai“penggunaan teknologi rangkaian dan berasaskan web(networked and web-based technologies) untukmeningkatkan kualiti pembelajaran.”_______________________________________________________________________________1. Gender:Jantina:SECTION ABAHAGIAN AٱMale LelakiٱFemale Perempuan2. Age:Umur:ٱ< 18 ٱ 18 - 25 ٱ 26 - 30 ٱ 31 - 35 ٱ 36 – 40 ٱ 41 – 45 ٱ 46 - 50 ٱ 51 – 55 ٱ > 55 3. Place of permanent residence:Tempat tinggal tetap:Town/City:Bandar/Bandaraya:ٱCity BandarayaٱTown BandarٱOther (pls specify): _____________________ Lain-lain (sila nyatakan):State : _________________________ Negeri :Joint Study by MECW and OUM 141
4. I am enrolled/attending an in-service course in a:Saya berdaftar/sedang berkursus di sebuah:ٱPrivate college/university Kolej/universiti swastaٱPublic college/university Kolej/universiti awamٱTraining institute Institut latihanٱOther (pls specify) : ___________________________ Lain-lain (sila nyatakan):5. Name of institution: __________________________Nama Institusi:6. Type of course/training:Jenis kursus/latihan:ٱCertificate/Pre-U/Diploma Sijil/Pra-U/DiplomaٱBachelors degree Ijazah Sarjana Muda/BacelorٱPostgraduate diploma Diploma Pasca-siswazahٱMasters degree Ijazah SarjanaٱPhD Ijazah Kedoktoran/PhDٱProfessional course Kursus ProfesionalٱCertificate course Kursus SijilٱIn-service course Kursus dalam perkhidmatanٱOther (pls specify) : ____________________________ Lain-lain (sila nyatakan):7. Enrollment Status (if student):Status Pendaftaran (jika pelajar):ٱPart-time SambilanٱFull- time Sepenuh masa8. Do you have access to a computer?Adakah anda mempunyai akses kepada komputer?ٱYes YaٱNo Tidak9. Do you use a computer?Adakah anda menggunakan komputer?ٱNever Tidak pernahٱA few times a year Beberapa kali setahunٱOnce a month Sebulan sekaliٱOnce a week Seminggu sekaliٱDaily/Almost daily Setiap hari/Hampir setiap hariJoint Study by MEWC and OUM 142
If NEVER, skip to Question 15.Jika TIDAK PERNAH, sila ke Soalan 15.10. Do you use a computer at work? (if applicable)Adakah anda menggunakan komputer di tempat kerja?ٱYes YaٱNo Tidak11. I use a computer for: (tick all that apply)Saya menggunakan komputer untuk: (tandakan semua yang berkenaan)ٱApplication software (e.g. word processing, spreadsheet, statistical analysis, database, presentations, computergames, graphics)Perisian aplikasi (contoh: pemprosesan perkataan,hamparan elektronik, analisis statistik, pangkalan data,pembentangan, permainan komputer, grafik)ٱE-mail E-melٱChatting/instant messaging Sembang-sembang/mesej segeraٱDownloading software Muat turun perisianٱDownloading music files Muat turun fail muzikٱNetwork games Permainan rangkaianٱFile sharing with friends & colleagues Perkongsian fail dengan kawan & rakan sekerjaٱBlog BlogٱE-discussion/E- forum/listservs/newsgroup E-diskusi/E- forum/listservs/newsgroupٱAcademic/training purposes Tujuan akademik/latihanٱOnline application Aplikasi dalam talianٱCourse registration Pendaftaran kursusٱCourse-related materials Bahan-bahan berkaitan kursusٱE-library E-perpustakaanٱInformation MaklumatٱCourse assignment Tugasan kursusٱResearch PenyelidikanٱOther (pls specify) Lain-lain(sila nyatakan):: _____________________________12. If you use the Internet, where do you access the Internet mostly from?Jika anda menggunakan Internet, tempat yang paling kerap anda mengaksesnya?ٱOnline shopping/online reservation/online banking, etc.Membeli belah dalam talian/tempahan dalamtalian/perbankan dalam talian, dll.ٱHome RumahٱCyber café Kafe siberٱSchool/college/university ٱWork place Sekolah/kolej/universitiTempat kerjaٱOther (pls specify) : Lain-lain (sila nyatakan): ________________________Joint Study by MEWC and OUM 143
13. Do you have Internet connection at home?Adakah anda mempunyai akses ke Internet dari rumah?ٱYes YaٱNo Tidak14. If YES (i.e. access the Internet from home), what connection to the Internet do you use?Jika YA (iaitu anda mengakses Internet dari rumah), yang manakah antara berikut anda gunakan?ٱDial-up DailٱStreamyx StreamyxٱISDN ISDNٱOther (pls specify) : ________________________ Lain-lain (sila nyatakan):15. Choose up to 4 of the following channels of communication that you most prefer:Pilih sehingga 4 saluran-saluran komunikasi berikut yang anda paling suka:ٱٱٱٱٱٱFace-to-faceBersemukaSMSSMSE-mailE-melChat on the InternetSembang-sembang di InternetWritten memoMemo bertulisPostal mailMel Pos16. Choose up to 4 of the following mode/media for <strong>learning</strong> that you most prefer:Pilih sehingga 4 mod/media pembelajaran berikut yang anda paling suka:ٱٱٱٱٱٱWritten (printed materials)Bahan bertulis/bercetakOnline materials (include e-books, e-journals and other web materials)Bahan dalam talian (termasuk e-buku, e-jurnal dan lain-lain bahan web)CD-ROM, DVD, other multimedia materialsCD-ROM, DVD, dan lain-lain bahan multimediaFace-to-faceBersemukaOnline conferencePersidangan dalam talianOnline lectures / tutorialsKuliah/tutoran dalam talian17. Several local E-<strong>learning</strong> websites (e.g. Utusan Education Portal, Kakaktua.com, and Cikgu.Net) are currentlyavailable. Would you prefer to have one single point of access to local E-<strong>learning</strong>content?Beberapa tapak web tempatan (contoh: Utusan Education Portal, Kakaktua.com, dan Cikgu.Net) sedia wujudbuat masa ini. Adakah anda lebih suka jika terdapat satu sahaja tapak web (one single point of access)untuk mendapat bahan e-pembelajaran tempatan?ٱYes YaٱNo TidakJoint Study by MEWC and OUM 144
SECTION BBAHAGIAN BInstruction: Please respond to the following.Arahan: Sila berikan respon anda kepada perkara-perkara berikut.A. Learner ReadinessKesediaan Pelajar/Peserta10. I am willing to make the time for E-<strong>learning</strong>.Saya bersedia memberikan masa untuk e-pembelajaran.11. I am able to manage my time for E-<strong>learning</strong>.Saya boleh menguruskan masa saya untuk e-pembelajaran.12. I can discipline myself to follow E-<strong>learning</strong> courses.Saya boleh mendisiplinkan diri untuk mengikuti kursus e-pembelajaran.13. My family is supportive of my study via E-<strong>learning</strong>.Keluarga menyokong usaha e-pembelajaran saya.14. To be a successful e-learner, I must have good interpersonal or social skills.Untuk menjadi e-pelajar yang berjaya, saya mesti mempunyai kemahiran peroranganatau kemahiran sosial yang baik.15. I am worried that qualifications obtained via E-<strong>learning</strong> will not be recognized.Saya risau kalau-kalau kelayakan yang diperolehi melalui e-pembelajaran itu tidakdiperakui.16. I am interested to upgrade my academic/professional qualification through E-<strong>learning</strong>.Saya berminat untuk meningkatkan kelayakan akademik/profesional saya menerusi e-pembelajaran.17. Will you grab the opportunity to engage in E-<strong>learning</strong>?Adakah anda akan mengambil peluang untuk mengikuti e-pembelajaran?18. Do you think you will be committed to E-<strong>learning</strong>?Adakah anda fikir yang anda akan komited kepada e-pembelajaran?19. One day, training for every job on earth will be available on the Internet.Satu hari nanti, latihan untuk setiap pekerjaan di bumi ini akan tersedia di Internet.(Answer the next three questions if you are employed):(Jika anda bekerja, sila jawab tiga soalan berikut:)20. My employer will give me the time off to study via E-<strong>learning</strong>.Majikan saya akan memberikan saya cuti (time off) untuk mengikuti pengajian melalui e-pembelajaran.21. My employer will let me use the facilities at work outside office hours for E-<strong>learning</strong>.Majikan saya akan membenarkan saya menggunakan kemudahan di tempat kerja diluar waktu pejabat untuk e-pembelajaran.22. I am interested to improve my work performance through E-<strong>learning</strong>.Saya berminat untuk memperbaiki prestasi kerja saya menerusi e-pembelajaran.23. On a scale of 1 to 10, how ready are you for E-<strong>learning</strong>?Pada skala 1 hingga 10, sejauh manakah anda bersedia untuk e-pembelajaran?YesYaYesYaNoTidakNoTidak1 2 3 4 5 6 7 8 9 10Not readyVery readyTidak bersediaSangat bersediaB. Content ReadinessKesediaan Kandungan13. There is a variety of E-<strong>learning</strong> materials for me to choose from.Terdapat pelbagai bahan e-pembelajaran untuk dipilih.14. Content for E-<strong>learning</strong> is available.Kandungan untuk e-pembelajaran tersedia ada.YesYaNoTidakJoint Study by MEWC and OUM 145
15. Content for E-<strong>learning</strong> is appropriate for my needs.Kandungan untuk e-pembelajaran sesuai bagi keperluan saya.16. Content for E-<strong>learning</strong> is useful.Kandungan untuk e-pembelajaran berguna bagi saya.17. Content for E-<strong>learning</strong> is meaningful.Kandungan untuk e-pembelajaran bermakna bagi saya.18. There is adequate online content support (e.g. library, tutorials, e-discussions)Terdapat sokongan yang mencukupi untuk kandungan dalam talian (Contoh: eperpustakaan, e-tutoran, e-diskusi)19. The course provides the opportunity for learners to discuss and work collaboratively onprojects.Kursus yang saya ikuti memberikan para pelajar peluang untuk berbincang danmenjalankan projek secara kolaboratif.20. On a scale of 1 to 10, how ready is the institution in terms of providing content for E-<strong>learning</strong>?Pada skala 1 hingga 10, sejauh manakah institusi ini bersedia dari segi kandungan e-pembelajaran?1 2 3 4 5 6 7 8 9 10Not readyVery readyTidak bersediaSangat bersediaC. Technical ReadinessKesediaan TeknikalYesYaNoTidak12. The institution where I study provides the necessary infrastructure for E-<strong>learning</strong>.Institusi tempat saya belajar menyediakan infrastruktur yang perlu untuk e-pembelajaran.13. Technical help is available for e-learners.Bantuan teknikal disediakan untuk e-pelajar.14. When requested, technical help has proven reliable.Apabila diminta, bantuan teknikal terbukti boleh diharapkan.15. I can overcome most of the technical problems myself.Saya sendiri boleh mengatasi kebanyakan masalah teknikal yang saya hadapi.16. The speed of E-<strong>learning</strong> content delivery is satisfactory.Kelajuan penghantaran kandungan e-pembelajaran adalah memuaskan.17. The institution where I study provides hands-on training to students of E-<strong>learning</strong>.Institusi tempat saya belajar menyediakan latihan amali (hands-on training) kepada e-pelajar.18. On a scale of 1 to 10, how ready is the institution technically (infrastructure, access, facilities, etc.) for E-<strong>learning</strong>?Pada skala 1 hingga 10, sejauh manakah institusi ini bersedia dari segi teknikal (infrastruktur,kemudahan, dll.) untuk e-pembelajaran?akses,1 2 3 4 5 6 7 8 9 10Not readyVery readyTidak bersediaSangat bersediaD. Environmental ReadinessKesediaan Persekitaran15. Government policies have made me interested in E-<strong>learning</strong>.Dasar Kerajaan telah membuatkan saya berminat dengan e-pembelajaran.16. Mass media has created public awareness in E-<strong>learning</strong>.Media massa telah menyedarkan orang ramai tentang e-pembelajaran.17. On a scale of 1 to 10, how ready is the society/nation for E-<strong>learning</strong>?Pada skala 1 hingga 10, sejauh manakah masyarakat/negara bersedia untuk e-pembelajaran?YesYaNoTidak1 2 3 4 5 6 7 8 9 10Not readyVery readyTidak bersediaSangat bersediaJoint Study by MEWC and OUM 146
E. Cultural ReadinessKesediaan BudayaYesYaNoTidak9. The most effective method of <strong>learning</strong> is face-to-face.Kaedah pembelajaran paling berkesan ialah kaedah bersemuka.10. The teacher is still the best information provider.Guru masih merupakan pembekal maklumat yang terbaik.11. Discussions via the Internet make <strong>learning</strong> more meaningful.Perbincangan melalui Internet menjadikan pembelajaran lebih bermakna.12. When using technology for e-<strong>learning</strong>, the personal touch is important in the <strong>learning</strong>process.Bila menggunakan teknologi untuk e-pembelajaran, saya menganggap sentuhanperibadi (personal touch) masih penting dalam proses pembelajaran.13. E-<strong>learning</strong>is an efficient means of disseminating information.E-pembelajaran ialah cara yang cekap/efisien untuk menyebarkan maklumat.14. E-<strong>learning</strong>is an advanced mode/stage in teaching and <strong>learning</strong>.E-pembelajaran ialah mod/tahap pengajaran dan pembelajaran yang terkehadapan.15. On a scale of 1 to 10, how ready is the institution in using E-<strong>learning</strong> for teaching and <strong>learning</strong>?Pada skala 1 hingga 10, sejauh manakah institusi ini bersedia menggunakan e-pembelajaran untuk pengajarandan pembelajaran?1 2 3 4 5 6 7 8 9 10Not readyVery readyTidak bersediaSangat bersediaF. Financial ReadinessKesediaan Kewangan16. I am willing to buy a computer for E-<strong>learning</strong> purposes.Saya bersedia membeli komputer untuk tujuan e-pembelajaran.17. I am willing to spend on Internet connection for E-<strong>learning</strong> purposes.Saya sedia berbelanja bagi mendapatkan hubungan Internet untuk tujuan e-pembelajaran.18. I have taken a loan to buy a computer for E-<strong>learning</strong> purposes.Saya telah mengambil pinjaman untuk membeli komputer untuk tujuan e-pembelajaran.19. I can afford to buy a computer and pay for Internet access.Saya mampu membeli komputer dan membayar kos mengakses Internet.20. On a scale of 1 to 10, how ready are you to spend on E-<strong>learning</strong>?Pada skala 1 hingga 10, sejauh manakah anda bersedia mengeluarkan belanja untuk e-pembelajaran?YesYaNoTidak1 2 3 4 5 6 7 8 9 10Not readyVery readyTidak bersediaSangat bersediaG. Other Comments (Your other opinions, perceptions and suggestions relating to E-<strong>learning</strong> are appreciated)Lain-lain Komen (Lain-lain pendapat, persepsi dan cadangan anda berkaitan e-pembelajaran adalah dihargai)____________________________________________________________________________________________________________________________________________________________________________________________________________________________________________________________________________________________________________________________________________________________________________________________________________________________________________________________________________________________________________________________________________________________________________________________________________Joint Study by MEWC and OUM 147
Appendix JBiodata of the Working Group MembersJoint Study by MECW and OUM 148
Professor Dr Abu Talib OthmanProfessor Dr Abu Talib Othman has 24 years experience in the ICTindustry, formerly the Director of Computer Center, <strong>University</strong> Putra<strong>Malaysia</strong> (UPM), Dean of School of Information Technology, <strong>University</strong>Utara <strong>Malaysia</strong> (UUM) and Director of Computer Center, UniversitiPendidikan Sultan Idris (UPSI). He is currently Dean, Institute of InfotechMara, <strong>University</strong> Kuala Lumpur. His vast experience in ICT consultancyworks includes setting up new faculty ICT infrastructure for the UPM,UUM, Kolej Universiti Islam <strong>Malaysia</strong>, Nilai (KUIM), Legenda CollegeLangkawi, Kolej Darulaman Multimedia, <strong>University</strong> Technology MARA,and the computerisation of the International Islamic <strong>University</strong>. He wasinvolved with the EIS Project for Ministry of Agriculture, ICT solution for<strong>University</strong> <strong>Malaysia</strong> Sabah, Consultant for Origin Technology Sdn Bhd,Consultant for IQNet Sdn Bhd, Consultant for UPEN Kedah andConsultant for Putrajaya IT Master Plan. He was CEO at Lagenda CollegeLangkawi, Kolej Darulaman Multimedia and Process Manager for theElectronic Government Project. He obtained his Ph.D in Computer Sciencefrom <strong>University</strong> of Bradford, UK (1988), Master of Science in ControlEngineering from <strong>University</strong> of Bradford, UK (1980) and a Bachelor ofScience (Hons) from Universiti Kebangsaan <strong>Malaysia</strong> (1979).Chng Loi PengChng Loi Peng is a lecturer at the Faculty of Science and FoundationStudies, <strong>Open</strong> <strong>University</strong> <strong>Malaysia</strong>. He is one of the many pioneer staffswho witnessed the growth and success of the <strong>University</strong>. He attended hisearly education at St. Paul Institution, Seremban. He obtained hisBachelor of Science and Master of Science from <strong>University</strong> Putra <strong>Malaysia</strong>.His interests are in the field of agricultural sciences, soil science andenvironmental science. He plans to further his education in the field ofenvironmental science and bioremediation.Fitri Suraya MohamadFitri Suraya Mohamad is a lecturer at the Faculty of Cognitive Sciencesand Human Development at Universiti <strong>Malaysia</strong> Sarawak (UNIMAS),Kota Samarahan, Sarawak. She studied TESL at Universiti Putra <strong>Malaysia</strong>(UPM) at baccalaureate level, and at The Pennsylvania State <strong>University</strong>,USA, at Masters level. Fitri has been involved in E-<strong>learning</strong> since the firstworking group was created by NITC in 1998 (STIC on E-<strong>learning</strong>), whenE-<strong>learning</strong> was still an undefined phenomenon in the field of <strong>learning</strong>technologies in <strong>Malaysia</strong>. At UNIMAS, Fitri is responsible for the E-<strong>learning</strong> developments on campus, which include the training ofacademics who wish to supplement their classroom instruction with E-<strong>learning</strong>. She heads a team taking care of all E-<strong>learning</strong> issues on campus.Fitri writes and presents papers actively at local and international forums.She has published more than twenty papers and book chapters centeringon issues related to Instructional Technology and Teacher Education.Joint Study by MECW and OUM 149
Currently Fitri is on study leave at <strong>University</strong> of London, UnitedKingdom, pursuing her doctorial studies at the Institute of Education.Associate Professor Dr Halimah AwangDr Halimah Awang is an Associate Professor and Head of theDepartment of Administrative Studies and Politics, Faculty of Economicsand Administration (FEA), <strong>University</strong> of Malaya. Dr Halimah Awangstudied at Northern Illinois <strong>University</strong>, USA and obtained her Bachelor ofScience in Applied Mathematics in 1977 and Master of Science in AppliedProbability and Statistics in 1978. She later obtained a PhD in AppliedStatistics from Macquarie <strong>University</strong>, Australia in 1998. She was a lecturerat the Department of Applied Statistics, FEA from 1985 to 2000. Thecourses she has taught include research methodology, managementtechniques, quantitative analysis and statistical data analysis both at theundergraduate and postgraduate levels.Dr Halimah has undertaken a number of research projects sponsored byIRPA, United Nations Fund for Population Activities, the Ministry ofNational Unity and Social Development, the National Population andFamily Development Board and the <strong>University</strong> of Malaya. Her researchcovers a wide range of topics including demography, biostatistics, genderand Information Technology, and socio-economic studies.Associate Professor Dr Kuldip KaurDr Kuldip Kaur is an Associate Professor at the Faculty of Education, Artsand Social Sciences at the <strong>Open</strong> <strong>University</strong> <strong>Malaysia</strong>. She was previouslyAssociate Professor at the Department of Languages and LiteracyEducation at the Faculty of Education, <strong>University</strong> of Malaya. Dr Kuldipreceived a doctorate in education (Ph. D.) in English Education fromSyracuse <strong>University</strong> in 1991. She has researched widely and haspublished several chapters and articles on teaching-<strong>learning</strong> methodologyand online <strong>learning</strong>. Dr Kuldip is also the Chief Editor of The EnglishTeacher, a Journal of the <strong>Malaysia</strong>n English Language TeachingAssociation, and is a member of the <strong>Asia</strong> TEFL Council.Associate Professor Dr Latifah Abdol LatifDr Latifah Abdol Latif joined OUM in 2002 as an Associate Professor inthe Faculty of Science and Foundation Studies, <strong>Open</strong> <strong>University</strong> <strong>Malaysia</strong>and Director of Centre of Student Affairs, from 1 st July 2003. She hasserved as a Chemistry tutor at the Pusat Asasi Sains, <strong>University</strong> of Malayain 1980. Four years during the tenure as a tutor, she obtained her PhD inthe area of Organometallic Chemistry (<strong>University</strong> of Sussex, Brighton,UK) and held a lecturer post from 1984 to 1995. She was appointed theHead of Chemistry Division in 1987, and later in 1995 as an AssociateProfessor. Between 1992 and 1996 she was again appointed the Head ofChemistry Division, and was later appointed the Deputy Director, CentreJoint Study by MEWC and OUM 150
of Foundation Studies in Science from 1996-1998. In 1997, she wasawarded the British High Commissioner’s Chevening Awards Scheme:Royal Society <strong>Malaysia</strong>n Fellowship 1997/98, to undertake a 9-monthsresearch in the area of Transition Metal Chemistry/ OrganometallicChemistry at the <strong>University</strong> of Wales, Bangor, UK. She published 6 majorpapers in the area of Organometallic Chemistry out of the work carriedout in Wales. In 2001, Dr Latifah was awarded the American FulbrightFellowship, to carry out a joint research at the Chemistry Department,<strong>University</strong> of North Carolina, USA (Forgo the offer to accept the offerfrom OUM). She has published nearly 40 papers in refereed journals,proceedings, reports and books and has been very active in manyconferences and seminars in the area of Chemistry locally andinternationally. She is active in research, particularly on the studentretention at OUM.Norhaizan Mat TalhaNorhaizan Mat Talha has been a researcher in MIMOS Berhad for the lasteleven years. Her area of research includes fiber optics, AsynchronousTransfer Mode (ATM), Network Management, <strong>Open</strong> source and the latest,metadata for web resources and <strong>learning</strong> object. She is now in charge ofcontent acquisition and aggregation for the <strong>Malaysia</strong>n Grid for Learningportal. She graduated from <strong>University</strong> College of Swansea, Wales with anhonours degree in Physics with Laser Physics.Dr Norizan Abdul RazakDr Norizan Abdul Razak is a lecturer at School of Language Studies andLinguistics, Faculty of Social Sciences and Humanities, UniversitiKebangsaan <strong>Malaysia</strong>. She holds a Bachelor of Arts from Western Illinois<strong>University</strong> and later received her Master of Arts in TESOL from<strong>University</strong> of Northern Iowa. She attained her doctoral degree inComputer in Education from Universiti Kebangsaan <strong>Malaysia</strong>. She haspublished articles related to CALL and E-<strong>learning</strong> in international andnational journal and her publications include a book on ComputerAssisted Language Learning: Some Pedagogical Issues (1998). Currentlyshe is the executive editor of Internet Journal of E-Language Learning andTeaching. Her research interests are in CALL, ICT competency standardsand online testing. She is one of the team members who conceptualizedand developed the online computer competency test for UKM and onlineEnglish language test for UKM academic and support staff.Dr Norrizan RazaliDr Norrizan Razali heads the Smart School Flagship at the MultimediaDevelopment Cooperation under the Multimedia Super Corridor Project.As a Senior Manager for the Smart School Flagship, she was involved incoordinating and monitoring the implementation of the smart school pilotJoint Study by MEWC and OUM 151
project. Currently, her focus is to ensure successful expansion of theSmart School across <strong>Malaysia</strong>. The emphasis of her work is also on theinnovation of the delivery of education process utilizing ICT. Herresponsibilities also include assessing new technologies for education andproviding the educational input for integration of technologies ineducation. Dr Norrizan holds a Ph.D in education from the <strong>University</strong> ofPennsylvania, USA.Dr Norrizan also has a vast experience in implementing the smart schoolconcept in Laos, Myanmar and Syria. She has played various key roles inspecial groups looking into the different areas of e-<strong>learning</strong> developmentin <strong>Malaysia</strong> and overseas.Prior to joining the Multimedia Development Corporation, Dr Norrizanhad worked with the Institute of Strategic and International Studies (ISIS)<strong>Malaysia</strong> where she was responsible for policy research and consultancyin the area of education. At ISIS, Dr Norrizan managed and conducted anumber of large-scale technical education projects funded by the WorldBank and <strong>Asia</strong>n Development Bank for the Ministry of Education. Priorto ISIS, she was with the Faculty of Education, National <strong>University</strong> of<strong>Malaysia</strong>Professor Dr Nuraihan Mat DaudDr Nuraihan Mat Daud is a Professor at the Department of EnglishLanguage and Literature, International Islamic <strong>University</strong> <strong>Malaysia</strong>. Sheis currently the Deputy Dean of Academic Affairs, Human Science,Kulliyyah of Revealed Knowledge and Human Sciences. She obtained herfirst degree in 1986 from Monash <strong>University</strong>, Australia in Linguistics,second degree in 1988 from Aston <strong>University</strong> in Teaching English forSpecific Purposes and her PhD in 1995 from the <strong>University</strong> of Hull, UK inEducation (specializing in Computer-Assisted Language Learning). Herresearch interests include computer-assisted language <strong>learning</strong>, teachingEnglish for specific purposes and second language <strong>learning</strong>. She teachescomputer related courses at the Department at both the undergraduateand postgraduate levels. She is also supervising Master and PhD studentsin the same area. She has presented academic papers at both national andinternational conferences and published numerous articles in local andinternational refereed journals. She has also a few books to her name.Associate Professor Dr Rahmah HashimDr Rahmah Hashim is currently an Associate Professor at the Faculty ofInformation Technology and Multimedia Communication, <strong>Open</strong><strong>University</strong> <strong>Malaysia</strong>. Prior to that, she was a faculty member at theDepartment of Communication, Faculty of Social Science and Humanities,Universiti Kebangsaan <strong>Malaysia</strong> (UKM) since 1982. She has held theoffice of Deputy Dean (Administration), Faculty of Social Science andHumanities, UKM, between November 1991-November 1993, and HeadJoint Study by MEWC and OUM 152
of the Communication Department, UKM, between October 1998 toSeptember 2000. She graduated with a Bachelor of Arts (Hons)(Communication) from Universiti Kebangsaan <strong>Malaysia</strong> (1980), Master ofScience (Instructional Media Technology), Central Missouri State<strong>University</strong>, USA (1982), and Ph.D. (Telecommunication) from the OhioState <strong>University</strong>, Columbus, USA (1989). Before her tertiary education, DrRahmah underwent teacher training at the Temenggong IbrahimTeachers’ College, Johor Bahru (1965-1966) and the Specialist TeacherTraining Institute (Education of the Blind) in Kuala Lumpur (1973).She has presented conference papers in <strong>Malaysia</strong>, Singapore, Thailand,the Philippines, Korea, South Africa and Belgium. To date, she hascontributed chapters in a number of books and published monographsboth locally and internationally. Her research focus includes ICT and itsimpact on the people’s quality of life. A number of research projects havealso been conducted for UKM, and organisations such as the <strong>Asia</strong>n Media,Information and Communication Centre (AMIC) Singapore, <strong>Asia</strong>nInstitute for Development Communication (AIDCOM), UNESCO, andKOMTECH, Germany.Associate Professor Dr Raja Maznah Raja HussainDr Raja Maznah Raja Hussain is an Associate Professor and Head of theDepartment of Curriculum and Instructional Technology, at the Faculty ofEducation, <strong>University</strong> of Malaya. She was the Director of UMLIC(<strong>University</strong> of Malaya Learning Development Center) from 1996 to 2000.Dr. Raja Maznah has a Ph. D. in the field of Instructional SystemsTechnology from Indiana <strong>University</strong>. Her area of specialization isInstructional Design and Training. She has presented papers andconducted workshops for Higher Education Institutions andorganisations in the areas of Instructional Design, Course Development,Presentation Skills, Management of Technology-Based Learning, andLearning Organisation.She was a Visiting Professor at the Florida State <strong>University</strong> in 1995 in theSchool Year 2000 project, a project to restructure schools using technology.She spent her sabbatical in 2000 at the Multimedia <strong>University</strong> as a VisitingProfessor responsible for developing Instructional Design Guideline forthe Multimedia Learning System (MMLS). She was an InstructionalDesigner Consultant to UNITEM in the Content Development project in2001-2002. She was a lead researcher and Instructional Designer forINSTEP in their eLearning project in 2001. She believes that <strong>learning</strong> is atool for success and that it is important to share your ideas and what youhave learned with others.Joint Study by MEWC and OUM 153
Rohani IsmailRohani Ismail has graduated from the Australian National <strong>University</strong>with a bachelor degree in Computer Science. She is now the Manager fore-Learning Technology department with focus in research anddevelopment in the said area. She has over 14 years of workingexperience in the field of application development and projectmanagement.Sulaiman SarkawiSulaiman Sarkawi is a lecturer at the ICT Faculty of Universiti PendidikanSultan Idris. He graduated with Masters in Education in the field ofComputer in Education from the <strong>University</strong> of Malaya. His workexperience includes being a secondary school teacher (1986 to 1990),research officer for the Ministry of Education–MIMOS Project (1990 to1991), coordinator for the same project, and IT lecturer at a teachingcollege. He was a trainer for Education Center of Smart School and hedeveloped a generic module for skills in smart schools. He attended ashort course on smart school at Simon Fraser <strong>University</strong>, Vancouver,Canada. He also wrote Amali ToolBook II Assistant 8.8: Langkah Mudah danCepat, a book printed by Universiti Pendidikan Sultan Idris. His researchin e-<strong>learning</strong> involves The Readiness of Teachers in using Education Web(2001), and The Important Elements in Education Portal (2004).Professor Dr Szarina AbdullahProfessor Dr Szarina Abdullah is a lecturer at the Faculty of InformationStudies, Universiti Teknologi MARA, Shah Alam. She obtained her PhDin Information Science from <strong>University</strong> of Illinois (Urbana-Champaign)and MSc in Library and Information Science from <strong>University</strong> of Hawaii(Honolulu). She has a vast experience in teaching, research andconsultation in the area of Bibliometrics, Distance Education, E-<strong>learning</strong>,Information Management, Knowledge Management, Library Managemen andResearch Methodology. Dr Szarina was the Head of Research in theBibliometrics Special Interest Group, UiTM and successfully completed theNational Study on Knowledge Productivity in the field of Science andTechnology in <strong>Malaysia</strong> for the Ministry of Science, Technology andInnovation in August 2004. Another ongoing research project is theInformation Literacy Rate Survey Among the <strong>University</strong> Graduates in <strong>Malaysia</strong>.Administratively, she was Program Leader, Head of Research, Dean at theFaculty of Library and Information Science, Dean of Learning Centre,Assistant Academic Director and Assistant Vice-Chancellor of DistanceEducation. She introduced the E-Learning programme at UniversitiTeknologi MARA in 1998. She is currently the President of the <strong>Malaysia</strong>nAssociation of Distance Education from 2000 to 2004.Joint Study by MEWC and OUM 154
Tengku Putri Norishah Tengku SharimanTengku Putri Norishah Tengku Shariman currently heads the e-<strong>learning</strong>content development Unit and lectures pedagogy courses in the Mastersof Multimedia (e-<strong>learning</strong> Technologies) programme, offered by theFaculty of Creative Multimedia. She is a graduate of Indiana <strong>University</strong>,USA specializing in Computer Assisted Learning. She has been anInstructional Designer in Multimedia <strong>University</strong> for the past six years,working on content development projects for both internal and externalclients. As a member of the National e-<strong>learning</strong> Consultative Council, shehopes to further contribute towards the advancement of e-<strong>learning</strong>research and development in <strong>Malaysia</strong>. She is currently writing her Phdresearch on On-line Collaborative Learning at the Graduate School ofEducation, Bristol <strong>University</strong>, United Kingdom.Dr Tina Lim Swee KimDr Tina Lim Swee Kim is currently the Head of Research Unit at the IpohTeacher Training College. She received her primary education at ConventGreen Lane Primary School, Penang and her secondary education atConvent Green Lane Secondary School, Penang. After which, shecontinued her Sixth Form at St. Xavier’s Institution, Penang. She obtainedher basic degree that is, Bachelor of Science with Education (Honours)from Universiti Malaya, Kuala Lumpur in 1985. The following year, sheattended the Conversion Course for Science and Mathematics graduateteachers at the Language Institute, Kuala Lumpur and was accorded acertificate in TESL. In 1996, she obtained her Master in Education(specializing in Curriculum and Instruction) from the <strong>University</strong> ofHouston, USA. Following that in 2003, she obtained her PhD fromUniversiti Sains <strong>Malaysia</strong>, Penang. Dr Tina Lim served as a teacher in SriAman and Kuching, Sarawak, as well as in Ipoh, from 1986 through 1995.The subjects she has taught include Biology, Mathematics, AdditionalMathematics and English. In 1996, she joined the Ipoh Teacher TrainingCollege and served as a lecturer in the Science and MathematicsDepartment. In the year 2003, she joined the Research and DevelopmentDepartment and heads the Research Unit.Associate Professor Dr Zoraini Wati AbasDr Zoraini Wati Abas has been attached to the Faculty of Education, Artsand Social Sciences at the <strong>Open</strong> <strong>University</strong> <strong>Malaysia</strong> since 2004 andcurrently serves as Director, Center for Instructional Design andTechnology. She received a doctorate in education (Ed. D.) inInstructional Technology from Northern Illinois <strong>University</strong> in 1985. Priorto joining <strong>Open</strong> <strong>University</strong> <strong>Malaysia</strong>, she was the Director of the Centrefor E-Learning and Multimedia at the International Medical <strong>University</strong>where she developed OLIS (On-line Learning Instentive System) formedical students.Joint Study by MEWC and OUM 155
Prior to that, she was a Curriculum Officer at the MARA SecondaryEducation Division. She also served as Executive Director, GlobalLearning Corporation (<strong>Malaysia</strong>) Sdn Bhd and as Associate Professor atthe Faculty of Education, <strong>University</strong> of Malaya. She was also consultantto an ADB project and had developed an IT Plan for the TechnicalEducation Department. Among her publications include several booksand dictionaries on computers and computer education and haspublished more than 700 articles to promote computers and the Internetin magazines and newspapers. In 1996, she conceptualized TM SchoolOnline, an Internet-based project funded by Telekom <strong>Malaysia</strong>, the firstWeb-based education portal for primary and secondary students as wellas teachers. She is currently the President of the South East <strong>Asia</strong>nAssociation for Institutional Research SEAAIR). She also serves as acommittee member of the International Federation of InformationProcessing (IFIP) – Working Group 3.1.Joint Study by MEWC and OUM 156