Unit 5 Review # 2
Unit 5 Review # 2
Unit 5 Review # 2
- No tags were found...

You also want an ePaper? Increase the reach of your titles
YUMPU automatically turns print PDFs into web optimized ePapers that Google loves.
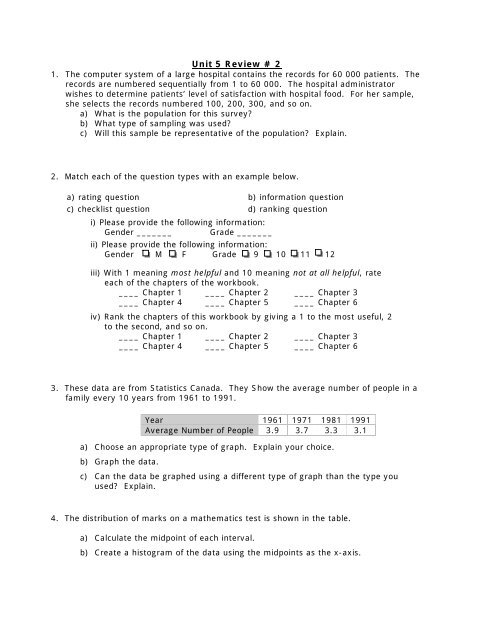
<strong>Unit</strong> 5 <strong>Review</strong> # 21. The computer system of a large hospital contains the records for 60 000 patients. Therecords are numbered sequentially from 1 to 60 000. The hospital administratorwishes to determine patients’ level of satisfaction with hospital food. For her sample,she selects the records numbered 100, 200, 300, and so on.a) What is the population for this survey?b) What type of sampling was used?c) Will this sample be representative of the population? Explain.2. Match each of the question types with an example below.a) rating question b) information questionc) checklist question d) ranking questioni) Please provide the following information:Gender _______ Grade _______ii) Please provide the following information:Gender M F Grade 9 10 11 12iii) With 1 meaning most helpful and 10 meaning not at all helpful, rateeach of the chapters of the workbook.____ Chapter 1 ____ Chapter 2 ____ Chapter 3____ Chapter 4 ____ Chapter 5 ____ Chapter 6iv) Rank the chapters of this workbook by giving a 1 to the most useful, 2to the second, and so on.____ Chapter 1 ____ Chapter 2 ____ Chapter 3____ Chapter 4 ____ Chapter 5 ____ Chapter 63. These data are from Statistics Canada. They Show the average number of people in afamily every 10 years from 1961 to 1991.Year 1961 1971 1981 1991Average Number of People 3.9 3.7 3.3 3.1a) Choose an appropriate type of graph. Explain your choice.b) Graph the data.c) Can the data be graphed using a different type of graph than the type youused? Explain.4. The distribution of marks on a mathematics test is shown in the table.a) Calculate the midpoint of each interval.b) Create a histogram of the data using the midpoints as the x-axis.
5. These data represent the lengths, in centimetres, of different pieces of string.80, 25, 35, 25, 45, 35, 35, 25, 25, 35a) Determine the mean, median and mode lengths.b) Determine the standard deviation6. The nurses’ union collects data on the hours worked by operating-room nurses at theStatsville General Hospital.a) Determine the mean, and standard deviation for these data.Hours PerWeekNumber ofEmployees12 132 535 738 842 5b) Determine the median, interquartile range, and semi-interquartilerange.