The Computational Materials Repository
The Computational Materials Repository
The Computational Materials Repository
- No tags were found...

Create successful ePaper yourself
Turn your PDF publications into a flip-book with our unique Google optimized e-Paper software.
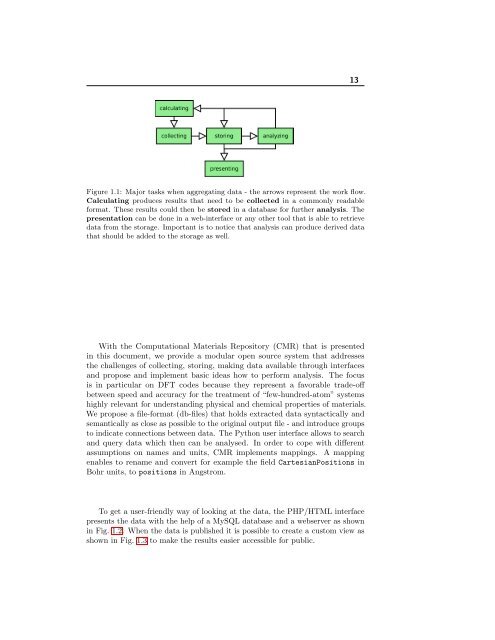
13Figure 1.1: Major tasks when aggregating data - the arrows represent the work flow.Calculating produces results that need to be collected in a commonly readableformat. <strong>The</strong>se results could then be stored in a database for further analysis. <strong>The</strong>presentation can be done in a web-interface or any other tool that is able to retrievedata from the storage. Important is to notice that analysis can produce derived datathat should be added to the storage as well.With the <strong>Computational</strong> <strong>Materials</strong> <strong>Repository</strong> (CMR) that is presentedin this document, we provide a modular open source system that addressesthe challenges of collecting, storing, making data available through interfacesand propose and implement basic ideas how to perform analysis. <strong>The</strong> focusis in particular on DFT codes because they represent a favorable trade-offbetween speed and accuracy for the treatment of “few-hundred-atom” systemshighly relevant for understanding physical and chemical properties of materials.We propose a file-format (db-files) that holds extracted data syntactically andsemantically as close as possible to the original output file - and introduce groupsto indicate connections between data. <strong>The</strong> Python user interface allows to searchand query data which then can be analysed. In order to cope with differentassumptions on names and units, CMR implements mappings. A mappingenables to rename and convert for example the field CartesianPositions inBohr units, to positions in Angstrom.To get a user-friendly way of looking at the data, the PHP/HTML interfacepresents the data with the help of a MySQL database and a webserver as shownin Fig. 1.2. When the data is published it is possible to create a custom view asshown in Fig. 1.3 to make the results easier accessible for public.