An Economic Analysis of GRDC's Investment in the Functional ...
An Economic Analysis of GRDC's Investment in the Functional ...
An Economic Analysis of GRDC's Investment in the Functional ...
- No tags were found...

You also want an ePaper? Increase the reach of your titles
YUMPU automatically turns print PDFs into web optimized ePapers that Google loves.
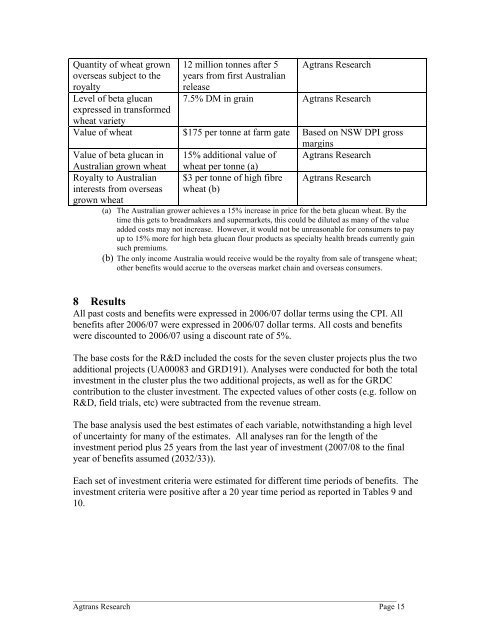
Quantity <strong>of</strong> wheat grownoverseas subject to <strong>the</strong>royaltyLevel <strong>of</strong> beta glucanexpressed <strong>in</strong> transformedwheat variety12 million tonnes after 5 Agtrans Researchyears from first Australianrelease7.5% DM <strong>in</strong> gra<strong>in</strong> Agtrans ResearchValue <strong>of</strong> wheat $175 per tonne at farm gate Based on NSW DPI grossmarg<strong>in</strong>sValue <strong>of</strong> beta glucan <strong>in</strong> 15% additional value <strong>of</strong> Agtrans ResearchAustralian grown wheat wheat per tonne (a)Royalty to Australian<strong>in</strong>terests from overseasgrown wheat$3 per tonne <strong>of</strong> high fibrewheat (b)Agtrans Research(a) The Australian grower achieves a 15% <strong>in</strong>crease <strong>in</strong> price for <strong>the</strong> beta glucan wheat. By <strong>the</strong>time this gets to breadmakers and supermarkets, this could be diluted as many <strong>of</strong> <strong>the</strong> valueadded costs may not <strong>in</strong>crease. However, it would not be unreasonable for consumers to payup to 15% more for high beta glucan flour products as specialty health breads currently ga<strong>in</strong>such premiums.(b) The only <strong>in</strong>come Australia would receive would be <strong>the</strong> royalty from sale <strong>of</strong> transgene wheat;o<strong>the</strong>r benefits would accrue to <strong>the</strong> overseas market cha<strong>in</strong> and overseas consumers.8 ResultsAll past costs and benefits were expressed <strong>in</strong> 2006/07 dollar terms us<strong>in</strong>g <strong>the</strong> CPI. Allbenefits after 2006/07 were expressed <strong>in</strong> 2006/07 dollar terms. All costs and benefitswere discounted to 2006/07 us<strong>in</strong>g a discount rate <strong>of</strong> 5%.The base costs for <strong>the</strong> R&D <strong>in</strong>cluded <strong>the</strong> costs for <strong>the</strong> seven cluster projects plus <strong>the</strong> twoadditional projects (UA00083 and GRD191). <strong>An</strong>alyses were conducted for both <strong>the</strong> total<strong>in</strong>vestment <strong>in</strong> <strong>the</strong> cluster plus <strong>the</strong> two additional projects, as well as for <strong>the</strong> GRDCcontribution to <strong>the</strong> cluster <strong>in</strong>vestment. The expected values <strong>of</strong> o<strong>the</strong>r costs (e.g. follow onR&D, field trials, etc) were subtracted from <strong>the</strong> revenue stream.The base analysis used <strong>the</strong> best estimates <strong>of</strong> each variable, notwithstand<strong>in</strong>g a high level<strong>of</strong> uncerta<strong>in</strong>ty for many <strong>of</strong> <strong>the</strong> estimates. All analyses ran for <strong>the</strong> length <strong>of</strong> <strong>the</strong><strong>in</strong>vestment period plus 25 years from <strong>the</strong> last year <strong>of</strong> <strong>in</strong>vestment (2007/08 to <strong>the</strong> f<strong>in</strong>alyear <strong>of</strong> benefits assumed (2032/33)).Each set <strong>of</strong> <strong>in</strong>vestment criteria were estimated for different time periods <strong>of</strong> benefits. The<strong>in</strong>vestment criteria were positive after a 20 year time period as reported <strong>in</strong> Tables 9 and10.________________________________________________________________________________Agtrans Research Page 15