High Resolution Analysis of Crime Patterns in Urban Street Networks
High Resolution Analysis of Crime Patterns in Urban Street Networks
High Resolution Analysis of Crime Patterns in Urban Street Networks

Create successful ePaper yourself
Turn your PDF publications into a flip-book with our unique Google optimized e-Paper software.
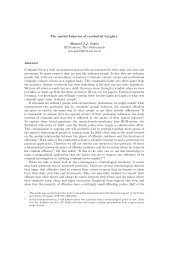
464 B. Hillier and O. SahbazFigure 226: segment connectivity and b: Global <strong>in</strong>tegration <strong>in</strong> primary risk bands.There are two possible <strong>in</strong>terpretations <strong>of</strong> this. The first is natural surveillance: thatmore ‘l<strong>in</strong>e neighbours’ <strong>in</strong> your home segment provide <strong>in</strong>creased surveillance, and that thisdeters burglars. The second is complementary to the f<strong>in</strong>d<strong>in</strong>g <strong>of</strong> Bowers (Bowers, Johnsonand Pease 2004) that the occurrence <strong>of</strong> a burglary <strong>in</strong> a location <strong>in</strong>creases the probability<strong>of</strong> further burglaries <strong>in</strong> the vic<strong>in</strong>ity <strong>of</strong> the first. If there were an upper limit to this process,then after a certa<strong>in</strong> number <strong>of</strong> burglaries <strong>in</strong> a location, the location is seen as saturatedand the risks <strong>in</strong>creased, so the burglar moves on. This would raise <strong>in</strong>terest<strong>in</strong>g psychologicalquestions as to how burglars identify ‘locations’ with<strong>in</strong> which to select a target. The streetsegment is a natural locational unit <strong>in</strong> the same sense that a street is. Any upper limitto how frequently a burglar saw it as good sense to select targets <strong>in</strong> the same ‘location’,however def<strong>in</strong>ed, would imply greater ‘safety <strong>in</strong> numbers’ <strong>in</strong> that location. This f<strong>in</strong>d<strong>in</strong>gsuggests that burglars may identify street segments are locations.Whichever <strong>in</strong>terpretation is the case, it means that <strong>in</strong> an important sense, hav<strong>in</strong>g moreneighbours helps to keep you safe. The first consequence <strong>of</strong> adopt<strong>in</strong>g the primary risk bandapproach, then, is to br<strong>in</strong>g to light a fundamental regularity <strong>in</strong> the spatial distribution <strong>of</strong>crime whose existence has been suspected before, but never demonstrated. On this basis,we can then explore the relation <strong>of</strong> this regularity to other spatial properties. For example,we already know that segment connectivity is found on both short and long segments. Ifwe plot this for the primary risk bands (form left to right on the horizontal axis as before)f<strong>in</strong>d that there is high connectivity with few residences per segment, which falls to a low <strong>in</strong>mid-range, and then rises to high connectivity aga<strong>in</strong> for high residence segments. Figure226 shows that the high connectivity segments are to be found both <strong>in</strong> the high streetareas, where there are few dwell<strong>in</strong>gs because most units are non-residential and burglaryrates are among the highest, and <strong>in</strong> some <strong>of</strong> the more <strong>in</strong>tegrated and grid like hous<strong>in</strong>gareas, where burglary rates are among the lowest.We f<strong>in</strong>d Figure 226a above an even more strik<strong>in</strong>g fall and rise with global <strong>in</strong>tegration.This shows that although on average for the whole system segments with burglary are moreglobally <strong>in</strong>tegrated than those without, this average conceals a bifurcation <strong>in</strong> the data.Both high and low burglary rates are associated with <strong>in</strong>tegration; high <strong>in</strong> the <strong>in</strong>tegratedhigh street areas where there are few residential neighbours, and low <strong>in</strong> the <strong>in</strong>tegratedresidential areas, where there are many l<strong>in</strong>e neighbours. This bifurcation can be showngraphically by a regression plot <strong>of</strong> <strong>in</strong>tegration aga<strong>in</strong>st the true burglary rate for the primaryrisk bands as <strong>in</strong> Figure 227 below:If we split the bands more or less evenly between the lower and higher residencebands and plot them separately (Figure 228a and 228b) we f<strong>in</strong>d that while for the low