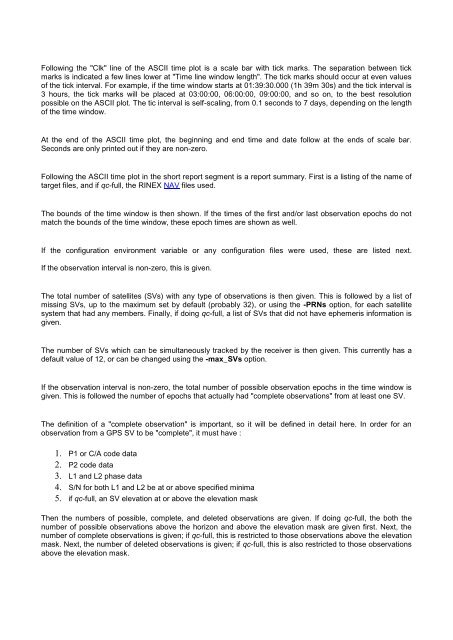
Following the "Clk" line of the ASCII time plot is a scale bar with tick marks. The separation between tickmarks is indicated a few lines lower at "Time line window length". The tick marks should occur at even valuesof the tick interval. For example, if the time window starts at 01:39:30.000 (1h 39m 30s) and the tick interval is3 hours, the tick marks will be placed at 03:00:00, 06:00:00, 09:00:00, and so on, to the best resolutionpossible on the ASCII plot. The tic interval is self-scaling, from 0.1 seconds to 7 days, depending on the lengthof the time window.At the end of the ASCII time plot, the beginning and end time and date follow at the ends of scale bar.Seconds are only printed out if they are non-zero.Following the ASCII time plot in the short report segment is a report summary. First is a listing of the name oftarget files, and if <strong>qc</strong>-full, the RINEX NAV files used.The bounds of the time window is then shown. If the times of the first and/or last observation epochs do notmatch the bounds of the time window, these epoch times are shown as well.If the configuration environment variable or any configuration files were used, these are listed next.If the observation interval is non-zero, this is given.The total number of satellites (SVs) with any type of observations is then given. This is followed by a list ofmissing SVs, up to the maximum set by default (probably 32), or using the -PRNs option, for each satellitesystem that had any members. Finally, if doing <strong>qc</strong>-full, a list of SVs that did not have ephemeris information isgiven.The number of SVs which can be simultaneously tracked by the receiver is then given. This currently has adefault value of 12, or can be changed using the -max_SVs option.If the observation interval is non-zero, the total number of possible observation epochs in the time window isgiven. This is followed the number of epochs that actually had "complete observations" from at least one SV.The definition of a "complete observation" is important, so it will be defined in detail here. In order for anobservation from a GPS SV to be "complete", it must have :1. P1 or C/A code data2. P2 code data3. L1 and L2 phase data4. S/N for both L1 and L2 be at or above specified minima5. if <strong>qc</strong>-full, an SV elevation at or above the elevation maskThen the numbers of possible, complete, and deleted observations are given. If doing <strong>qc</strong>-full, the both thenumber of possible observations above the horizon and above the elevation mask are given first. Next, thenumber of complete observations is given; if <strong>qc</strong>-full, this is restricted to those observations above the elevationmask. Next, the number of deleted observations is given; if <strong>qc</strong>-full, this is also restricted to those observationsabove the elevation mask.
If the multipath option was set (which it is by default), the average multipath RMS is given. If a movingaverage window was used (which is used by default), information about the length of this window is given. If<strong>qc</strong>-full, the multipath RMS is only for observations above the elevation mask.The number of detected millisecond receiver clock resets is then given. This is followed by the total drift of thereceiver clock, an estimate of the average receiver clock drift, and, if the number of clock resets is non-zero,the average time between resets in minutes.The length of time required before an SV data gap is reported is given next. If <strong>qc</strong>-lite, a maximum time is alsogiven.If the detection of n-millisecond clock slips is on (+cl option), the number of epochs with n-msec clock slips isreported. This occurs when all SVs with multipath observables must have multipath slips of the same size towithin a specified tolerance (fraction of millisecond).This is followed by the number of other n-millisecond multipath slips which do not qualify as n-millisecondclock slips. Given a non-zero tolerance, there is a certain probability that a few multipath slips fall within thetolerance. Therefore, a second value is given in parentheses and this is the total number of multipath slips forthe time window (no elevation mask cutoff). If the tolerance is set to 1e-2 millisecond, ratios on the order of2:100 are expected due to chance. Significantly higher ratios are an indication of a sick receiver.Next if doing the derivative of the ionospheric delay observable (+iod) or multipath (+mp), counts of thenumber of IOD and/or multipath slips is given. If <strong>qc</strong>-full, this is further broken down according to elevationmask. In order to qualify as a count here, both MP1 and MP2 must slip (though not necessarily by the sameamount) at the same epoch for a particular SV.Finally, a "SUM" line in printed, showing the start and end times of the window, the length of the time windowin hours, the observation interval in seconds, the number of possible observations (if <strong>qc</strong>-full), the number ofcomplete observations, the ratio of complete to possible observations as a percent (if <strong>qc</strong>-full), the multipathRMS values for MP1 and MP2 (limited by the elevation mask if <strong>qc</strong>-full), and lastly the "observations per slip".The "observations per slip" needs a bit of explanation. First, "observations" means "complete observations" asdefined above, including the elevation mask if <strong>qc</strong>-full. Second, "slip" means "either an IOD slip and/or bothMP1 and MP2 slips occurred during the epoch having a complete observation for this SV".Some additional information for each SV can be included in the short report segment by using the +ssvoption. Similar to the main SUM line, shown for each SV with observations are: the expected number ofobservations, the number of complete observations, the number of deleted observations, ratio of complete topossible observations, multipath RMS values for MP1 and MP2, and the observations per slip.Long Report Segment:The long report segment contains a further breakdown of information by SV and by elevation (if <strong>qc</strong>-full). In thelong report segment, individual SVs are often referenced. The leading character indicated the satellite system:G: NAVSTAR GPS systemR: GLONASS systemT: NNSS Transit systemS: geostationary signal payload


