Food Stamp Program Corrective Action Plan - DPAweb - Alaska ...
Food Stamp Program Corrective Action Plan - DPAweb - Alaska ...
Food Stamp Program Corrective Action Plan - DPAweb - Alaska ...

You also want an ePaper? Increase the reach of your titles
YUMPU automatically turns print PDFs into web optimized ePapers that Google loves.
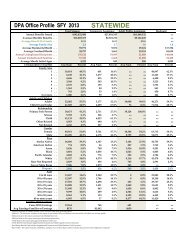
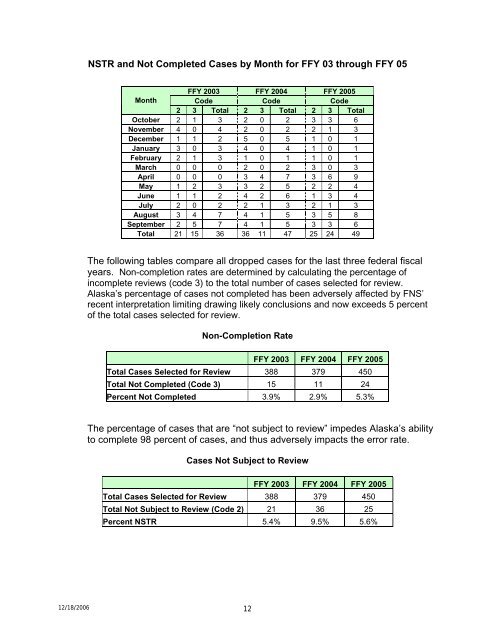
NSTR and Not Completed Cases by Month for FFY 03 through FFY 05FFY 2003 FFY 2004 FFY 2005MonthCode Code Code2 3 Total 2 3 Total 2 3 TotalOctober 2 1 3 2 0 2 3 3 6November 4 0 4 2 0 2 2 1 3December 1 1 2 5 0 5 1 0 1January 3 0 3 4 0 4 1 0 1February 2 1 3 1 0 1 1 0 1March 0 0 0 2 0 2 3 0 3April 0 0 0 3 4 7 3 6 9May 1 2 3 3 2 5 2 2 4June 1 1 2 4 2 6 1 3 4July 2 0 2 2 1 3 2 1 3August 3 4 7 4 1 5 3 5 8September 2 5 7 4 1 5 3 3 6Total 21 15 36 36 11 47 25 24 49The following tables compare all dropped cases for the last three federal fiscalyears. Non-completion rates are determined by calculating the percentage ofincomplete reviews (code 3) to the total number of cases selected for review.<strong>Alaska</strong>’s percentage of cases not completed has been adversely affected by FNS’recent interpretation limiting drawing likely conclusions and now exceeds 5 percentof the total cases selected for review.Non-Completion RateFFY 2003 FFY 2004 FFY 2005Total Cases Selected for Review 388 379 450Total Not Completed (Code 3) 15 11 24Percent Not Completed 3.9% 2.9% 5.3%The percentage of cases that are “not subject to review” impedes <strong>Alaska</strong>’s abilityto complete 98 percent of cases, and thus adversely impacts the error rate.Cases Not Subject to ReviewFFY 2003 FFY 2004 FFY 2005Total Cases Selected for Review 388 379 450Total Not Subject to Review (Code 2) 21 36 25Percent NSTR 5.4% 9.5% 5.6%12/18/2006 12