Chapter 4 Applications of the definite integral to rates, velocities and ...
Chapter 4 Applications of the definite integral to rates, velocities and ...
Chapter 4 Applications of the definite integral to rates, velocities and ...

Create successful ePaper yourself
Turn your PDF publications into a flip-book with our unique Google optimized e-Paper software.
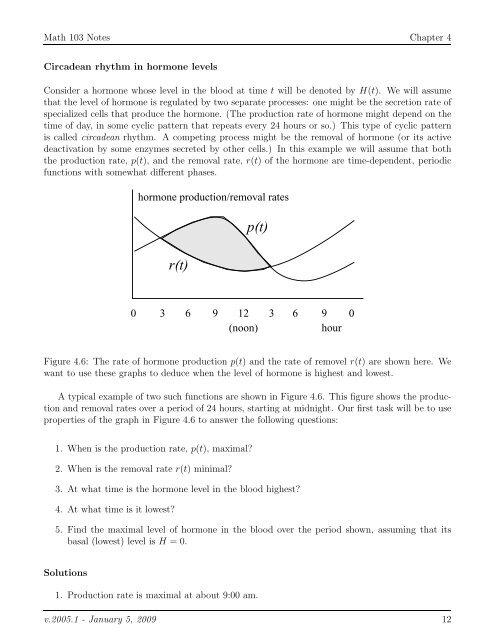
Math 103 Notes <strong>Chapter</strong> 4Circadean rhythm in hormone levelsConsider a hormone whose level in <strong>the</strong> blood at time t will be denoted by H(t). We will assumethat <strong>the</strong> level <strong>of</strong> hormone is regulated by two separate processes: one might be <strong>the</strong> secretion rate <strong>of</strong>specialized cells that produce <strong>the</strong> hormone. (The production rate <strong>of</strong> hormone might depend on <strong>the</strong>time <strong>of</strong> day, in some cyclic pattern that repeats every 24 hours or so.) This type <strong>of</strong> cyclic patternis called circadean rhythm. A competing process might be <strong>the</strong> removal <strong>of</strong> hormone (or its activedeactivation by some enzymes secreted by o<strong>the</strong>r cells.) In this example we will assume that both<strong>the</strong> production rate, p(t), <strong>and</strong> <strong>the</strong> removal rate, r(t) <strong>of</strong> <strong>the</strong> hormone are time-dependent, periodicfunctions with somewhat different phases.hormone production/removal <strong>rates</strong>r(t)p(t)0 3 6 9 12 3 6 9 0(noon)hourFigure 4.6: The rate <strong>of</strong> hormone production p(t) <strong>and</strong> <strong>the</strong> rate <strong>of</strong> removel r(t) are shown here. Wewant <strong>to</strong> use <strong>the</strong>se graphs <strong>to</strong> deduce when <strong>the</strong> level <strong>of</strong> hormone is highest <strong>and</strong> lowest.A typical example <strong>of</strong> two such functions are shown in Figure 4.6. This figure shows <strong>the</strong> production<strong>and</strong> removal <strong>rates</strong> over a period <strong>of</strong> 24 hours, starting at midnight. Our first task will be <strong>to</strong> useproperties <strong>of</strong> <strong>the</strong> graph in Figure 4.6 <strong>to</strong> answer <strong>the</strong> following questions:1. When is <strong>the</strong> production rate, p(t), maximal?2. When is <strong>the</strong> removal rate r(t) minimal?3. At what time is <strong>the</strong> hormone level in <strong>the</strong> blood highest?4. At what time is it lowest?5. Find <strong>the</strong> maximal level <strong>of</strong> hormone in <strong>the</strong> blood over <strong>the</strong> period shown, assuming that itsbasal (lowest) level is H = 0.Solutions1. Production rate is maximal at about 9:00 am.v.2005.1 - January 5, 2009 12