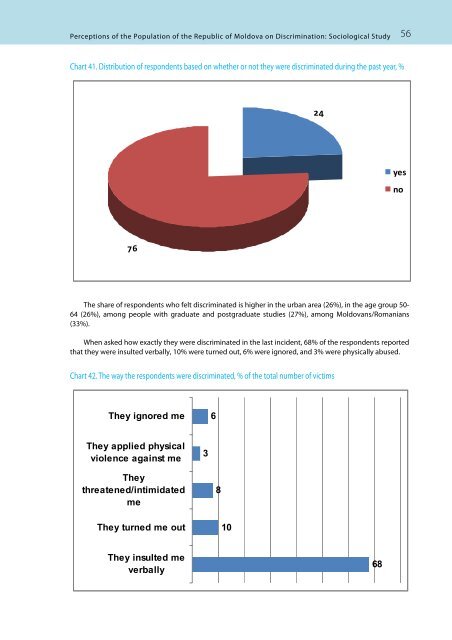
<strong>Perceptions</strong> <strong>of</strong> <strong>the</strong> <strong>Population</strong> <strong>of</strong> <strong>the</strong> <strong>Republic</strong> <strong>of</strong> <strong>Moldova</strong> on Discrimination: Sociological Study 56Chart 41. Distribution <strong>of</strong> respondents based on whe<strong>the</strong>r or not <strong>the</strong>y were discriminated during <strong>the</strong> past year, %24yesno76The share <strong>of</strong> respondents who felt discriminated is higher in <strong>the</strong> urban area (26%), in <strong>the</strong> age group 50-64 (26%), among people with graduate and postgraduate studies (27%), among <strong>Moldova</strong>ns/Romanians(33%).When asked how exactly <strong>the</strong>y were discriminated in <strong>the</strong> last incident, 68% <strong>of</strong> <strong>the</strong> respondents reportedthat <strong>the</strong>y were insulted verbally, 10% were turned out, 6% were ignored, and 3% were physically abused.Chart 42. The way <strong>the</strong> respondents were discriminated, % <strong>of</strong> <strong>the</strong> total number <strong>of</strong> victimsThey ignored me6They applied physicalviolence against me3Theythreatened/intimidatedme8They turned me out10They insulted meverbally68
<strong>Perceptions</strong> <strong>of</strong> <strong>the</strong> <strong>Population</strong> <strong>of</strong> <strong>the</strong> <strong>Republic</strong> <strong>of</strong> <strong>Moldova</strong> on Discrimination: Sociological Study 57The share <strong>of</strong> respondents who said <strong>the</strong>y were verbally insulted is higher in <strong>the</strong> rural area (78%), amongwomen (73%), among retired persons, persons with disabilities (80%), and among school and universitystudents (77%). The share <strong>of</strong> those who were turned out is higher among <strong>the</strong> persons looking for a job(20%), <strong>the</strong> share <strong>of</strong> those who were threatened – among <strong>the</strong> persons with a high level <strong>of</strong> well-being (22%),and <strong>the</strong> share <strong>of</strong> those who were ignored – among <strong>the</strong> elderly (12%).When asked “What were <strong>the</strong> reasons for such a behavior”, 33% <strong>of</strong> those who were discriminatedanswered that <strong>the</strong>y lacked money, 21% – because <strong>of</strong> <strong>the</strong>ir age, 14% – because <strong>the</strong>y were women, 12% –because <strong>the</strong>y had different opinions, 11% – because <strong>of</strong> <strong>the</strong>ir health status, 5% – because <strong>of</strong> <strong>the</strong>ir ethnicity.The share <strong>of</strong> respondents who reported <strong>the</strong>y were discriminated because <strong>the</strong>y lacked money is higher in<strong>the</strong> urban area (36%), in <strong>the</strong> age group 18-34 (37%), among respondents looking for a job (39%), amongpersons working in <strong>the</strong> household (38%), and among Gagauz people (65%). The share <strong>of</strong> respondents whosaid <strong>the</strong>y were discriminated because <strong>of</strong> <strong>the</strong>ir age is higher among men (26%), persons over 65 years old(54%), persons with high school education (32%), and retired persons/persons with disabilities (51%).The persons who committed discrimination had <strong>the</strong> following characteristics: 64% – men, 36% –women, 54% – older than <strong>the</strong> discriminated person, 36% – younger than <strong>the</strong> discriminated person. In 41%<strong>of</strong> <strong>the</strong> cases <strong>the</strong> discriminator was an individual and in 53% <strong>of</strong> <strong>the</strong> cases – a legal entity orinstitution/organization (see Chart 43).Chart 43. Characteristics <strong>of</strong> <strong>the</strong> discriminator in <strong>the</strong> last incident, % <strong>of</strong> victims645453363641ManWoman Older person YoungerpersonPrivateperson;Representative<strong>of</strong> aninstitutionThe share <strong>of</strong> persons who reported <strong>the</strong>y were discriminated by men is higher in <strong>the</strong> rural area (69%), in<strong>the</strong> age group 35-49 (70%), among those looking for a job (75%), and those who said <strong>the</strong>y had a goodfinancial situation (74%).The share <strong>of</strong> respondents discriminated by women is higher in <strong>the</strong> urban area (39%), in <strong>the</strong> age group<strong>of</strong> 50 years and more (41%), among <strong>the</strong> retired persons or <strong>the</strong> persons with disabilities (51%), as well asamong those with a low level <strong>of</strong> income (44%).The share <strong>of</strong> respondents who reported <strong>the</strong>y were discriminated by persons older than <strong>the</strong>m is higherin <strong>the</strong> age group 18-34 (72%), among those with junior and senior high school education (61%), highschool or university students, (70%), people looking for a job (60%).The share <strong>of</strong> respondents who reported that <strong>the</strong>y were discriminated by people younger than <strong>the</strong>m ishigher among people aged over 65 (84%), <strong>the</strong> retired persons and <strong>the</strong> persons with disabilities (72%).