

2014-african-transformation-report
2014-african-transformation-report
2014-african-transformation-report

Create successful ePaper yourself
Turn your PDF publications into a flip-book with our unique Google optimized e-Paper software.
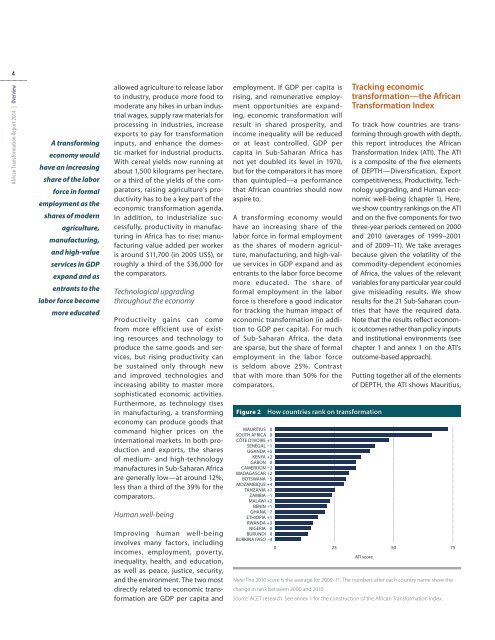
4African Transformation Report <strong>2014</strong> | OverviewA transformingeconomy wouldhave an increasingshare of the laborforce in formalemployment as theshares of modernagriculture,manufacturing,and high-valueservices in GDPexpand and asentrants to thelabor force becomemore educatedallowed agriculture to release laborto industry, produce more food tomoderate any hikes in urban industrialwages, supply raw materials forprocessing in industries, increaseexports to pay for <strong>transformation</strong>inputs, and enhance the domesticmarket for industrial products.With cereal yields now running atabout 1,500 kilograms per hectare,or a third of the yields of the comparators,raising agriculture’s productivityhas to be a key part of theeconomic <strong>transformation</strong> agenda.In addition, to industrialize successfully,productivity in manufacturingin Africa has to rise; manufacturingvalue added per workeris around $11,700 (in 2005 US$), orroughly a third of the $36,000 forthe comparators.Technological upgradingthroughout the economyProductivity gains can comefrom more efficient use of existingresources and technology toproduce the same goods and services,but rising productivity canbe sustained only through newand improved technologies andincreasing ability to master moresophisticated economic activities.Furthermore, as technology risesin manufacturing, a transformingeconomy can produce goods thatcommand higher prices on theinternational markets. In both productionand exports, the sharesof medium- and high-technologymanufactures in Sub- Saharan Africaare generally low—at around 12%,less than a third of the 39% for thecomparators.Human well-beingImproving human well-beinginvolves many factors, includingincomes, employment, poverty,inequality, health, and education,as well as peace, justice, security,and the environment. The two mostdirectly related to economic <strong>transformation</strong>are GDP per capita andemployment. If GDP per capita isrising, and remunerative employmentopportunities are expanding,economic <strong>transformation</strong> willresult in shared prosperity, andincome inequality will be reducedor at least controlled. GDP percapita in Sub- Saharan Africa hasnot yet doubled its level in 1970,but for the comparators it has morethan quintupled—a performancethat African countries should nowaspire to.A transforming economy wouldhave an increasing share of thelabor force in formal employmentas the shares of modern agriculture,manufacturing, and high-valueservices in GDP expand and asentrants to the labor force becomemore educated. The share offormal employment in the laborforce is therefore a good indicatorfor tracking the human impact ofeconomic <strong>transformation</strong> (in additionto GDP per capita). For muchof Sub- Saharan Africa, the dataare sparse, but the share of formalemployment in the labor forceis seldom above 25%. Contrastthat with more than 50% for thecomparators.Figure 2How countries rank on <strong>transformation</strong>Tracking economic<strong>transformation</strong>—the AfricanTransformation IndexTo track how countries are transformingthrough growth with depth,this <strong>report</strong> introduces the AfricanTransformation Index (ATI). The ATIis a composite of the five elementsof DEPTH— Diversification, Exportcompetitiveness, Productivity, Technologyupgrading, and Human economicwell-being (chapter 1). Here,we show country rankings on the ATIand on the five components for twothree-year periods centered on 2000and 2010 (averages of 1999–2001and of 2009–11). We take averagesbecause given the volatility of thecommodity- dependent economiesof Africa, the values of the relevantvariables for any particular year couldgive misleading results. We showresults for the 21 Sub- Saharan countriesthat have the required data.Note that the results reflect economicoutcomes rather than policy inputsand institutional environments (seechapter 1 and annex 1 on the ATI’soutcome-based approach).Putting together all of the elementsof DEPTH, the ATI shows Mauritius,MAURITIUS 0SOUTH AFRICA 0CÔTE D’IVOIRE +1SENEGAL –1UGANDA +5KENYA +2GABON 0CAMEROON –2MADAGASCAR +2BOTSWANA –5MOZAMBIQUE +4TANZANIA +1ZAMBIA –1MALAWI +2BENIN –1GHANA –7ETHIOPIA +1RWANDA +3NIGERIA 0BURUNDI 0BURKINA FASO –40 25 50 75ATI scoreNote: The 2010 score is the average for 2009–11. The numbers after each country name show thechange in rank between 2000 and 2010.Source: ACET research. See annex 1 for the construction of the African Transformation Index.