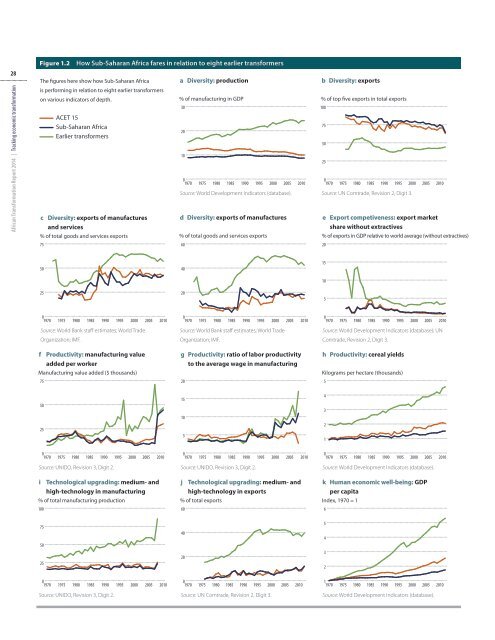
27learn how to produce new goodsand services. Only by learningcan they expand their economiesfrom ones based mainly on traditionalagriculture and primarycommodities to ones that alsoincreasingly include modern agriculturalproduction, manufactures,and high-value services.One indicator of progress toward amore diversified production structureis the share of manufacturingvalue added in GDP. Sub- SaharanAfrica’s average share was 9% in2010, much the same as in the1970s (figure 1.2a). For the ACET 15the share has actually fallen—from around 12% in the 1970s and1980s to roughly 10% in 2010. Forthe comparators the share rosefrom 15% in 1970 to almost 25%in 2010. Indeed, it appears thatSub- Saharan countries are directlyreplacing agriculture with servicesas the largest economic sectorwithout passing through the intermediatephase of industrializationand an expanding manufacturingsector, the experience of almost allsuccessful economies. Moreover,a large part of the services sectorin many Sub- Saharan countriesconsists of low-technology andlow-value activities. These trendsare of great concern, since manufacturinghas historically been themain source of technological learning.This is true even in the currentknowledge economy, since a largepart of the value of computer software,for example, is its impact onmanufacturing technology andprocesses.Diversified exports. The importanceof diversified productionapplies equally to exports. 5 A diversifiedexport base can minimize volatilityin foreign exchange earnings,which for small, open developingeconomies allows access to capital,technology, and critical intermediateinputs. For many African countriesexports are concentrated in anarrow range of primary productsthat has remained much the sameover the past 40 years. The top fiveexport commodities account forabout 70% of merchandise exportsin Sub- Saharan countries, muchmore than the 44% in the comparatorcountries (figure 1.2b).African countriesneed to purposivelylearn how toproduce new goodsand servicesAfrican Transformation Report <strong>2014</strong> | Tracking economic <strong>transformation</strong>Box 1.1Comparing the ACET 15 with eight earlier transformersThis inaugural issue of the AfricanTransformation Report highlightsa subset of 15 Sub- Saharan countries,the ACET 15. Future issueswill progressively expand thecoverage to include other Africancountries.The ACET 15 are Senegal, BurkinaFaso, Ghana, and Nigeria in WestAfrica; Ethiopia, Kenya, Uganda,Tanzania, and Rwanda in EastAfrica; Cameroon in Central Africa;and Zambia, Botswana, SouthAfrica, Mozambique, and Mauritiusin Southern Africa. Ratherrepresentative, these countriescomprise 70% of the population(in 2010), 76% of GDP, 85% ofmanufacturing value added, 65%of agricultural value added, and80% of exports. All the subregionsof Sub- Saharan Africa arerepresented (some more thanothers), as are the major officiallanguages of English, French, andPortuguese. Countries in conflictor recently emerging fromconflict are not included, sincereconstruction is more pressingin these countries than economic<strong>transformation</strong>.Working with local think tanks,ACET prepared country <strong>transformation</strong>studies for each of the15, assessing the <strong>transformation</strong>record, platform, and prospects.The comparator countries areBrazil, Chile, Indonesia, Malaysia,Singapore, South Korea,Thailand, and Vietnam, whoseeconomies 30–40 years agohad several features in commonwith many African countriestoday— widespread poverty, lowproductivity, low levels of technology,and limited exports. Butthey ignited and sustained longperiods of high GDP and exportgrowth, technological upgrading,and substantial improvementsin the lives of their people tobecome middle- or high- incomecountries.Individual comparators could alsobe related to individual ACET 15countries. Brazil and Indonesia—with their large populations,agriculture, and oil—couldbe related to Nigeria. Brazil, amiddle- income country withbudding technological prospects,and Korea could point the wayfor South Africa. Chile, Malaysia,and Thailand could point the wayfor Ghana, Kenya, and Senegalin agribusiness and in attractingforeign direct investmentfor manufacturing. Chile, a bigcopper producer that has alsomanaged to develop agribusiness,could point the way forZambia, a large copper producerwith large tracts of undevelopedagricultural land. And Vietnam,evolving from a statist economicapproach to an attractive foreigndirect investment destination,could hold lessons for Ethiopia,which has roughly the same populationand a government with afairly heavy hand in the economy.
28African Transformation Report <strong>2014</strong> | Tracking economic <strong>transformation</strong>Figure 1.2How Sub- Saharan Africa fares in relation to eight earlier transformersThe figures here show how Sub-Saharan Africais performing in relation to eight earlier transformerson various indicators of depth.75ACET 15Sub-Saharan AfricaEarlier transformersc Diversity: exports of manufacturesand services% of total goods and services exportsa Diversity: production% of manufacturing in GDP3020100197019751980198519901995% of total goods and services exports2000d Diversity: exports of manufactures20052010b Diversity: exports% of top five exports in total exports01970Source: World Development Indicators (database). Source: UN Comtrade, Revision 2, Digit 3.60100755025e Export competiveness: export marketshare without extractives% of exports in GDP relative to world average (without extractives)20197519801985199019952000200520105040151025205019701975198019851990199520002005201001970197519801985199019952000200520100197019751980198519901995200020052010Source: World Bank staff estimates; World TradeOrganization; IMF.Source: World Bank staff estimates; World TradeOrganization; IMF.Source: World Development Indicators (database); UNComtrade, Revision 2, Digit 3.f Productivity: manufacturing valueadded per workerManufacturing value added ($ thousands)75g Productivity: ratio of labor productivityto the average wage in manufacturing20h Productivity: cereal yieldsKilograms per hectare (thousands)550251510543210001970 1975 1980 1985 1990 1995 2000 2005 2010 1970 1975 1980 1985 1990 1995 2000 2005 2010 1970 1975 1980 1985 1990 1995 2000 2005Source: UNIDO, Revision 3, Digit 2. Source: UNIDO, Revision 3, Digit 2. Source: World Development Indicators (database).2010iTechnological upgrading: medium- andhigh-technology in manufacturing% of total manufacturing production100jTechnological upgrading: medium- andhigh-technology in exports% of total exports60k Human economic well-being: GDPper capitaIndex, 1970 = 16755025402054320011970 1975 1980 1985 1990 1995 2000 2005 2010 1970 1975 1980 1985 1990 1995 2000 2005 2010 1970 1975 1980 1985 1990 1995 2000 2005 2010Source: UNIDO, Revision 3, Digit 2. Source: UN Comtrade, Revision 2, Digit 3. Source: World Development Indicators (database).