

2014-african-transformation-report
2014-african-transformation-report
2014-african-transformation-report

Create successful ePaper yourself
Turn your PDF publications into a flip-book with our unique Google optimized e-Paper software.
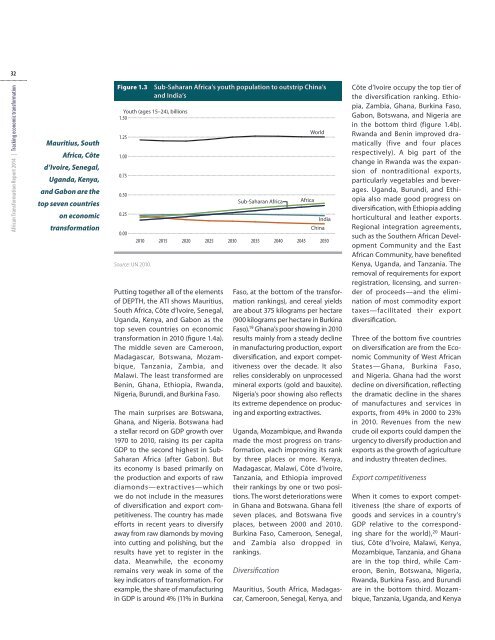
32African Transformation Report <strong>2014</strong> | Tracking economic <strong>transformation</strong>Mauritius, SouthAfrica, Côted’Ivoire, Senegal,Uganda, Kenya,and Gabon are thetop seven countrieson economic<strong>transformation</strong>Figure 1.3Sub- Saharan Africa’s youth population to outstrip China’sand India’sYouth (ages 15–24), billions1.501.251.000.750.500.250.002010Source: UN 2010.201520202025Putting together all of the elementsof DEPTH, the ATI shows Mauritius,South Africa, Côte d’Ivoire, Senegal,Uganda, Kenya, and Gabon as thetop seven countries on economic<strong>transformation</strong> in 2010 (figure 1.4a).The middle seven are Cameroon,Madagascar, Botswana, Mozambique,Tanzania, Zambia, andMalawi. The least transformed areBenin, Ghana, Ethiopia, Rwanda,Nigeria, Burundi, and Burkina Faso.The main surprises are Botswana,Ghana, and Nigeria. Botswana hada stellar record on GDP growth over1970 to 2010, raising its per capitaGDP to the second highest in Sub-Saharan Africa (after Gabon). Butits economy is based primarily onthe production and exports of rawdiamonds—extractives—whichwe do not include in the measuresof diversification and export competitiveness.The country has madeefforts in recent years to diversifyaway from raw diamonds by movinginto cutting and polishing, but theresults have yet to register in thedata. Meanwhile, the economyremains very weak in some of thekey indicators of <strong>transformation</strong>. Forexample, the share of manufacturingin GDP is around 4% (11% in Burkina2030Sub-Saharan Africa20352040Faso, at the bottom of the <strong>transformation</strong>rankings), and cereal yieldsare about 375 kilograms per hectare(900 kilograms per hectare in BurkinaFaso). 19 Ghana’s poor showing in 2010results mainly from a steady declinein manufacturing production, exportdiversification, and export competitivenessover the decade. It alsorelies considerably on unprocessedmineral exports (gold and bauxite).Nigeria’s poor showing also reflectsits extreme dependence on producingand exporting extractives.Uganda, Mozambique, and Rwandamade the most progress on <strong>transformation</strong>,each improving its rankby three places or more. Kenya,Madagascar, Malawi, Côte d’Ivoire,Tanzania, and Ethiopia improvedtheir rankings by one or two positions.The worst deteriorations werein Ghana and Botswana. Ghana fellseven places, and Botswana fiveplaces, between 2000 and 2010.Burkina Faso, Cameroon, Senegal,and Zambia also dropped inrankings.DiversificationAfrica2045WorldChinaIndia2050Mauritius, South Africa, Madagascar,Cameroon, Senegal, Kenya, andCôte d’Ivoire occupy the top tier ofthe diversification ranking. Ethiopia,Zambia, Ghana, Burkina Faso,Gabon, Botswana, and Nigeria arein the bottom third (figure 1.4b).Rwanda and Benin improved dramatically(five and four placesrespectively). A big part of thechange in Rwanda was the expansionof nontraditional exports,particularly vegetables and beverages.Uganda, Burundi, and Ethiopiaalso made good progress ondiversification, with Ethiopia addinghorticultural and leather exports.Regional integration agreements,such as the Southern African DevelopmentCommunity and the EastAfrican Community, have benefitedKenya, Uganda, and Tanzania. Theremoval of requirements for exportregistration, licensing, and surrenderof proceeds—and the eliminationof most commodity exporttaxes—facilitated their exportdiversification.Three of the bottom five countrieson diversification are from the EconomicCommunity of West AfricanStates—Ghana, Burkina Faso,and Nigeria. Ghana had the worstdecline on diversification, reflectingthe dramatic decline in the sharesof manufactures and services inexports, from 49% in 2000 to 23%in 2010. Revenues from the newcrude oil exports could dampen theurgency to diversify production andexports as the growth of agricultureand industry threaten declines.Export competitivenessWhen it comes to export competitiveness(the share of exports ofgoods and services in a country’sGDP relative to the correspondingshare for the world), 20 Mauritius,Côte d’Ivoire, Malawi, Kenya,Mozambique, Tanzania, and Ghanaare in the top third, while Cameroon,Benin, Botswana, Nigeria,Rwanda, Burkina Faso, and Burundiare in the bottom third. Mozambique,Tanzania, Uganda, and Kenya