29Apart from broadening the range ofexport products, a further challengeis to broaden the sectoral origin ofexports to include more manufacturesand high-value services. Sub-Saharan Africa’s share of manufacturesand services in total exportsis below that of the comparators,but it saw a bump in the mid-1990s(figure 1.2c). For both Sub- SaharanAfrica and the ACET 15, more thanhalf the rise has come from services;the gap with the comparators inmanufactures has remained wide(figure 1.2d).E—export competitivenessExporting provides the opportunityto expand production, boostemployment, reduce unit costs, andincrease incomes. It also enables acountry to better exploit its comparativeadvantage to generatehigher incomes, which can pay forthe investments in skills, capital, andtechnology to enhance competitivenessover time. And the knowledgegained from exposure to exportcompetition helps in raising productivityand innovating with new products.Indeed, exporting was a key tosuccess for the East Asian countries.And although the global economicenvironment has changed, exportingcan still be a viable and importantpart of Africa’s economic <strong>transformation</strong>(chapter 3).A good indicator of a country’sexport competitiveness is itsshare in world exports of goodsand services and how that sharemoves over time. However, a smalleconomy could be very competitivein exports and still have asmall world share (Mauritius andSingapore). A way to overcome thisis to divide world export sharesby world GDP shares. This ratio isequivalent to the exports-to-GDPratio of a country divided by theexports-to-GDP ratio of the world.If this measure is greater than 1, thecountry is exporting a greater shareof its GDP than the world average,so it is in a sense more competitivein exporting. 6 And a rising trendin the ratio indicates rising exportcompetitiveness. 7In Africa a large increase in theexports of extractives by a countrymay not indicate that the country’seconomy is transforming, soextractives are removed from bothexports and GDP in calculating themeasure. Trends in this measureof export competitiveness showa large gap between the Africancountries and the comparators(figure 1.2e). The share of nonextractiveexports in nonextractiveGDP rose between 1980 and 1985.It has since been on a downwardtrend, revealing that the region’srecent GDP growth has not beenmatched by corresponding growthin exports outside extractives.P—productivity gainsProductivity gains enable moregoods and services to be producedfrom existing resources and technology.Manufacturing value added permanufacturing worker is one indicatorof labor productivity in manufacturing.Dividing this indicator bythe average wage in manufacturinggives labor productivity in manufacturingper dollar paid in wages.Manufacturing value added perworker in Sub- Saharan Africa andthe ACET 15 is lower than in thecomparators, especially before 2008(figure 1.2f), but the gap is narrowerwhen wages are taken into account(figure 1.2g). In fact, adjusted forwages, Sub- Saharan countries havebeen slightly above the comparatorcountries since the mid-1990s. 8 Thissuggests that Africa could competeon wage costs in manufacturingif it could control and graduallyreduce its other considerable disadvantages,such as infrastructuredeficits, regulatory and governanceconstraints, and the tendency inresource-rich countries towardovervalued exchange rates.In many Sub- Saharan countries themajority of the population lives inrural areas, mostly dependent onagriculture. Increasing agriculturalproductivity would thus be apowerful way to raise incomes andmake inroads into poverty reduction.It would also facilitate overallindustrialization and economic<strong>transformation</strong>. Indeed, in mostindustrialization experiences, a risein agricultural productivity allowedagriculture to release labor to industry,produce more food to moderaterises in urban food prices and thusindustrial wage demands, produceraw materials for processing inindustries, increase exports, andenhance the domestic market forindustrial products. Boosting agriculture’sproductivity thus has to bea key part of the economic <strong>transformation</strong>agenda.Cereal yields provide a reasonableproxy for productivity in agriculture.In 1970 yields in Sub- SaharanAfrica were about half those in thecomparator countries (figure 1.2h).But with yields growing amongboth groups, the absolute differencesin yields were larger in 2011. Forthe ACET 15 yields rose from about900 kilograms in 1970 to 2,045 in2011, and for the comparators, from1,955 kilograms in 1970 to 4,570kilograms in 2011. 9T—technological upgradingAs a country’s manufacturingadvances from low to medium andhigh technology, it can producegoods that command higher priceson international markets. Also,a rising capability to introducenew and improved technologiesenables a country to sustain productivitygrowth over time. In bothproduction and exports the sharesof medium- and high-technologymanufactures in Sub- Saharan Africaare much lower than in the comparators(figures 1.2i and 1.2j). 10 Moreimportant, while the level of manufacturingtechnology has beenExporting providesthe opportunity toexpand production,boost employment,reduce unit costs,and increaseincomesAfrican Transformation Report <strong>2014</strong> | Tracking economic <strong>transformation</strong>
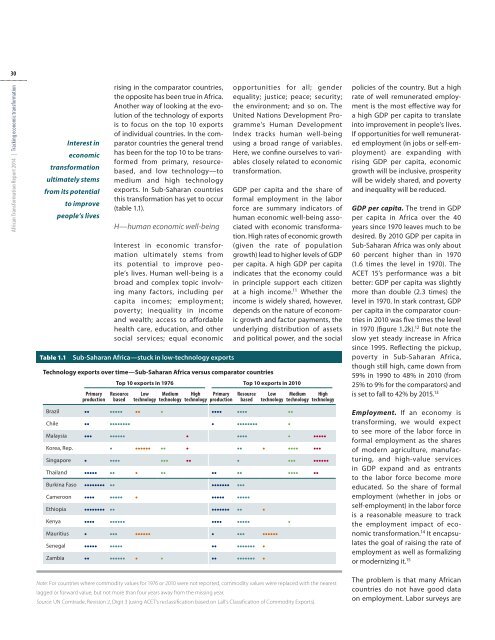
30African Transformation Report <strong>2014</strong> | Tracking economic <strong>transformation</strong>Interest ineconomic<strong>transformation</strong>ultimately stemsfrom its potentialTable 1.1to improvepeople’s livesrising in the comparator countries,the opposite has been true in Africa.Another way of looking at the evolutionof the technology of exportsis to focus on the top 10 exportsof individual countries. In the comparatorcountries the general trendhas been for the top 10 to be transformedfrom primary, resourcebased,and low technology—tomedium and high technologyexports. In Sub- Saharan countriesthis <strong>transformation</strong> has yet to occur(table 1.1).H—human economic well-beingInterest in economic <strong>transformation</strong>ultimately stems fromits potential to improve people’slives. Human well-being is abroad and complex topic involvingmany factors, including percapita incomes; employment;poverty; inequality in incomeand wealth; access to affordablehealth care, education, and othersocial services; equal economicSub- Saharan Africa—stuck in low-technology exportsTechnology exports over time—Sub- Saharan Africa versus comparator countriesPrimaryproductionopportunities for all; genderequality; justice; peace; security;the environment; and so on. TheUnited Nations Development Programme’sHuman DevelopmentIndex tracks human well-beingusing a broad range of variables.Here, we confine ourselves to variablesclosely related to economic<strong>transformation</strong>.GDP per capita and the share offormal employment in the laborforce are summary indicators ofhuman economic well-being associatedwith economic <strong>transformation</strong>.High rates of economic growth(given the rate of populationgrowth) lead to higher levels of GDPper capita. A high GDP per capitaindicates that the economy couldin principle support each citizenat a high income. 11 Whether theincome is widely shared, however,depends on the nature of economicgrowth and factor payments, theunderlying distribution of assetsand political power, and the socialTop 10 exports in 1976 Top 10 exports in 2010ResourcebasedLowtechnologyMediumtechnologyHightechnologyPrimaryproductionResourcebasedLowtechnologyBrazil •• ••••• •• • •••• •••• ••Chile •• •••••••• • •••••••• •MediumtechnologyHightechnologyMalaysia ••• •••••• • •••• • •••••Korea, Rep. • •••••• •• • •• • •••• •••Singapore • •••• ••• •• • ••• ••••••Thailand ••••• •• • •• •• •• •••• ••Burkina Faso •••••••• •• ••••••• •••Cameroon •••• ••••• • ••••• •••••Ethiopia •••••••• •• ••••••• •• •Kenya •••• •••••• •••• ••••• •Mauritius • ••• •••••• • ••• ••••••Senegal ••••• ••••• •• ••••••• •Zambia •• •••••• • • •• ••••••• •Note: For countries where commodity values for 1976 or 2010 were not <strong>report</strong>ed, commodity values were replaced with the nearestlagged or forward value, but not more than four years away from the missing year.Source: UN Comtrade, Revision 2, Digit 3 (using ACET’s reclassification based on Lall’s Classification of Commodity Exports).policies of the country. But a highrate of well remunerated employmentis the most effective way fora high GDP per capita to translateinto improvement in people’s lives.If opportunities for well remuneratedemployment (in jobs or self-employment)are expanding withrising GDP per capita, economicgrowth will be inclusive, prosperitywill be widely shared, and povertyand inequality will be reduced.GDP per capita. The trend in GDPper capita in Africa over the 40years since 1970 leaves much to bedesired. By 2010 GDP per capita inSub- Saharan Africa was only about60 percent higher than in 1970(1.6 times the level in 1970). TheACET 15’s performance was a bitbetter: GDP per capita was slightlymore than double (2.3 times) thelevel in 1970. In stark contrast, GDPper capita in the comparator countriesin 2010 was five times the levelin 1970 (figure 1.2k). 12 But note theslow yet steady increase in Africasince 1995. Reflecting the pickup,poverty in Sub- Saharan Africa,though still high, came down from59% in 1990 to 48% in 2010 (from25% to 9% for the comparators) andis set to fall to 42% by 2015. 13Employment. If an economy istransforming, we would expectto see more of the labor force informal employment as the sharesof modern agriculture, manufacturing,and high-value servicesin GDP expand and as entrantsto the labor force become moreeducated. So the share of formalemployment (whether in jobs orself-employment) in the labor forceis a reasonable measure to trackthe employment impact of economic<strong>transformation</strong>. 14 It encapsulatesthe goal of raising the rate ofemployment as well as formalizingor modernizing it. 15The problem is that many Africancountries do not have good dataon employment. Labor surveys are