Carlisle is the most northerly city in England, and the ... - NHS Cumbria
Carlisle is the most northerly city in England, and the ... - NHS Cumbria
Carlisle is the most northerly city in England, and the ... - NHS Cumbria
- No tags were found...
Create successful ePaper yourself
Turn your PDF publications into a flip-book with our unique Google optimized e-Paper software.
<strong>Carl<strong>is</strong>le</strong> <strong>and</strong> D<strong>is</strong>trictHealth Improvement <strong>and</strong> Health Inequalities Strategy2008 – 2010Basel<strong>in</strong>e Assessment <strong>and</strong> City ProfileReport produced by:Fiona Hunt<strong>in</strong>gton, Health Improvement Special<strong>is</strong>t, <strong>Cumbria</strong> PCTCaoimhe McKerr, Public Health Intelligence Analyst, <strong>Cumbria</strong> PCT
INDEX.Executive Summary -------------------------------------------------------- 2Introduction -------------------------------------------------------- 41. Population -------------------------------------------------------- 41.1 Births -------------------------------------------------------- 61.2 Infant Mortality -------------------------------------------- 61.3 Low Birth Weight Babies ----------------------------------- 62. Ethni<strong>city</strong> ------------------------------------------------------------------- 73. Life Expectancy --------------------------------------------------------- 84. Healthy Life Expectancy ----------------------------------------------- 95. Indices of Multiple Deprivation --------------------------------------- 106. Mortality <strong>and</strong> Morbidity ------------------------------------------------- 116.1 Circulatory D<strong>is</strong>eases ----------------------------------------- 116.2 Cancer ----------------------------------------------------------- 136.3 Respiratory D<strong>is</strong>eases ---------------------------------------- 147. Under 18 Conceptions ------------------------------------------------- 158. Abortions ------------------------------------------------------------------- 169. Lifestyles ------------------------------------------------------------------- 169.1 Body Mass Index ---------------------------------------------- 169.2 Physical Activity ----------------------------------------------- 189.3 Balanced Eat<strong>in</strong>g ----------------------------------------------- 199.4 Fried Food ------------------------------------------------------ 199.5 Smok<strong>in</strong>g --------------------------------------------------------- 209.6 Alcohol ----------------------------------------------------------- 2110. Income ------------------------------------------------------------------- 2211. Employment ------------------------------------------------------------- 2312. People Claim<strong>in</strong>g Benefits -------------------------------------------- 2413. Hous<strong>in</strong>g ------------------------------------------------------------------ 2514. Homelessness ---------------------------------------------------------- 2615. Excess W<strong>in</strong>ter Deaths ------------------------------------------------ 2616. Deaths from Suicide -------------------------------------------------- 2617. Problem Drug Use ---------------------------------------------------- 2718. Screen<strong>in</strong>g Programmes --------------------------------------------- 2918.1 Cervical Cancer --------------------------------------------- 2918.2 Breast Screen<strong>in</strong>g-------------------------------------------- 2918.3 Chlamydia Screen<strong>in</strong>g -------------------------------------- 3019. Childhood Immun<strong>is</strong>ation --------------------------------------------- 3020. Influenza Vacc<strong>in</strong>e ----------------------------------------------------- 3121. Dental Health <strong>in</strong> Children ------------------------------------------- 3122. Air Quality -------------------------------------------------------------- 3223. Mental Health --------------------------------------------------------- 3324. Long Term Limit<strong>in</strong>g Illness ---------------------------------------- 3525. Quality of Life--------------------------------------------------------- 3626. Crime ------------------------------------------------------------------- 3727. Education ------------------------------------------------------------- 3828. Accidents -------------------------------------------------------------- 3928.1 Road Traffic Accidents --------------------------------- 3928.2 Falls --------------------------------------------------------- 4029. Accidental <strong>and</strong> Non- Accidental Injury <strong>in</strong> Children --------- 4130. Sport <strong>and</strong> Le<strong>is</strong>ure --------------------------------------------------- 42Fiona Hunt<strong>in</strong>gton 1 of 47
Executive Summary.The purpose of th<strong>is</strong> report <strong>is</strong> to provide a profile of <strong>the</strong> health of <strong>the</strong> residents of <strong>Carl<strong>is</strong>le</strong> <strong>and</strong>D<strong>is</strong>trict local authority, <strong>and</strong> to identify those broader determ<strong>in</strong>ants of ill health affect<strong>in</strong>g ourpopulation. The report compares <strong>the</strong> health of our residents with <strong>the</strong> broader populations of<strong>Cumbria</strong> <strong>and</strong> of <strong>Engl<strong>and</strong></strong> as a whole. Th<strong>is</strong> will <strong>in</strong>form <strong>the</strong> priorities for action <strong>in</strong> <strong>the</strong> proposedhealth improvement plan.The Health of People Liv<strong>in</strong>g <strong>in</strong> <strong>Carl<strong>is</strong>le</strong> <strong>and</strong> D<strong>is</strong>trict.• With<strong>in</strong> twenty years <strong>Carl<strong>is</strong>le</strong> <strong>is</strong> projected to have a much higher proportion of olderresidents than <strong>the</strong> average for <strong>the</strong> rest of <strong>Engl<strong>and</strong></strong>.• Life expectancy for men <strong>in</strong> <strong>Carl<strong>is</strong>le</strong> <strong>is</strong> similar to that of men for <strong>the</strong> rest of <strong>Engl<strong>and</strong></strong>, whilefor women it <strong>is</strong> around one year shorter.• There are large <strong>in</strong>equalities <strong>in</strong> <strong>the</strong> health of our population. People liv<strong>in</strong>g <strong>in</strong> Castle <strong>and</strong>Upperby wards can expect to live for 75 years <strong>and</strong> spend around ten years or 13% of<strong>the</strong>ir lives <strong>in</strong> poor health. Residents of We<strong>the</strong>ral can expect to live for around 81 years<strong>and</strong> spend just five years or 6% of <strong>the</strong>ir lives <strong>in</strong> poor health.• A boy grow<strong>in</strong>g up <strong>in</strong> Botcherby ward <strong>in</strong> <strong>Carl<strong>is</strong>le</strong> can expect to die n<strong>in</strong>e years earlier thana boy grow<strong>in</strong>g up <strong>in</strong> Burgh ward.• On average residents of <strong>Carl<strong>is</strong>le</strong> can expect to spend 7 1 / 2 years or 10% of <strong>the</strong>ir lives <strong>in</strong>poor health.Causes of Ill Health <strong>in</strong> <strong>Carl<strong>is</strong>le</strong>.• The ma<strong>in</strong> causes of early mortality <strong>in</strong> <strong>Carl<strong>is</strong>le</strong> are circulatory d<strong>is</strong>eases, particularlycoronary heart d<strong>is</strong>ease, <strong>and</strong> suicide.• There <strong>is</strong> a steady decreas<strong>in</strong>g trend <strong>in</strong> early mortality from circulatory d<strong>is</strong>eases. If th<strong>is</strong>trend cont<strong>in</strong>ues it <strong>is</strong> likely that <strong>the</strong> 2010 PSA target will be met.• Th<strong>is</strong> <strong>is</strong> not <strong>the</strong> case for suicide. While <strong>the</strong>re has been a small drop <strong>in</strong> <strong>the</strong> suicide rates<strong>in</strong>ce 2004, <strong>the</strong> mortality rate rema<strong>in</strong>s al<strong>most</strong> twice <strong>the</strong> national average. If <strong>the</strong> currenttrend cont<strong>in</strong>ues <strong>Carl<strong>is</strong>le</strong> will fail to reach its target by 2010.• In relation to cancer, three <strong>Carl<strong>is</strong>le</strong> wards – Morton, Currock <strong>and</strong> Denton Holme have amortality rate significantly higher than <strong>the</strong> national average. Most notably, residents ofDenton Holme have a mortality rate from cancers around 52% higher than nationally.• Teenage conceptions rema<strong>in</strong> well above <strong>the</strong> national average <strong>and</strong> more than twice <strong>the</strong>target set to be achieved by 2010.• 32% of residents have no qualifications compared to <strong>the</strong> average for <strong>Cumbria</strong> which <strong>is</strong>21%. <strong>Carl<strong>is</strong>le</strong> has <strong>the</strong> highest proportion of children <strong>in</strong> <strong>Cumbria</strong> who have receive nopasses at GCSE level, <strong>and</strong> fewer 16 year olds stay on <strong>in</strong> education than <strong>in</strong> <strong>the</strong> rest of<strong>Cumbria</strong> <strong>and</strong> <strong>Engl<strong>and</strong></strong>.• <strong>Carl<strong>is</strong>le</strong> <strong>is</strong> <strong>in</strong> <strong>the</strong> worst 25% of d<strong>is</strong>tricts <strong>in</strong> <strong>Engl<strong>and</strong></strong> for air quality relat<strong>in</strong>g to CO2em<strong>is</strong>sions.• <strong>Carl<strong>is</strong>le</strong> has an excess w<strong>in</strong>ter deaths <strong>in</strong>dex of 17% compared to 14% for <strong>Cumbria</strong> <strong>and</strong>13.4% for <strong>the</strong> North West region.• In relation to lifestyles, only 42% of <strong>Carl<strong>is</strong>le</strong> residents are a healthy weight. 42% of menare overweight compared to 29% of women.• Less than 54% of residents are tak<strong>in</strong>g <strong>the</strong> recommended amount of exerc<strong>is</strong>e.• Only 16.6% of <strong>Carl<strong>is</strong>le</strong> residents eat <strong>the</strong> recommended five portions of fruit <strong>and</strong>vegetables daily.• 39% of people liv<strong>in</strong>g <strong>in</strong> Botcherby ward smoke tobacco, compared to 19% <strong>in</strong> StanwixUrban ward.Fiona Hunt<strong>in</strong>gton 2 of 47
• 27% of men are dr<strong>in</strong>k<strong>in</strong>g more than <strong>the</strong> recommended units of alcohol.• There <strong>is</strong> a lack of available data relat<strong>in</strong>g to breastfeed<strong>in</strong>g of babies.Priority Areas for Action.• To improve healthy life expectancy for both men <strong>and</strong> women across <strong>the</strong> d<strong>is</strong>trict but tofocus actions more specifically on <strong>the</strong> <strong>most</strong> deprived areas.• New actions need to be identified to reduce <strong>the</strong> suicide rate, particularly <strong>in</strong> young men <strong>in</strong>our population.• New actions need to be identified to address <strong>the</strong> teenage conception rate.• Strategies need to be identified to maxim<strong>is</strong>e <strong>the</strong> potential of young people <strong>in</strong> <strong>the</strong> d<strong>is</strong>trict.• Short term priorities should focus on:Reduc<strong>in</strong>g smok<strong>in</strong>gImprov<strong>in</strong>g dietReduc<strong>in</strong>g alcohol consumptionIncreas<strong>in</strong>g physical activityImprov<strong>in</strong>g record<strong>in</strong>g <strong>and</strong> <strong>in</strong>itiat<strong>in</strong>g of breastfeed<strong>in</strong>g.Fiona Hunt<strong>in</strong>gton 3 of 47
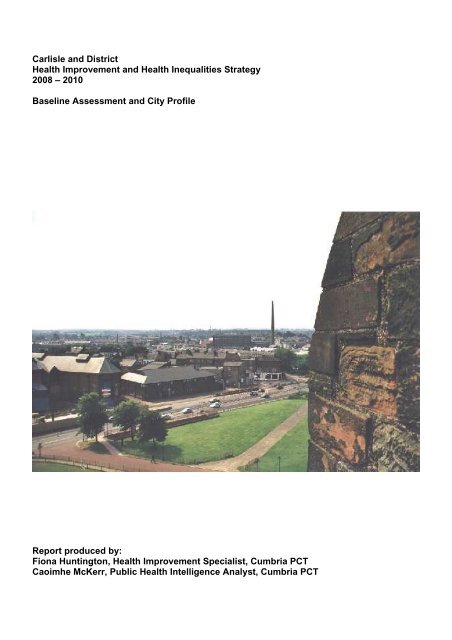
Introduction.<strong>Carl<strong>is</strong>le</strong> <strong>is</strong> <strong>the</strong> <strong>most</strong> nor<strong>the</strong>rly <strong>city</strong> <strong>in</strong> <strong>Engl<strong>and</strong></strong>, <strong>and</strong> <strong>the</strong> only <strong>city</strong> <strong>in</strong> <strong>Cumbria</strong>. It <strong>is</strong> situated less thanten miles from <strong>the</strong> Scott<strong>is</strong>h border. <strong>Carl<strong>is</strong>le</strong> has <strong>the</strong> smallest population of any Engl<strong>is</strong>h <strong>city</strong> but <strong>is</strong><strong>the</strong> largest <strong>in</strong> l<strong>and</strong> area.The urban<strong>is</strong>ed areas of <strong>the</strong> City Council <strong>in</strong>clude, as well as <strong>the</strong> <strong>city</strong> of <strong>Carl<strong>is</strong>le</strong>, <strong>the</strong> towns ofBrampton <strong>and</strong> Longtown. The rema<strong>in</strong><strong>in</strong>g area <strong>is</strong> rural <strong>in</strong> nature.Road transport l<strong>in</strong>ks to <strong>the</strong> <strong>city</strong> <strong>in</strong>clude <strong>the</strong> M6 to <strong>the</strong> South, The A74 to <strong>the</strong> North, The A69 to<strong>the</strong> East <strong>and</strong> <strong>the</strong> A595 to <strong>the</strong> West.Rail l<strong>in</strong>ks are supplied by <strong>the</strong> West Coast ma<strong>in</strong> railway l<strong>in</strong>e with smaller l<strong>in</strong>es serv<strong>in</strong>g fur<strong>the</strong>rroutes.The <strong>city</strong> <strong>is</strong> situated at <strong>the</strong> confluence of three rivers – <strong>the</strong> Eden, Petteril <strong>and</strong> Caldew. Follow<strong>in</strong>gsevere gales <strong>and</strong> heavy ra<strong>in</strong> <strong>in</strong> <strong>the</strong> w<strong>in</strong>ter of 2005 <strong>the</strong> <strong>city</strong> was subject to severe flood<strong>in</strong>g.Follow<strong>in</strong>g th<strong>is</strong> a Task Group – <strong>Carl<strong>is</strong>le</strong> Rena<strong>is</strong>sance - was establ<strong>is</strong>hed to ensure <strong>the</strong> economic,physical <strong>and</strong> social regeneration of <strong>the</strong> <strong>city</strong> <strong>in</strong> <strong>the</strong> aftermath of <strong>the</strong> floods.<strong>Carl<strong>is</strong>le</strong> City Council <strong>is</strong> <strong>in</strong> <strong>the</strong> lowest one fifth of local authorities <strong>in</strong> <strong>Engl<strong>and</strong></strong> for four of five givenhealth <strong>and</strong> deprivation <strong>in</strong>dicators. Local authorities identified as such are designated SpearheadLocal Authorities, l<strong>in</strong>ked to <strong>the</strong> appropriate Primary Care Trust <strong>and</strong> have targets to see fasterprogress compared to <strong>the</strong> average towards reduc<strong>in</strong>g <strong>in</strong>equalities <strong>in</strong> <strong>the</strong> health of <strong>the</strong> localpopulation.1. Population.The City Council covers 15% of <strong>the</strong> area of <strong>Cumbria</strong> <strong>and</strong> has 21% of <strong>the</strong> total <strong>Cumbria</strong>npopulation with 100,739 <strong>in</strong>habitants. Of <strong>the</strong>se 71,773 live with<strong>in</strong> <strong>the</strong> boundaries of <strong>the</strong> <strong>city</strong>. Th<strong>is</strong><strong>is</strong> around 71% of <strong>the</strong> population.<strong>Carl<strong>is</strong>le</strong>’s proportion of residents over <strong>the</strong> age of 65 <strong>is</strong> 19%, similar to that of <strong>the</strong> rest of <strong>Engl<strong>and</strong></strong>.However <strong>the</strong> population of older people <strong>is</strong> predicted to r<strong>is</strong>e considerably <strong>in</strong> <strong>the</strong> future, withpopulation projections of 29.4% <strong>in</strong> th<strong>is</strong> age group by 2014 <strong>and</strong> 39.4% by 2029, compared to18% <strong>and</strong> 22% respectively for <strong>the</strong> rest of <strong>Engl<strong>and</strong></strong> <strong>and</strong> Wales. Th<strong>is</strong> means that <strong>Carl<strong>is</strong>le</strong> will havea much higher proportion of older residents than <strong>the</strong> average for <strong>the</strong> rest of <strong>the</strong> country.The proportion of younger adults <strong>in</strong> <strong>the</strong> 20 – 39 age group <strong>is</strong> lower than <strong>the</strong> average for <strong>Engl<strong>and</strong></strong>at 25% compared to 27%.Figure 1 shows <strong>the</strong> population structure of <strong>Carl<strong>is</strong>le</strong> by age b<strong>and</strong> compared to <strong>the</strong> rest of<strong>Engl<strong>and</strong></strong> <strong>and</strong> Wales.Fiona Hunt<strong>in</strong>gton 4 of 47
Figure1: Mid-2006 Population Pyramids: (Numbers <strong>in</strong> 000’s): Qu<strong>in</strong>ary age groups for D<strong>is</strong>trict Councils <strong>in</strong><strong>Cumbria</strong> PCT, estimated resident populationAge group (years)90+85-8980-8475-7970-7465-6960-6455-5950-5445-4940-4435-3930-3425-2920-2415-1910-145-90-4<strong>Carl<strong>is</strong>le</strong>5.0% 4.0% 3.0% 2.0% 1.0% 0.0% 1.0% 2.0% 3.0% 4.0% 5.0%Female Male Female Eng & Wales Male Eng & WalesTable1: Vital stat<strong>is</strong>tics 2004-2006; selected <strong>in</strong>dicators (numbers <strong>and</strong> rates per 1,000)<strong>Engl<strong>and</strong></strong> <strong>and</strong><strong>Carl<strong>is</strong>le</strong> <strong>Cumbria</strong> WalesYear Number Number Number2004 101,843 489,829 53,012,038Mid Year Population 2005 103,524 494,782 53,398,502Estimate 2006 105,182 498,870 53,691,179No Rate No Rate No RateLive Births 2004 1,151 11.3 4,879 10.0 639,509 12.12005 1,107 10.7 4,784 9.7 645,621 12.12006 1,170 11.1 4,917 9.9 669,601 12.5Infant Deaths 2004 5 4.3 23 4.7 3,234 5.12005 8 7.2 21 4.4 3,217 5.02006 .. 2.6 23 4.7 3,368 5.0Deaths All ages 2004 1,131 10.9 5,589 11.4 513,034 9.62005 1,145 11.1 5,449 11.0 511,840 9.62006 1,078 10.2 5,384 10.8 502,599 9.4Fiona Hunt<strong>in</strong>gton 5 of 47
Source: ONS VS1(“” denotes that data have been suppressed where <strong>the</strong> number of events are less than 5 or wheresubtraction from <strong>the</strong> total may be d<strong>is</strong>closive.)1.1 Births.In recent years birth rates <strong>in</strong> <strong>Cumbria</strong> have been cons<strong>is</strong>tently lower than that of <strong>Engl<strong>and</strong></strong> <strong>and</strong>Wales. <strong>Carl<strong>is</strong>le</strong> <strong>and</strong> Barrow have <strong>the</strong> highest birth rates <strong>in</strong> <strong>the</strong> county. The birth rate <strong>in</strong> <strong>Carl<strong>is</strong>le</strong><strong>in</strong> 2006 was 11.1 per 1000 of <strong>the</strong> resident population compared to <strong>the</strong> rate for <strong>Engl<strong>and</strong></strong> of 12.5,while <strong>the</strong> birth rate for <strong>Cumbria</strong> overall was just 9.9.Figure 2 illustrates trends <strong>in</strong> <strong>the</strong> birth rate s<strong>in</strong>ce 2001. <strong>Carl<strong>is</strong>le</strong> has shown a small, but fairlysteady <strong>in</strong>crease <strong>in</strong> live births from 9.1 <strong>in</strong> 2001 to 11.1 <strong>in</strong> 2006.Figure 2: Compar<strong>is</strong>on of Birth Rates 2001-06Compar<strong>is</strong>on of Live Birth Rates2001-2006Live Birth Rate per 1,000Population14121086420200120022003200420052006<strong>Engl<strong>and</strong></strong> <strong>and</strong>Wales<strong>Carl<strong>is</strong>le</strong><strong>Cumbria</strong>1.2 Infant Mortality.Infant mortality refers to <strong>the</strong> number of babies dy<strong>in</strong>g aged less than one year old divided by <strong>the</strong>total number of live births.The <strong>in</strong>fant mortality rate <strong>in</strong> <strong>Carl<strong>is</strong>le</strong> <strong>in</strong> 2005 was 6.3 per 1,000 live births. Th<strong>is</strong> compares to <strong>the</strong>national average of 3.4 <strong>and</strong> makes <strong>Carl<strong>is</strong>le</strong> <strong>the</strong> only local authority <strong>in</strong> <strong>Cumbria</strong> with a figureabove <strong>the</strong> national average.However, when look<strong>in</strong>g at <strong>the</strong> average <strong>in</strong>fant mortality rate for <strong>Carl<strong>is</strong>le</strong> over <strong>the</strong> five year period2001-2005, <strong>the</strong> figure <strong>is</strong> lower than <strong>the</strong> national average at 2.6 compared to 3.5.1.3 Low Birth Weight Babies.A baby identified as low birth weight <strong>is</strong> a baby who <strong>is</strong> born weigh<strong>in</strong>g less than 2500 grams. Lowbirth weight <strong>is</strong> l<strong>in</strong>ked to per<strong>in</strong>atal death.Multiple pregnancies, poor nutrition, low socio-economic status, teenage pregnancy, <strong>and</strong>smok<strong>in</strong>g <strong>and</strong> dr<strong>in</strong>k<strong>in</strong>g dur<strong>in</strong>g pregnancy are contributory factors to th<strong>is</strong> particular group ofbabies. The association between smok<strong>in</strong>g <strong>and</strong> low birth weight was first reported <strong>in</strong> 1957. Themore <strong>the</strong> mo<strong>the</strong>r smokes <strong>the</strong> greater <strong>the</strong> r<strong>is</strong>k <strong>the</strong>re <strong>is</strong> to <strong>the</strong> baby. The average reduction <strong>in</strong>birth weight of a baby born to a smoker <strong>is</strong> of <strong>the</strong> order of 15 to 250 grams. Smok<strong>in</strong>g <strong>is</strong> alsoassociated with impairment of <strong>the</strong> child. The <strong>in</strong>creased r<strong>is</strong>k of per<strong>in</strong>atal mortality due tosmok<strong>in</strong>g has been estimated at 28 percent.Fiona Hunt<strong>in</strong>gton 6 of 47
Heavy alcohol consumption, particularly <strong>in</strong> <strong>the</strong> early stage of pregnancy can lead to a babybe<strong>in</strong>g born with foetal alcohol syndrome. Retarded growth <strong>is</strong> associated with th<strong>is</strong> syndrome.Women from poorer social backgrounds are one <strong>and</strong> a half times more likely to produce a lowbirth weight babyOn average <strong>in</strong> <strong>Engl<strong>and</strong></strong> <strong>and</strong> Wales, eight percent of births produce a low birth weight baby.<strong>Carl<strong>is</strong>le</strong> has a slightly lower than <strong>the</strong> national average of low birth weight babies at 7% (Clay2007)2. Ethni<strong>city</strong>.Table 2 <strong>is</strong> taken from <strong>the</strong> 2001 census <strong>and</strong> relates to peoples’ ethnic group <strong>and</strong> culturalbackground. In <strong>Engl<strong>and</strong></strong> <strong>and</strong> Wales populations are classified <strong>in</strong>to 16 groups.The table demonstrates that <strong>in</strong> <strong>Carl<strong>is</strong>le</strong> 97.82% of <strong>the</strong> population are classified as ‘WhiteBrit<strong>is</strong>h’. Th<strong>is</strong> <strong>is</strong> considerably higher than <strong>the</strong> national figure of 86.99%.The largest ethnic m<strong>in</strong>ority group <strong>in</strong> <strong>Carl<strong>is</strong>le</strong> <strong>is</strong> ‘White O<strong>the</strong>r’ which may represent <strong>the</strong> <strong>in</strong>creas<strong>in</strong>gnumber of people com<strong>in</strong>g <strong>in</strong>to <strong>the</strong> area from Pol<strong>and</strong>, Portugal <strong>and</strong> o<strong>the</strong>r European countries,<strong>and</strong> reflects <strong>the</strong> national picture.Interest<strong>in</strong>gly <strong>the</strong> third largest ethnic m<strong>in</strong>ority group <strong>in</strong> <strong>Engl<strong>and</strong></strong> <strong>is</strong> ‘Asian Indian’ which makes up2.09% of <strong>the</strong> population. However <strong>in</strong> <strong>Carl<strong>is</strong>le</strong> th<strong>is</strong> group makes up just 0.09% of <strong>the</strong> population.<strong>Carl<strong>is</strong>le</strong> has a large Gypsy / Traveller population, however <strong>the</strong>re <strong>is</strong> no ethnic cod<strong>in</strong>g identified forth<strong>is</strong> group, <strong>the</strong>refore no accurate data <strong>is</strong> available <strong>in</strong> relation to actual numbers of Gypsy/Travellers with<strong>in</strong> our population.Table 2: Ethni<strong>city</strong>.<strong>Carl<strong>is</strong>le</strong> North West <strong>Engl<strong>and</strong></strong>All People (Persons) Count 100,739 6,729,764 49,138,831White: Brit<strong>is</strong>h (Persons) Count 98,547 6,203,043 42,747,136White: Brit<strong>is</strong>h (Persons) % 97.82 92.17 86.99White: Ir<strong>is</strong>h (Persons) Count 523 77,499 624,115White: Ir<strong>is</strong>h (Persons) % 0.52 1.15 1.27White: O<strong>the</strong>r White (Persons) Count 776 74,953 1,308,110White: O<strong>the</strong>r White (Persons) % 0.77 1.11 2.66Mixed: White <strong>and</strong> Black Caribbean (Persons) Count 72 22,119 231,424Mixed: White <strong>and</strong> Black Caribbean (Persons) % 0.07 0.33 0.47Mixed: White <strong>and</strong> Black African (Persons) Count 47 9,853 76,498Mixed: White <strong>and</strong> Black African (Persons) 1 % 0.05 0.15 0.16Mixed: White <strong>and</strong> Asian (Persons) Count 94 17,223 184,014Mixed: White <strong>and</strong> Asian (Persons) % 0.09 0.26 0.37Mixed: O<strong>the</strong>r Mixed (Persons) Count 87 13,344 151,437Mixed: O<strong>the</strong>r Mixed (Persons) % 0.09 0.20 0.31Asian or Asian Brit<strong>is</strong>h: Indian (Persons) Count 94 72,219 1,028,546Asian or Asian Brit<strong>is</strong>h: Indian (Persons) % 0.09 1.07 2.09Asian or Asian Brit<strong>is</strong>h: Pak<strong>is</strong>tani (Persons) Count 48 116,968 706,539Asian or Asian Brit<strong>is</strong>h: Pak<strong>is</strong>tani (Persons) % 0.05 1.74 1.44Asian or Asian Brit<strong>is</strong>h: Bangladeshi (Persons) Count 85 26,003 275,394Asian or Asian Brit<strong>is</strong>h: Bangladeshi (Persons) % 0.08 0.39 0.56Asian or Asian Brit<strong>is</strong>h: O<strong>the</strong>r Asian (Persons) Count 57 14,685 237,810Asian or Asian Brit<strong>is</strong>h: O<strong>the</strong>r Asian (Persons) % 0.06 0.22 0.48Black or Black Brit<strong>is</strong>h: Caribbean (Persons) Count 16 20,422 561,246Black or Black Brit<strong>is</strong>h: Caribbean (Persons) % 0.02 0.30 1.14Black or Black Brit<strong>is</strong>h: African (Persons) Count 43 15,912 475,938Black or Black Brit<strong>is</strong>h: African (Persons) % 0.04 0.24 0.97Black or Black Brit<strong>is</strong>h: O<strong>the</strong>r Black (Persons) Count 11 5,303 95,324Black or Black Brit<strong>is</strong>h: O<strong>the</strong>r Black (Persons) % 0.01 0.08 0.19Fiona Hunt<strong>in</strong>gton 7 of 47
<strong>Carl<strong>is</strong>le</strong> North West <strong>Engl<strong>and</strong></strong>Ch<strong>in</strong>ese or o<strong>the</strong>r ethnic group: Ch<strong>in</strong>ese (Persons) Count 174 26,887 220,681Ch<strong>in</strong>ese or o<strong>the</strong>r ethnic group: Ch<strong>in</strong>ese (Persons) % 0.17 0.40 0.45Ch<strong>in</strong>ese or o<strong>the</strong>r ethnic group: O<strong>the</strong>r ethnic group (Persons) Count 65 13,331 214,619Ch<strong>in</strong>ese or o<strong>the</strong>r ethnic group: O<strong>the</strong>r ethnic group (Persons) % 0.06 0.20 0.443. Life ExpectancyLife expectancy <strong>is</strong> a measure of <strong>the</strong> average age a person can be expected to live if currentmortality trends were to cont<strong>in</strong>ue for <strong>the</strong> rest of that person’s life. It <strong>is</strong> based on <strong>the</strong> death ratescurrent at <strong>the</strong> time of birth <strong>and</strong> has traditionally been used as an <strong>in</strong>dicator to measure health<strong>in</strong>equality.Dur<strong>in</strong>g 2001 – 2005 life expectancy <strong>in</strong> <strong>Cumbria</strong> was 78.6 years.Total Life Expectancy for men liv<strong>in</strong>g <strong>in</strong> <strong>Carl<strong>is</strong>le</strong> <strong>is</strong> 75.5 years <strong>and</strong> 79.5 years for women. Th<strong>is</strong>compares with <strong>the</strong> average life expectancy for men <strong>in</strong> <strong>Engl<strong>and</strong></strong> which <strong>is</strong> 76 years <strong>and</strong> for womenwhich <strong>is</strong> 80.7 years.Figure 3 shows <strong>the</strong> life expectancy for <strong>the</strong> electoral wards <strong>in</strong> <strong>Carl<strong>is</strong>le</strong> City Council area for th<strong>is</strong>period.Only n<strong>in</strong>e of <strong>the</strong> twenty two wards have a life expectancy longer than <strong>the</strong> rest of <strong>Cumbria</strong>.Botcherby, Castle <strong>and</strong> Belle Vue have <strong>the</strong> lowest life expectancy be<strong>in</strong>g 74.8, 74.8 <strong>and</strong> 75.1respectively, while Burgh has <strong>the</strong> highest life expectancy be<strong>in</strong>g 83.9. Th<strong>is</strong> means that residentsof Burgh can expect to live for n<strong>in</strong>e years longer than residents of Botcherby.Figure 3: Life Expectancy: <strong>Carl<strong>is</strong>le</strong>Life Expectancy <strong>in</strong> <strong>Carl<strong>is</strong>le</strong> wards, 2001-20059088<strong>Cumbria</strong> LE=78.6868482LE (years)807876747270686664BurghGreat Corby And GeltsdaleHaytonLyneWe<strong>the</strong>ralStanwix UrbanIrth<strong>in</strong>gStanwix RuralBelahYewdaleDalstonWardBramptonSt AidansLongtown And RockcliffeHarrabyCurrockDenton HolmeUpperbyMortonBelle VueCastleBotcherbyFiona Hunt<strong>in</strong>gton 8 of 47
Figure 4: Compar<strong>is</strong>on of Life Expectancy: <strong>Carl<strong>is</strong>le</strong>.Difference <strong>in</strong> life expectancy of <strong>Carl<strong>is</strong>le</strong> wards <strong>in</strong> compar<strong>is</strong>on to <strong>the</strong> <strong>Cumbria</strong> average,2001-200565432Years10-1-2-3-4-5BotcherbyCastleBelle VueMortonUpperbyDenton HolmeCurrockHarrabyLongtown And RockcliffeSt AidansBramptonDalstonWardsYewdaleBelahStanwix RuralIrth<strong>in</strong>gStanwix UrbanWe<strong>the</strong>ralLyneHaytonGreat Corby And GeltsdaleBurghTotal life expectancy gives an estimate of <strong>the</strong> average years of life expectancy of <strong>in</strong>dividualswith<strong>in</strong> a population. It has traditionally been used as an <strong>in</strong>dicator to measure health <strong>in</strong>equality.However, it does not reflect differences <strong>in</strong> health status while people are still liv<strong>in</strong>g.3. Healthy Life Expectancy.Healthy Life Expectancy (HLE) represents <strong>the</strong> number of years that an <strong>in</strong>dividual can expect tolive <strong>in</strong> good health <strong>and</strong> provides a useful means of reflect<strong>in</strong>g morbidity with<strong>in</strong> a given population.Data relat<strong>in</strong>g to <strong>the</strong> period 1999-2003 (experimental stat<strong>is</strong>tics) <strong>in</strong>dicate that life expectancy forth<strong>is</strong> period <strong>is</strong> 77.4 years <strong>in</strong> <strong>Carl<strong>is</strong>le</strong> while healthy life expectancy <strong>is</strong> 69.9 years <strong>in</strong>dicat<strong>in</strong>g thatresidents of <strong>Carl<strong>is</strong>le</strong> can expect to spend around seven <strong>and</strong> a half years or 10% of <strong>the</strong>ir lives <strong>in</strong>poor health.Residents of Castle <strong>and</strong> Upperby can expect to live for around 75 years, <strong>the</strong>y can expect tospend around ten years or 13% of <strong>the</strong>ir lives <strong>in</strong> poor health, compared to residents of We<strong>the</strong>ralwho can expect to live for around 81 years <strong>and</strong> spend just five years or 6% of <strong>the</strong>ir lives <strong>in</strong> poorhealth.Figure 5 illustrates healthy life expectancy for each of <strong>the</strong> <strong>Carl<strong>is</strong>le</strong> wards.Fiona Hunt<strong>in</strong>gton 9 of 47
Figure 5: Healthy Life Expectancy by WardHealthy Life Expectancy Estimates, 1999-2003, <strong>Carl<strong>is</strong>le</strong> Wards9080706.696.775.855.016.176.475.267.076.597.297.088.115.798.128.637.687.148.249.7410.008.698.117.5060Years50403076.5174.9375.3576.1974.6373.2374.1472.0372.5171.3170.6269.5971.3168.4867.8768.6269.1667.8665.5664.765.7165.3969.920100HaytonStanwix UrbanBurghWe<strong>the</strong>ralGreat Corby <strong>and</strong> GeltsdaleLyneStanwix RuralBelahIrth<strong>in</strong>gYewdaleBramptonSt AidansWardDalstonHarrabyDenton HolmeCurrockLongtown & RockcliffeMortonUpperbyCastleBotcherbyBelle Vue<strong>Carl<strong>is</strong>le</strong>Years of life healthyYears of life unhealthyFigure 6 compares Male <strong>and</strong> Female Healthy Life ExpectancyFigure 6: Compar<strong>is</strong>on of male <strong>and</strong> Female Healthy Life Expectancy80.075.0Male life expectancy show <strong>in</strong>g number ofyears of healthy life (Census 2001)85.080.0Female life expectancy show<strong>in</strong>g number ofyears of healthy life (Census 2001)Life expectancy70.065.0Life expectancy75.070.065.060.060.055.0<strong>Carl<strong>is</strong>le</strong> North West <strong>Engl<strong>and</strong></strong>Not healthy (yrs)Healthy (yrs)55.0<strong>Carl<strong>is</strong>le</strong> North West <strong>Engl<strong>and</strong></strong>Not healthy (yrs)Healthy (yrs)4. Indices of Multiple Deprivation.The Index of Multiple Deprivation measures d<strong>is</strong>advantage with<strong>in</strong> populations averag<strong>in</strong>g around1,500 residents - <strong>the</strong> Lower Super Output Area Level. The IMD <strong>is</strong> based on <strong>in</strong>dividualcategories of deprivation which are identified <strong>and</strong> measured separately. These are <strong>the</strong>ncomb<strong>in</strong>ed <strong>in</strong>to a s<strong>in</strong>gle overall measure. The Index <strong>is</strong> made up of seven d<strong>is</strong>t<strong>in</strong>ct dimensions ofdeprivation called Doma<strong>in</strong> Indices.Fiona Hunt<strong>in</strong>gton 10 of 47
Lower Super Output areas are divided <strong>in</strong>to qu<strong>in</strong>tiles, depend<strong>in</strong>g upon <strong>the</strong>ir IMD Score. Eachqu<strong>in</strong>tile represents 20% of <strong>the</strong> population. Qu<strong>in</strong>tile One represents <strong>the</strong> <strong>most</strong> deprived areas,while Qu<strong>in</strong>tile Five represents <strong>the</strong> least deprived areas.Data at <strong>the</strong> Lower Super Output Area level can be aggregated to give an overall deprivationscore at electoral ward level. Figure 7 shows <strong>the</strong> IMD scores for <strong>the</strong> electoral wards with<strong>in</strong><strong>Carl<strong>is</strong>le</strong> <strong>and</strong> D<strong>is</strong>trict Local Authority, <strong>and</strong> illustrates <strong>the</strong> deprivation qu<strong>in</strong>tile for each ward.Figure 7: IMD Scores by Electoral WardIMD 2007-Ranks with<strong>in</strong> <strong>Cumbria</strong> by wards of <strong>Carl<strong>is</strong>le</strong> by doma<strong>in</strong>. (out of 167, 1 <strong>is</strong> <strong>most</strong> deprived)160160147140120126117110 109IMD Rank10080609690 887365604020403534 33282320 1811 100Stanwix UrbanWe<strong>the</strong>ralStanwix RuralGreat Corby <strong>and</strong> GeltsdaleLeastdeprivedBelahBurghYewdaleHaytonDalstonIrth<strong>in</strong>gBramptonLyneLongtown & RockcliffeDenton HolmeWardBelle VueSt AidansHarrabyCurrockMortonCastleBotcherbyUpperbyMostdeprivedWhen compar<strong>in</strong>g <strong>the</strong> data from Figure 7 with <strong>the</strong> life expectancy of residents with<strong>in</strong> <strong>the</strong> wards(Figure 3), <strong>the</strong> correlation between deprivation <strong>and</strong> life expectancy <strong>is</strong> apparent. Most notably <strong>the</strong>wards of Castle, Botcherby <strong>and</strong> Upperby are identified as experienc<strong>in</strong>g <strong>the</strong> highest levels ofdeprivation <strong>and</strong> <strong>the</strong> lowest years of life expectancy.5. Mortality <strong>and</strong> Morbidity.St<strong>and</strong>ard<strong>is</strong>ed Mortality ratios (SMRs) compare <strong>the</strong> number of deaths occurr<strong>in</strong>g <strong>in</strong> a populationwith <strong>the</strong> number expected by means of a ratio. A ratio greater than 100 means <strong>the</strong>re are moredeaths than expected <strong>and</strong> a ratio less than 100 means fewer deaths than expected.Major Causes of Death <strong>in</strong> <strong>Carl<strong>is</strong>le</strong>.6.1 Circulatory D<strong>is</strong>eases.The Department of Health Public Service Agreement has set a performance <strong>in</strong>dicator tosubstantially reduce mortality rates from heart d<strong>is</strong>ease <strong>and</strong> stroke by at least 40% <strong>in</strong> peopleunder <strong>the</strong> age of 75 by 2010. The target <strong>in</strong>cludes at least a 40% reduction <strong>in</strong> <strong>the</strong> <strong>in</strong>equalitiesgap between <strong>the</strong> fifth of areas with <strong>the</strong> worst health <strong>and</strong> deprivation <strong>in</strong>dicators i.e. <strong>the</strong>Spearhead areas, <strong>and</strong> <strong>the</strong> population as a whole.The overall mortality rate <strong>in</strong> <strong>Carl<strong>is</strong>le</strong> for circulatory d<strong>is</strong>eases <strong>in</strong> <strong>the</strong> under 75 age group <strong>is</strong> 125.Th<strong>is</strong> represents a mortality rate 25% higher than <strong>the</strong> national average.Fiona Hunt<strong>in</strong>gton 11 of 47
Table 3 shows st<strong>and</strong>ard<strong>is</strong>ed mortality rates for circulatory d<strong>is</strong>eases <strong>in</strong> people under <strong>the</strong> age of75 with<strong>in</strong> each of <strong>the</strong> electoral wards <strong>in</strong> <strong>Carl<strong>is</strong>le</strong>.The data l<strong>in</strong>ked to <strong>the</strong> happy faces mean that <strong>the</strong> SMR <strong>is</strong> stat<strong>is</strong>tically significantly better than <strong>the</strong>national average, while data l<strong>in</strong>ked to <strong>the</strong> sad faces <strong>in</strong>dicate that <strong>the</strong> SMR <strong>is</strong> significantly worsethan <strong>the</strong> national average.The data <strong>in</strong>dicate that eight of <strong>the</strong> twenty two wards <strong>in</strong> <strong>Carl<strong>is</strong>le</strong> have a significantly higher ratethan <strong>the</strong> national average for deaths from circulatory d<strong>is</strong>eases. Castle ward <strong>most</strong> notably has arate al<strong>most</strong> twice <strong>the</strong> national average for circulatory d<strong>is</strong>ease <strong>in</strong> <strong>the</strong> under 75 age group.Only Great Corby <strong>and</strong> Geltsdale ward has a significantly lower rate than nationally.Table 3: St<strong>and</strong>ard<strong>is</strong>ed Mortality Ratios for Circulatory D<strong>is</strong>ease <strong>in</strong> <strong>the</strong> Under 75 Age Group 2001-2005.expecteddeathsobserveddeaths SMR Rank (1 = best, 22 = worst)ward nameGreat Corby<strong>and</strong> Geltsdale 13.16 6 46 ☺ 1Burgh 11.64 8 69 2Irth<strong>in</strong>g 12.47 9 72 3Stanwix Urban 36.48 28 77 4Hayton 13.74 11 80 5Lyne 13.65 11 81 6We<strong>the</strong>ral 29.39 25 85 7Stanwix Rural 27.95 25 89 8Belah 36.91 37 100 9Yewdale 37.13 38 102 10Dalston 40.12 44 110 11Brampton 29.15 37 127 12St Aidans 27.13 36 133 13Morton 48.29 65 135 14Longtown &Rockcliffe 25.48 35 137 15Harraby 35.10 50 142 16Currock 26.36 42 159 17Denton Holme 25.20 41 163 18Botcherby 30.79 52 169 19Belle Vue 30.07 53 176 20Upperby 30.94 55 178 21Castle 25.66 51 199 22Directly st<strong>and</strong>ard<strong>is</strong>ed rates (DSRs) give an <strong>in</strong>dication of <strong>the</strong> number of events that would occur<strong>in</strong> a st<strong>and</strong>ard population, if <strong>the</strong> population had <strong>the</strong> same age-specific rates of <strong>the</strong> local area. Therates are calculated per 100,000 <strong>and</strong> because rates are applied to <strong>the</strong> same population, ratesacross areas can be compared.Figure 8 shows directly st<strong>and</strong>ard<strong>is</strong>ed rates <strong>in</strong> deaths <strong>in</strong> under 75s from circulatory d<strong>is</strong>eases for<strong>the</strong> period 1993 to 2006. We can see that <strong>the</strong> rate was 184 per 100,000 of <strong>the</strong> population <strong>in</strong>1993, reduc<strong>in</strong>g to 81 <strong>in</strong> 2006. Th<strong>is</strong> <strong>is</strong> a relatively steady decreas<strong>in</strong>g trend. The PSA target <strong>is</strong> 96deaths by 2010. Therefore if we cont<strong>in</strong>ue to ma<strong>in</strong>ta<strong>in</strong> <strong>the</strong> current mortality rate from circulatoryd<strong>is</strong>eases <strong>in</strong> th<strong>is</strong> age group we should meet th<strong>is</strong> target.Fiona Hunt<strong>in</strong>gton 12 of 47
Figure 8: DSRs for Circulatory D<strong>is</strong>ease <strong>in</strong> Under 75s200.00Mortality from all circulatory d<strong>is</strong>ease <strong>in</strong> persons aged under 75 yearsRate/100,000150.00100.0050.000.00YearEng & Wales <strong>Carl<strong>is</strong>le</strong> <strong>Carl<strong>is</strong>le</strong> trend81.24<strong>Carl<strong>is</strong>le</strong> Sav<strong>in</strong>g LivesTarget = 95.84 by 201093 94 95 96 97 98 99 0 01 02 03 04 05 06 07 08 09 106.2 Cancer.In relation to cancer, <strong>the</strong> st<strong>and</strong>ard<strong>is</strong>ed mortality ratio for all malignant neoplasms <strong>in</strong> <strong>Carl<strong>is</strong>le</strong> <strong>is</strong>102, i.e. 2% above <strong>the</strong> national average.Table 4 illustrates SMRs for malignant neoplasms at electoral ward level. Only three wards,those of Morton, Currock <strong>and</strong> Denton Holme have rates significantly higher than nationally.Most notably, residents of Denton Holme have a mortality rate for cancers around 52% higherthan nationally.Table 4: St<strong>and</strong>ard<strong>is</strong>ed Mortality ratios for all Malignant Neoplasms <strong>in</strong> <strong>the</strong> Under 75 age Group 2001- 2005ward nameexpecteddeathsobserveddeaths SMRRank (1 = best,22 = worst)Irth<strong>in</strong>g 15.60 10 64 1Great Corby<strong>and</strong> Geltsdale 16.40 11 67 2We<strong>the</strong>ral 35.97 26 72 3Stanwix Rural 34.19 26 76 4Hayton 17.08 13 76 5Lyne 17.04 13 76 6Dalston 48.92 38 78 7Yewdale 46.21 39 84 8Burgh 14.69 13 89 9Harraby 42.51 38 89 10Longtown &Rockcliffe 31.45 29 92 11Brampton 35.16 34 97 12Belah 45.17 44 97 13Stanwix Urban 44.18 45 102 14Belle Vue 37.48 40 107 15Castle 31.76 34 107 16St Aidans 33.30 38 114 17Botcherby 37.76 47 124 18Upperby 37.72 48 127 19Morton 56.35 76 135 20Currock 32.54 48 148 21Denton Holme 31.58 48 152 22Fiona Hunt<strong>in</strong>gton 13 of 47
The Department of Health has set a PSA target to reduce mortality rates from cancer by at least20% <strong>in</strong> <strong>the</strong> under 75 age group with a reduction <strong>in</strong> <strong>the</strong> <strong>in</strong>equalities gap of at least 6% between<strong>the</strong> Spearhead areas <strong>and</strong> <strong>the</strong> population as a whole.Figure 9: Mortality from all cancers <strong>in</strong> persons under age 75.Rate/100,000200.00150.00100.0050.000.00YearMortality from all cancers <strong>in</strong> persons aged under 75 yearsEng & Wales <strong>Carl<strong>is</strong>le</strong> <strong>Carl<strong>is</strong>le</strong> trend134.85<strong>Carl<strong>is</strong>le</strong> Sav<strong>in</strong>g LivesTarget = 124.70 by 201095 96 97 98 99 00 01 02 03 04 05 06 07 08 09 10Figure 9 shows a steady decrease <strong>in</strong> premature deaths from cancer between <strong>the</strong> years 1999<strong>and</strong> 2003.However more recently <strong>the</strong> trend appears to be <strong>in</strong>creas<strong>in</strong>g. In 2006 <strong>the</strong> death rate was 135 per100,000 of <strong>the</strong> population compared to 110 <strong>in</strong> 2003. If th<strong>is</strong> trend cont<strong>in</strong>ues we will not reach <strong>the</strong>target of 124.7 premature deaths from cancer by 2010.6.3 Respiratory D<strong>is</strong>eases.<strong>Carl<strong>is</strong>le</strong> has an overall mortality rate lower than <strong>the</strong> national average for respiratory d<strong>is</strong>eases <strong>in</strong><strong>the</strong> under 75 age group.Table 5 illustrates st<strong>and</strong>ard<strong>is</strong>ed Mortality Ratios for respiratory d<strong>is</strong>eases <strong>in</strong> <strong>the</strong> under 75 agegroup.Lyne, Belah <strong>and</strong> Yewdale all have significantly lower rates than nationally. However, Morton,Currock <strong>and</strong> Upperby have significantly higher rates. Upperby <strong>in</strong> particular has a mortality ratemore than twice <strong>the</strong> national average for <strong>the</strong>se conditions.Table 5: St<strong>and</strong>ard<strong>is</strong>ed Mortality Ratios for Respiratory D<strong>is</strong>eases <strong>in</strong> <strong>the</strong> Under 75 Age Group 2001-2005ward nameexpecteddeathsobserveddeaths SMR Rank (1= best, 22= worst)Lyne 3.80 .. 0.00 ☺ 1Hayton 3.85 .. 26 2Burgh 3.21 .. 31 3We<strong>the</strong>ral 8.28 .. 36 4Belah 10.45 .. 38 ☺ 5Yewdale 10.39 .. 39 ☺ 6Stanwix Rural 7.90 .. 51 7Great Corby <strong>and</strong>Geltsdale 3.67 .. 55 8Brampton 8.32 .. 60 9Dalston 11.38 7 62 10Irth<strong>in</strong>g 3.47 .. 86 11Stanwix Urban 10.37 9 87 12St Aidans 7.64 8 105 13Fiona Hunt<strong>in</strong>gton 14 of 47
Denton Holme 7.03 8 114 14Belle Vue 8.45 10 118 15Castle 7.23 9 125 16Longtown & Rockcliffe 7.17 9 126 17Botcherby 8.75 12 137 18Harraby 10.02 17 170 19Morton 14.07 24 171 20Currock 7.44 14 188 21Upperby 8.83 18 204 226. Under 18 Conceptions.The National Teenage Pregnancy strategy was launched by <strong>the</strong> government <strong>in</strong> 1999. There aretwo national target areas:• Halve <strong>the</strong> under 18 conception rate <strong>in</strong> <strong>Engl<strong>and</strong></strong> by 2010• Increase <strong>the</strong> participation of teenage mo<strong>the</strong>rs <strong>in</strong> education, tra<strong>in</strong><strong>in</strong>g or work to 60% by2010 to reduce <strong>the</strong> r<strong>is</strong>k of social exclusion.Table 6: Under 18 Conceptions1998-00 2001-03 2004-06 % change <strong>in</strong> rate98/00-04/06<strong>Carl<strong>is</strong>le</strong> 48 53.3 48.1 0.2%<strong>Cumbria</strong> 41.9 36.5 37.0 -9.7%<strong>Engl<strong>and</strong></strong> <strong>and</strong> Wales 45.4 42.7 41.3 -9%The basel<strong>in</strong>e conception rate <strong>in</strong> <strong>Carl<strong>is</strong>le</strong> dur<strong>in</strong>g 1998 - 2000 was 48 per 1,000 girls aged 15 to17 years (268 conceptions). Therefore a reduction of 50% would give a rate of 24 per 1,000(134 conceptions).While overall rates of teenage pregnancy <strong>in</strong> <strong>Cumbria</strong> are lower than <strong>the</strong> national average <strong>and</strong><strong>the</strong>re <strong>is</strong> a general downward trend of al<strong>most</strong> 10% on <strong>the</strong> basel<strong>in</strong>e, th<strong>is</strong> <strong>is</strong> not <strong>the</strong> case for<strong>Carl<strong>is</strong>le</strong>. Table 6 shows that teenage conceptions rema<strong>in</strong> well above <strong>the</strong> national average at arate of 48.1 per 1,000 of <strong>the</strong> population of girls age 15-17 years (272 pregnancies), an <strong>in</strong>creaseof 0.2% on <strong>the</strong> basel<strong>in</strong>e, <strong>and</strong> more than twice <strong>the</strong> target set to be achieved by 2010. Of <strong>the</strong>se272 conceptions122 will lead to abortion.Figure 10 shows <strong>the</strong> trend <strong>in</strong> teenage conceptions <strong>in</strong> <strong>Carl<strong>is</strong>le</strong>, <strong>in</strong> <strong>Cumbria</strong> <strong>and</strong> <strong>in</strong> <strong>Engl<strong>and</strong></strong> as awhole.Fiona Hunt<strong>in</strong>gton 15 of 47
Figure 10: Conceptions: Girls Age 15-17Rate of Population: Girls age 15-1760504030201001998-00 2001-03 2004-06<strong>Carl<strong>is</strong>le</strong><strong>Cumbria</strong><strong>Engl<strong>and</strong></strong>7. Abortions.Data relat<strong>in</strong>g to abortions are not available at Local Authority level, but are available at PrimaryCare Organ<strong>is</strong>ation level. Table 7 compares <strong>the</strong> rate of abortions per 1,000 women aged 15 – 44<strong>in</strong> <strong>Cumbria</strong> with rates for <strong>Engl<strong>and</strong></strong> as a whole. It relates to <strong>the</strong> year 2006.Table 7: Compar<strong>is</strong>on of abortion rates per 1,000 women resident 2006Total
Rates of obesity have dramatically <strong>in</strong>creased <strong>in</strong> <strong>Engl<strong>and</strong></strong> over <strong>the</strong> past decade.With obesity be<strong>in</strong>g responsible for more than 9,000 premature deaths per year.Obesity <strong>is</strong> an important r<strong>is</strong>k factor for a number of chronic d<strong>is</strong>eases such as heart d<strong>is</strong>ease,stroke, some cancers, <strong>and</strong> type 2 diabetes.Obese people are more likely to suffer from a number of psychological problems such as lowself-image <strong>and</strong> confidence, social stigma, reduced mobility <strong>and</strong> a poorer quality of life.Table 8 illustrates <strong>the</strong> proportion of adults <strong>in</strong> <strong>Carl<strong>is</strong>le</strong> who were underweight, healthy, overweight<strong>and</strong> obese. Less than half <strong>the</strong> population were a healthy weight while more than half <strong>the</strong>population were classed as be<strong>in</strong>g overweight or obese. Overall, a considerably higherproportion of men than women were overweight (42% of men compared to 29% of women),while <strong>the</strong> rates of obesity were similar between <strong>the</strong> sexes.The highest proportion of overweight men <strong>is</strong> <strong>in</strong> <strong>the</strong> 45 – 64 age groupTable 8: Body mass Index for <strong>Carl<strong>is</strong>le</strong> residents (2003)Underweight Healthy Overweight Obese5.3% 42.2% 36% 16.3%Childhood ObesityA major health target <strong>is</strong> to tackle <strong>the</strong> underly<strong>in</strong>g determ<strong>in</strong>ants of ill health <strong>and</strong> health <strong>in</strong>equalitiesby halt<strong>in</strong>g <strong>the</strong> year-on-year r<strong>is</strong>e <strong>in</strong> obesity among children. As a result <strong>the</strong> Department ofHealth has <strong>in</strong>troduced a national process to weigh <strong>and</strong> measure <strong>the</strong> heights <strong>and</strong> weights ofreception age (4-5 year olds) <strong>and</strong> Year 6 (10-11 year olds) school children.The results of <strong>the</strong> audit show that <strong>in</strong> <strong>Engl<strong>and</strong></strong> 9.9% of reception age children were recorded asbe<strong>in</strong>g obese compared to 10.1% <strong>in</strong> <strong>Cumbria</strong>. <strong>Carl<strong>is</strong>le</strong> appears to have higher levels of Maleobese (14.0%) children <strong>and</strong> Allerdale has <strong>the</strong> highest levels of female obese (10.7%) children.The obesity data for reception year pupils <strong>is</strong> shown <strong>in</strong> Figure 11.Figure 11: Childhood Obesity – Male <strong>and</strong> Female Reception Pupils: (2006/07)(Source: North West Public Health Observatory / Information16.0%14.0%13.7%14.0%12.0%Percentage10.0%(%)10.7%9.9%9.3%9.6%12.2%10.2%11.5%8.4%10.7%9.0%8.0%6.0%6.1%4.6%4.0%2.0%0.0%Allerdale Barrow <strong>Carl<strong>is</strong>le</strong> Copel<strong>and</strong> Eden South Lakel<strong>and</strong> <strong>Engl<strong>and</strong></strong>AreaFiona Hunt<strong>in</strong>gton 17 of 47
The results of <strong>the</strong> audit show that <strong>in</strong> <strong>Engl<strong>and</strong></strong> 17.5% of Year 6 age children were recorded asbe<strong>in</strong>g obese compared to 15.5% <strong>in</strong> <strong>Cumbria</strong>. In <strong>Carl<strong>is</strong>le</strong> 16% of year 6 boys were recorded asbe<strong>in</strong>g obese <strong>and</strong> 12.2% of girls. Th<strong>is</strong> compares with <strong>the</strong> average of 19% of boys <strong>in</strong> <strong>Engl<strong>and</strong></strong>be<strong>in</strong>g classed as obese <strong>and</strong> 15.8% of girls. The obesity data for Year 6 pupils <strong>is</strong> shown <strong>in</strong>Figure 12.Figure 12: Childhood Obesity. Male <strong>and</strong> Female Year 6 Pupils: 2006/07 (NWPHO)30.0%25.0%23.9%19.8%20.0%Percentage (%)16.9%16.0% 16.0%18.0%20.8%19.0%15.8%15.0%14.1%12.2%13.5%12.1%10.5%10.0%5.0%0.0%Allerdale Barrow <strong>Carl<strong>is</strong>le</strong> Copel<strong>and</strong> Eden South Lakel<strong>and</strong> <strong>Engl<strong>and</strong></strong>Area9.2 Physical Activity.Regular exerc<strong>is</strong>e <strong>and</strong> activity reduces <strong>the</strong> <strong>in</strong>cidence of obesity, <strong>and</strong> <strong>is</strong> a preventive measure fora number of long term conditions. Inadequate access to opportunities for exerc<strong>is</strong>e can be animportant factor <strong>in</strong> health <strong>in</strong>equalities. Current recommendations are that adults should take am<strong>in</strong>imum of 30 m<strong>in</strong>utes of moderate activity at least five times a week. For children <strong>and</strong> youngpeople <strong>the</strong> recommendation <strong>is</strong> for one hour of moderate level activity each day (Department ofHealth 1996).The 2006 <strong>Cumbria</strong> Quality of Life Survey (<strong>Cumbria</strong> County Council 2006) found that 31% of<strong>Carl<strong>is</strong>le</strong> residents exerc<strong>is</strong>ed daily, while 23% exerc<strong>is</strong>ed between four <strong>and</strong> six times a week(Figure 13). Th<strong>is</strong> <strong>in</strong>dicates that less than 54% of <strong>Carl<strong>is</strong>le</strong> residents are tak<strong>in</strong>g <strong>the</strong> recommendedamount of exerc<strong>is</strong>e.Figure 13 Exerc<strong>is</strong>e Levels <strong>Carl<strong>is</strong>le</strong> ResidentsFiona Hunt<strong>in</strong>gton 18 of 47
Moderate exerc<strong>is</strong>eQ How often do you take moderate exerc<strong>is</strong>e?Every day31%<strong>Cumbria</strong>%324-6 times a week23%211-3 times a week28%29More than once amonth, but lessthan once a weekLess than once amonth2%10%73Never4%4Base: 2,1529.3 Balanced Eat<strong>in</strong>g.Eat<strong>in</strong>g a m<strong>in</strong>imum of five portions of fruit <strong>and</strong> vegetables each day has been shown tosignificantly reduce <strong>the</strong> r<strong>is</strong>k of heart d<strong>is</strong>ease, stroke <strong>and</strong> some cancers by up to 20%. Figure 14illustrates <strong>the</strong> daily fruit <strong>and</strong> vegetable consumption by residents of <strong>Carl<strong>is</strong>le</strong> dur<strong>in</strong>g 2003.Only 16.6% of <strong>Carl<strong>is</strong>le</strong> residents ate at least five portions of fruit <strong>and</strong> vegetables each day.Women were <strong>in</strong>cl<strong>in</strong>ed to eat more fruit <strong>and</strong> vegetables than men, while 5.4% of men ate no fruit<strong>and</strong> vegetables compared to 2.3% of women.Figure 14: Daily Fruit <strong>and</strong> Vegetable Consumption.Daily Fruit <strong>and</strong> Vegetable ConsumptionPercentage100%90%80%70%60%50%40%30%20%10%0%16.6% 13.8% 19.5%16.5%13.5%19.6%26.1%24.3%27.9%22.0%24.0%19.9%15.0%19.0%10.8%3.9% 5.4% 2.3%<strong>Carl<strong>is</strong>le</strong> <strong>and</strong>D<strong>is</strong>trictMaleFemale5432109.4 Fried Food.Eat<strong>in</strong>g foods which are high <strong>in</strong> saturated fats <strong>is</strong> associated with ra<strong>is</strong>ed blood cholesterol levels,which <strong>in</strong> turn <strong>is</strong> l<strong>in</strong>ked to an <strong>in</strong>creased r<strong>is</strong>k of develop<strong>in</strong>g coronary heart d<strong>is</strong>ease.Fried foods are high <strong>in</strong> saturated fats <strong>and</strong> should be avoided.Fiona Hunt<strong>in</strong>gton 19 of 47
The North <strong>Cumbria</strong> Health <strong>and</strong> Lifestyle Survey (2003) found that 55% of <strong>Carl<strong>is</strong>le</strong> residents didnot eat fried food. However more than a third of residents said <strong>the</strong>y ate fried food once or twicea week while 8% stated that <strong>the</strong>y ate it between three <strong>and</strong> six times a week. Figure 15 showshow regularly people ate fried food on a weekly bas<strong>is</strong> while Figure 16 compares <strong>the</strong> differencebetween <strong>the</strong> genders <strong>in</strong> <strong>the</strong> consumption of fried food. More men reported eat<strong>in</strong>g fried food thanwomen with three times as many men as women report<strong>in</strong>g eat<strong>in</strong>g it three to six times a week<strong>and</strong> twice as many men as women reported eat<strong>in</strong>g fried food on a daily bas<strong>is</strong>.Figure 15: Fried Food Consumption.Fried Food ComsumptionPercentage of Population100%80%60%40%20%0%66.33 28.64 4.12 0.945.0940.0312.23 2.6555.45 34.8 8.2 1.8None 1-2timesweek3-6timesweekoncedayWomenMen<strong>Carl<strong>is</strong>le</strong> <strong>and</strong>D<strong>is</strong>trictWeekly ConsumptionFigure 16: Fried Food Consumption by GenderFiona Hunt<strong>in</strong>gton 20 of 47
Fried Food Consumption by GenderPercentage of <strong>the</strong> Population7060504030201000 1-2times aweek3-6times aweekonce adayMenWomenFrequency of Consumption9.5 Smok<strong>in</strong>g.Smok<strong>in</strong>g kills around 112,000 people <strong>in</strong> <strong>the</strong> UK each year, about six times more people than arekilled by road traffic accidents <strong>and</strong> represents one fifth of all UK deaths. About half of all regularsmokers will eventually be killed by <strong>the</strong>ir habit, with <strong>most</strong> smok<strong>in</strong>g related deaths be<strong>in</strong>g due tothree ma<strong>in</strong> d<strong>is</strong>eases: cancer, chronic obstructive lung d<strong>is</strong>ease <strong>and</strong> coronary heart d<strong>is</strong>ease.Each year 17,000 children under <strong>the</strong> age of five are admitted to hospital with illnesses causedby passive smok<strong>in</strong>g.There <strong>is</strong> a d<strong>is</strong>parity <strong>in</strong> smok<strong>in</strong>g rates between <strong>the</strong> socio-economic groups with around 16% ofmen <strong>in</strong> higher managerial occupations smok<strong>in</strong>g, compared to 38% of men <strong>in</strong> rout<strong>in</strong>eoccupations.Currently <strong>the</strong>re are no accurate local figures for <strong>the</strong> number of people who smoke <strong>in</strong> <strong>Carl<strong>is</strong>le</strong>.Such data that are available relate to national stat<strong>is</strong>tics for smokers which have been applied to<strong>the</strong> population of <strong>Carl<strong>is</strong>le</strong> to provide an approximation of <strong>the</strong> actual local figures.Current national smok<strong>in</strong>g prevalence <strong>is</strong> reported as be<strong>in</strong>g 22% (Ash 2008). In <strong>Carl<strong>is</strong>le</strong> <strong>in</strong> 2006th<strong>is</strong> represents 10,400 men <strong>and</strong> 9,900 women. A total of 20,300 smokers liv<strong>in</strong>g <strong>in</strong> <strong>the</strong> <strong>city</strong>.Research evidence shows that around half of all regular smokers will eventually die as a directresult of <strong>the</strong>ir smok<strong>in</strong>g addiction. In <strong>Carl<strong>is</strong>le</strong> th<strong>is</strong> represents 10,150 people. However, thosesmokers who choose to stop will significantly reduce <strong>the</strong>ir r<strong>is</strong>k of develop<strong>in</strong>g a fatal d<strong>is</strong>ease.Figure 17 illustrates <strong>the</strong> variation <strong>in</strong> levels of smok<strong>in</strong>g <strong>in</strong> <strong>Carl<strong>is</strong>le</strong> with 39% of people smok<strong>in</strong>g <strong>in</strong>Botcherby ward compared to only 19% <strong>in</strong> Stanwix Urban ward.Figure 17: Percentage of Smokers by Electoral Ward <strong>in</strong> <strong>Carl<strong>is</strong>le</strong>Fiona Hunt<strong>in</strong>gton 21 of 47
Percentage (%)454035302520151050BotcherbyCastleUpperbyDenton HolmeSt AidansMortonCurrockLongtown & RockcliffeHarrabyBelle VueBelahYewdaleStanwix RuralBurghLyneHaytonBramptonIrth<strong>in</strong>gDalstonStanwix Urban<strong>Cumbria</strong> Primary Care Trust’s <strong>NHS</strong> Stop Smok<strong>in</strong>g Service operates twenty three cl<strong>in</strong>ics eachweek <strong>in</strong> <strong>Carl<strong>is</strong>le</strong>, with three Special<strong>is</strong>t Stop Smok<strong>in</strong>g Adv<strong>is</strong>ors provid<strong>in</strong>g advice <strong>and</strong> support aswell as pharmaco<strong>the</strong>rapies for smokers w<strong>is</strong>h<strong>in</strong>g to quit.For <strong>the</strong> six month period 01.04.2007 to 30.09.2007 <strong>in</strong> <strong>Carl<strong>is</strong>le</strong>, 186 people who had set a quitdate through <strong>the</strong> Stop Smok<strong>in</strong>g Service were successful at <strong>the</strong> four-week follow-up.9.6 Alcohol.Dr<strong>in</strong>k<strong>in</strong>g excessive amounts of alcohol <strong>is</strong> associated with both physical <strong>and</strong> mental healthproblems.The r<strong>is</strong>ks associated with heavy dr<strong>in</strong>k<strong>in</strong>g <strong>in</strong>clude liver d<strong>is</strong>ease, nutritional problems, pancreatit<strong>is</strong>,<strong>and</strong> heart d<strong>is</strong>ease as well as depression, dementia <strong>and</strong> memory loss.The maximum recommended number of units of alcohol each day <strong>is</strong> 2 - 3 for women <strong>and</strong> 3 – 4for men. Research evidence suggests that people dr<strong>in</strong>k<strong>in</strong>g with<strong>in</strong> <strong>the</strong>se limits should not sufferalcohol related adverse health effects.The 2003 Health <strong>and</strong> Lifestyle Survey identified that 27.2% of men <strong>and</strong> 17.8% of women <strong>in</strong><strong>Carl<strong>is</strong>le</strong> were dr<strong>in</strong>k<strong>in</strong>g over <strong>the</strong> recommended units of alcohol weekly.In <strong>the</strong> period 2005 / 2006, data relat<strong>in</strong>g to hospital adm<strong>is</strong>sions <strong>in</strong>dicate that <strong>the</strong>re were 454people admitted for alcohol specific conditions. Th<strong>is</strong> was a n<strong>in</strong>e per cent decrease from <strong>the</strong>basel<strong>in</strong>e year of 1999 / 2000. However th<strong>is</strong> does not reflect a downward trend as <strong>the</strong> data<strong>in</strong>dicate a general annual variation. (Figure18).Figure 18: Hospital Adm<strong>is</strong>sions for Alcohol Specific ConditionsFiona Hunt<strong>in</strong>gton 22 of 47
Hospital Adm<strong>is</strong>sions for AlcoholSpecific ConditionsNumber of Adm<strong>is</strong>sions6005004003002001000199/002000/012001/022002/032003/042004/052005/06Year9. Income.It <strong>is</strong> well recogn<strong>is</strong>ed that higher mortality <strong>and</strong> worse health status occur <strong>in</strong> societies with higher<strong>in</strong>come <strong>in</strong>equality. The relationship between <strong>in</strong>come <strong>in</strong>equality <strong>and</strong> health appears to bedeterm<strong>in</strong>ed both by relative access to resources for health ga<strong>in</strong> <strong>and</strong> to comparative socialposition. (Massey 2007).Figure 19 compares <strong>the</strong> mean <strong>in</strong>come of households <strong>in</strong> <strong>the</strong> six <strong>Cumbria</strong>n local authorities. Wecan see that <strong>the</strong> average annual household <strong>in</strong>come <strong>in</strong> <strong>Cumbria</strong> <strong>is</strong> £30,676. while <strong>the</strong> averagefor <strong>Carl<strong>is</strong>le</strong> <strong>is</strong> slightly above th<strong>is</strong> figure at £31,117.Figure 19: Compar<strong>is</strong>on of Mean IncomeMean Modelled Household Income, 2007, by Local Authority£32,000£31,687£31,534£31,252£31,117£31,000<strong>Cumbria</strong> = 30,676£30,255£30,000Pounds sterl<strong>in</strong>g£29,000£28,000£28,210£27,000£26,000Sth Lakel<strong>and</strong> Copel<strong>and</strong> Eden <strong>Carl<strong>is</strong>le</strong> Allerdale BarrowLocalityFigure 20 compares <strong>the</strong> annual mean household <strong>in</strong>come <strong>in</strong> <strong>Carl<strong>is</strong>le</strong> by ward. We can see that <strong>in</strong>Hayton ward <strong>the</strong> average household <strong>in</strong>come <strong>is</strong> £37,735, while <strong>in</strong> Morton it <strong>is</strong> just £23,924.Th<strong>is</strong> represents a difference of al<strong>most</strong> £14,000.Fiona Hunt<strong>in</strong>gton 23 of 47
Figure 20: Annual Mean Household Income by Ward.Modelled Mean Household Income, 2007, by wards <strong>in</strong> <strong>Carl<strong>is</strong>le</strong>£40,000£35,000£30,000<strong>Carl<strong>is</strong>le</strong> Mean = 31,117Pounds sterl<strong>in</strong>g£25,000£20,000£15,000£10,000£5,000£0HaytonWe<strong>the</strong>ralBurghStanwix RuralGreat Corby <strong>and</strong> GeltsdaleDalstonStanwix UrbanBelahYewdaleIrth<strong>in</strong>gLyneBelle VueBramptonLongtown & RockcliffeSt AidansDenton HolmeCastleCurrockHarrabyBotcherbyUpperbyMortonWardIn relation to <strong>the</strong> correlation between mortality <strong>and</strong> <strong>in</strong>come we can see that <strong>the</strong> average lifeexpectancy <strong>in</strong> Hayton <strong>is</strong> 82.1 years. Th<strong>is</strong> <strong>is</strong> 3.5 years above <strong>the</strong> <strong>Cumbria</strong> average. However, lifeexpectancy <strong>is</strong> just 76 years <strong>in</strong> Morton ward. Th<strong>is</strong> <strong>is</strong> 2.6 years below <strong>the</strong> average for <strong>Cumbria</strong>.A fur<strong>the</strong>r correlation <strong>is</strong> demonstrated between <strong>in</strong>come <strong>and</strong> health.While residents of Hayton have a healthy life expectancy of 76.5 years, residents of Morton canexpect to rema<strong>in</strong> healthy for 67.9 years. Therefore people <strong>in</strong> Hayton are likely to rema<strong>in</strong> healthyfor more than eight years longer than <strong>the</strong> residents of Morton.11. Employment.Research evidence strongly supports an association between unemployment <strong>and</strong> a greater r<strong>is</strong>kof both physical <strong>and</strong> mental illness at both <strong>the</strong> <strong>in</strong>dividual <strong>and</strong> <strong>the</strong> population levels.Unemployment <strong>is</strong> also associated with a greater r<strong>is</strong>k of mortality at <strong>the</strong> population level (J<strong>in</strong> et al1995).<strong>Carl<strong>is</strong>le</strong> has a slightly lower rate of unemployment than <strong>the</strong> rest of <strong>the</strong> North West region <strong>and</strong><strong>Engl<strong>and</strong></strong>, be<strong>in</strong>g 4.5 compared to 5.4 for <strong>the</strong> North West <strong>and</strong> 5.5 for <strong>Engl<strong>and</strong></strong>.Figure 21 shows unemployment <strong>in</strong> <strong>Carl<strong>is</strong>le</strong> dur<strong>in</strong>g <strong>the</strong> Month of December 2007.When compared with Figure 17 we can see that <strong>the</strong>re appears to be an association betweenlevels of unemployment <strong>and</strong> levels of smok<strong>in</strong>g, with higher concentrations of smokers <strong>in</strong> <strong>the</strong>wards with <strong>the</strong> highest rates of unemployment. Th<strong>is</strong> reflects <strong>the</strong> national picture of <strong>the</strong> greatestrates of smok<strong>in</strong>g be<strong>in</strong>g found <strong>in</strong> <strong>the</strong> <strong>most</strong> deprived areas.Figure 21: Unemployment by WardFiona Hunt<strong>in</strong>gton 24 of 47
Unemployment by WardRate of ResidentWork<strong>in</strong>g AgePopulation6543210CastleUpperbyBotcherbyBramptonBelle VueCurrockSt AidansMortonDentonHarrabyBelahLongtownBurghHaytonGreatYewdaleDalstonIrth<strong>in</strong>gLyneStanwixStanwixWe<strong>the</strong>ralWardMale Female All PersonsFigure 22 illustrates <strong>the</strong> average gross weekly pay of <strong>Carl<strong>is</strong>le</strong> residents. Both men <strong>and</strong> womenwith<strong>in</strong> <strong>Carl<strong>is</strong>le</strong> are on average earn<strong>in</strong>g less than all o<strong>the</strong>r <strong>Cumbria</strong>n local authorities with <strong>the</strong>exception of Eden D<strong>is</strong>trict. They are also earn<strong>in</strong>g considerably less than men <strong>and</strong> women <strong>in</strong> <strong>the</strong>North West Region.Figure 22: Median Gross Weekly Pay of <strong>Carl<strong>is</strong>le</strong> Residents.Median Gross Weekly Pay, 2007, by sex of residentsPounds sterl<strong>in</strong>g700600500400300200100647.4283.3MaleFemaleMale North WestFemale North West454.1 441.8 428.2 427.8403.1383.2240.2 247.1 260.6239.6 233.9 222.40Copel<strong>and</strong> Allerdale <strong>Cumbria</strong> SouthLakel<strong>and</strong>Barrow-<strong>in</strong>-Furness<strong>Carl<strong>is</strong>le</strong>EdenLocality12. People Claim<strong>in</strong>g Benefits.<strong>Carl<strong>is</strong>le</strong> has a slightly higher than <strong>the</strong> average proportion of people of work<strong>in</strong>g age claim<strong>in</strong>g akey benefit than <strong>the</strong> rest of <strong>Engl<strong>and</strong></strong>, but a considerably lower proportion than <strong>Cumbria</strong> as awhole.Fiona Hunt<strong>in</strong>gton 25 of 47
In relation to Job Seekers Allowance claimants, <strong>Carl<strong>is</strong>le</strong> reflects <strong>the</strong> same picture as <strong>the</strong>national average <strong>and</strong> slightly lower than <strong>the</strong> North West.For Incapa<strong>city</strong> Benefit, <strong>Carl<strong>is</strong>le</strong> has a slightly higher than <strong>the</strong> national average of claimants but<strong>is</strong> lower than <strong>the</strong> average for <strong>the</strong> North West (Table9).Table 9: Percentage of People Claim<strong>in</strong>g a Key BenefitPersons August 2005 <strong>Carl<strong>is</strong>le</strong> North <strong>Engl<strong>and</strong></strong>WestAll people of work<strong>in</strong>g age % 15 18 14claim<strong>in</strong>g a key benefitJob Seekers % 2 3 2Incapa<strong>city</strong> Benefit % 8 10 713. Hous<strong>in</strong>g.Figure 23: Household OwnershipHousehold Ownership1%Owned outright56%43%Owned with mortgage orloanShared ownership71% of people <strong>in</strong> <strong>Carl<strong>is</strong>le</strong> own <strong>the</strong>ir own house ei<strong>the</strong>r outright or with a mortgage or loan. 2% ofpeople are classed as liv<strong>in</strong>g rent free <strong>and</strong> th<strong>is</strong> appears to largely represent those <strong>in</strong> <strong>the</strong>hospitality trade who live <strong>in</strong> staff quarters, although some occupations will <strong>in</strong>clude tiedaccommodation.Figure 24: Household Tenure.Household Tenure27%2%71%OwnedRentedRent FreeOf those liv<strong>in</strong>g <strong>in</strong> rented accommodation, 69% live <strong>in</strong> social rented properties ei<strong>the</strong>r through <strong>the</strong>local authority or a hous<strong>in</strong>g association, while 31% are rented from a private l<strong>and</strong>lord.Fiona Hunt<strong>in</strong>gton 26 of 47
Figure 25: Rented AccommodationRented Accommodation31%69%Social RentedPrivate Rented12% of households <strong>in</strong> <strong>Carl<strong>is</strong>le</strong> have no central heat<strong>in</strong>g. Th<strong>is</strong> compares to 8% for <strong>Engl<strong>and</strong></strong>.While 4% of <strong>Carl<strong>is</strong>le</strong> households are classed as be<strong>in</strong>g overcrowded compared to 7% <strong>in</strong><strong>Engl<strong>and</strong></strong>.14. Homelessness.On 31 st March 2005 <strong>the</strong>re were 285 households <strong>in</strong> <strong>Carl<strong>is</strong>le</strong> which were def<strong>in</strong>ed as eligible,un<strong>in</strong>tentionally homeless <strong>and</strong> <strong>in</strong> priority need, for which <strong>the</strong> Local Authority acceptsresponsibility for secur<strong>in</strong>g accommodation (ODPM 2005). Th<strong>is</strong> represents 9.3% of <strong>the</strong> totalhouseholds on <strong>the</strong> <strong>Carl<strong>is</strong>le</strong> Hous<strong>in</strong>g Reg<strong>is</strong>ter.15. Excess W<strong>in</strong>ter Deaths.Mortality <strong>in</strong> <strong>Engl<strong>and</strong></strong> <strong>and</strong> Wales <strong>in</strong>creases more than o<strong>the</strong>r European countries with colderclimates. Studies f<strong>in</strong>d that regions with warm w<strong>in</strong>ters such as <strong>Engl<strong>and</strong></strong> have cooler homes <strong>and</strong>take fewer protective measures aga<strong>in</strong>st <strong>the</strong> cold. The number of extra deaths occurr<strong>in</strong>g <strong>in</strong> w<strong>in</strong>tervaries depend<strong>in</strong>g upon <strong>the</strong> temperature <strong>and</strong> level of d<strong>is</strong>ease (particularly ‘flu) <strong>in</strong> <strong>the</strong> populationas well as o<strong>the</strong>r factors. The elderly (age 75+) experience <strong>the</strong> greatest <strong>in</strong>crease <strong>in</strong> deaths eachw<strong>in</strong>ter.Excess w<strong>in</strong>ter deaths are def<strong>in</strong>ed as <strong>the</strong> difference between <strong>the</strong> number of deaths dur<strong>in</strong>g <strong>the</strong>four w<strong>in</strong>ter months (December – March) <strong>and</strong> <strong>the</strong> average number of deaths dur<strong>in</strong>g <strong>the</strong>preced<strong>in</strong>g autumn (August – November) <strong>and</strong> <strong>the</strong> follow<strong>in</strong>g summer (April – July). In <strong>Carl<strong>is</strong>le</strong>dur<strong>in</strong>g 2005 / 06 <strong>the</strong>re were a total of 60 excess w<strong>in</strong>ter deaths. Th<strong>is</strong> gives an excess w<strong>in</strong>terdeaths <strong>in</strong>dex of 17%. Th<strong>is</strong> compares to <strong>Cumbria</strong> as a whole where <strong>the</strong> excess w<strong>in</strong>ter deaths<strong>in</strong>dex for 2005 / 06 was 14%.16. Deaths From Suicide.The Government’s White Paper “Sav<strong>in</strong>g Lives: Our Healthier Nation” (1999) set a target toreduce <strong>the</strong> death rate from suicide <strong>and</strong> undeterm<strong>in</strong>ed <strong>in</strong>jury by at least a fifth by <strong>the</strong> year 2010.The likelihood of a person committ<strong>in</strong>g suicide <strong>is</strong> related to a number of factors. These <strong>in</strong>cludephysically d<strong>is</strong>abl<strong>in</strong>g or pa<strong>in</strong>ful illnesses, mental illness, alcohol <strong>and</strong> drug m<strong>is</strong>use <strong>and</strong> level ofsupport. Stressful life events such as <strong>the</strong> loss of a job, impr<strong>is</strong>onment, a death or divorce canalso play a part. For many people it <strong>is</strong> a comb<strong>in</strong>ation of factors which <strong>is</strong> important, ra<strong>the</strong>r than as<strong>in</strong>gle factor.Official suicides are those <strong>in</strong> which <strong>the</strong> coroner or official recorder has decided that <strong>the</strong>re <strong>is</strong>clear evidence that <strong>the</strong> <strong>in</strong>jury was self-<strong>in</strong>flicted <strong>and</strong> <strong>the</strong> deceased <strong>in</strong>tended to take <strong>the</strong>ir own life.Open verdicts or undeterm<strong>in</strong>ed <strong>in</strong>jury are those where <strong>the</strong>re may be doubt about <strong>the</strong>Fiona Hunt<strong>in</strong>gton 27 of 47
deceased’s <strong>in</strong>tentions. Research studies show that <strong>most</strong> open verdicts are <strong>in</strong> fact suicides. For<strong>the</strong> purpose of measur<strong>in</strong>g overall suicides, official suicides <strong>and</strong> open verdicts are comb<strong>in</strong>ed.Men are more likely to commit suicide than women. The majority of suicides occur <strong>in</strong> youngmale adults under <strong>the</strong> age of 40.In <strong>Carl<strong>is</strong>le</strong> dur<strong>in</strong>g <strong>the</strong> period 2003 – 05 <strong>the</strong>re were 23 male suicides compared to 10 females, adirectly st<strong>and</strong>ard<strong>is</strong>ed rate of 23.4 men to 6.2 women. Therefore <strong>in</strong> <strong>Carl<strong>is</strong>le</strong>, men are al<strong>most</strong> fourtimes more likely to commit suicide than women. Th<strong>is</strong> compares with al<strong>most</strong> three to onenationally. <strong>Carl<strong>is</strong>le</strong> has a male suicide rate that <strong>is</strong> al<strong>most</strong> twice <strong>the</strong> national average <strong>and</strong> afemale suicide rate above <strong>the</strong> national average.There <strong>is</strong> an association between deprivation <strong>and</strong> suicide with rates be<strong>in</strong>g highest <strong>in</strong> <strong>the</strong> <strong>most</strong>deprived areas. Overall <strong>in</strong> <strong>Cumbria</strong> <strong>the</strong> rate of suicide <strong>in</strong> <strong>the</strong> <strong>most</strong> deprived areas <strong>is</strong> 18 per100,000 population compared to 7.1 <strong>in</strong> <strong>the</strong> least deprived.Figure 26: Mortality from Suicide25.00Mortality from all suicide <strong>and</strong> <strong>in</strong>jury undeterm<strong>in</strong>ed, persons, all agesRate/100,00020.0015.0010.005.000.00Eng & Wales <strong>Carl<strong>is</strong>le</strong> <strong>Carl<strong>is</strong>le</strong> trend16.2393 94 95 96 97 98 99 00 01 02 03 04 05 Year<strong>Carl<strong>is</strong>le</strong> Sav<strong>in</strong>g LivesTarget = 9.28 by 2010Figure 26 shows <strong>the</strong> suicide trend for <strong>Carl<strong>is</strong>le</strong> <strong>and</strong> D<strong>is</strong>trict. From a rate of 7.9 per 100,000 of <strong>the</strong>population <strong>in</strong> 1993, suicides peaked <strong>in</strong> 2004 at a level of 19.2. 2005 has seen a fall to a rate of16.2; however th<strong>is</strong> <strong>is</strong> al<strong>most</strong> twice <strong>the</strong> national average. If <strong>the</strong> current trend cont<strong>in</strong>ues <strong>Carl<strong>is</strong>le</strong>will fail to reach its target rate of 9.3 by 2010 as clearly shown by <strong>the</strong> trend data.17. Problem Drug Use.The Drug StrategyThe Drug Strategy <strong>is</strong> a cross-Government programme of policies <strong>and</strong> <strong>in</strong>terventions thatconcentrate on <strong>the</strong> <strong>most</strong> dangerous drugs, <strong>the</strong> <strong>most</strong> damaged communities <strong>and</strong> problematicdrug users. The strategy compr<strong>is</strong>es four str<strong>and</strong>s of work• prevent<strong>in</strong>g young people from becom<strong>in</strong>g drug m<strong>is</strong>users• reduc<strong>in</strong>g <strong>the</strong> supply of illegal drugs• <strong>in</strong>creas<strong>in</strong>g <strong>the</strong> number of <strong>in</strong>dividuals access<strong>in</strong>g effective drug treatment• <strong>and</strong> reduc<strong>in</strong>g drug-related crimeDrug action teams (DATs) are <strong>the</strong> partnerships responsible for deliver<strong>in</strong>g <strong>the</strong> drug strategy at alocal level.Dur<strong>in</strong>g <strong>the</strong> period 2006 /07 <strong>the</strong>re were 114 offenders whose offence was attributed to Class ADrug offences <strong>in</strong> <strong>Carl<strong>is</strong>le</strong>. Th<strong>is</strong> represents 24% of <strong>the</strong> total 474 drug offenders <strong>in</strong> <strong>the</strong> county, justbeh<strong>in</strong>d Barrow which was 25%.Figure 27 illustrates <strong>the</strong> proportion of drug offences by local authority <strong>in</strong> <strong>Cumbria</strong>.Fiona Hunt<strong>in</strong>gton 28 of 47
Figure 27: Proportion of Class A drug offences by local authority.Proportion of Class A Drug Offences 2006/07 by LocalAuthority 2006/07Copel<strong>and</strong>11%Eden5%Barrow25%South Lakes14%Allerdale21%<strong>Carl<strong>is</strong>le</strong>24%Dur<strong>in</strong>g th<strong>is</strong> time period <strong>the</strong> great proportion of illegal substance use <strong>in</strong> East <strong>Cumbria</strong> was Hero<strong>in</strong>(75%) with only small proportions of o<strong>the</strong>r substances be<strong>in</strong>g identified (Figure 28).Figure 28: Substance M<strong>is</strong>use by TypeSubstance M<strong>is</strong>use by Type5%4%6% 3% Hero<strong>in</strong>4% 2% Methadone1%O<strong>the</strong>r OpiateBenzidiazap<strong>in</strong>eAmphetam<strong>in</strong>eCoca<strong>in</strong>e75%Cannab<strong>is</strong>O<strong>the</strong>rFigure 29 shows <strong>the</strong> age profile of drug users access<strong>in</strong>g dependency services <strong>in</strong> East <strong>Cumbria</strong>.The chart shows that <strong>the</strong> age of people <strong>most</strong> frequently access<strong>in</strong>g dependency services r<strong>is</strong>essteadily from <strong>the</strong> age of 20, peak<strong>in</strong>g at around age 34 after which <strong>the</strong>re <strong>is</strong> a steady decl<strong>in</strong>e <strong>in</strong><strong>the</strong> older age groups access<strong>in</strong>g treatment services.Fiona Hunt<strong>in</strong>gton 29 of 47
Figure 29: Substance M<strong>is</strong>use by age group.Substance M<strong>is</strong>use Service Users by AgeGroup 2007Percentage ofService Users1501005001820-2430-3440-4450-5460-64Age Group18. Screen<strong>in</strong>g Programmes.18.1 Cervical Cancer.The national cervical screen<strong>in</strong>g programme enables early detection <strong>and</strong> treatment of changes <strong>in</strong><strong>the</strong> cervix before <strong>the</strong>se changes become malignant. In <strong>the</strong> UK each year around 3,000 newcases of cervical cancer are diagnosed, <strong>and</strong> <strong>the</strong>re are around 900 deaths <strong>in</strong> <strong>Engl<strong>and</strong></strong> due to th<strong>is</strong>condition. Many women who develop cervical cancer have not been screened regularly.(Department of Health 2006)The Department of Health has set a target for Primary Care organ<strong>is</strong>ations to achieve 80% ofwomen between <strong>the</strong> ages of 25 <strong>and</strong> 64 receiv<strong>in</strong>g cervical cancer screen<strong>in</strong>g.Data to March 2006 <strong>in</strong>dicate that <strong>Cumbria</strong> Primary Care Trust as a whole has exceeded <strong>the</strong>national average for cervical screen<strong>in</strong>g by achiev<strong>in</strong>g 82.4% of all women with<strong>in</strong> <strong>the</strong> target agegroup attend<strong>in</strong>g for screen<strong>in</strong>g. Th<strong>is</strong> compares to <strong>the</strong> national figure of 79.5%.For <strong>the</strong> same period, <strong>Carl<strong>is</strong>le</strong> Local Authority has achieved 82.5% of coverage for <strong>the</strong> targetgroup. However four of <strong>the</strong> fifteen General practices <strong>in</strong> <strong>Carl<strong>is</strong>le</strong> did not achieve <strong>the</strong> target of80% coverage of <strong>the</strong> eligible population.18.2 Breast Screen<strong>in</strong>g.In <strong>Engl<strong>and</strong></strong> one <strong>in</strong> n<strong>in</strong>e women will develop breast cancer at some time <strong>in</strong> <strong>the</strong>ir life. (Departmentof Health 2006). Breast screen<strong>in</strong>g <strong>in</strong> <strong>the</strong> form of mammography can detect breast cancer at anearly stage. Between 1988 <strong>and</strong> 1991 <strong>the</strong> National Breast Programme was <strong>in</strong>troduced. Dur<strong>in</strong>g<strong>the</strong> first phase all women aged between 50 <strong>and</strong> 64 years were <strong>in</strong>vited to attend formammography. Dur<strong>in</strong>g 2005 <strong>the</strong> programme was extended to <strong>in</strong>clude women aged between 65<strong>and</strong> 70 years. After <strong>the</strong> age of 70, women are still eligible for breast screen<strong>in</strong>g however <strong>the</strong>y arenot <strong>in</strong>vited to attend, <strong>and</strong> must request mammography.The Department of Health has set a target for primary care organ<strong>is</strong>ations to achieve a m<strong>in</strong>imumof 70% of <strong>the</strong> eligible population to attend breast screen<strong>in</strong>g <strong>and</strong> a desirable target of 80% of <strong>the</strong>eligible population. The programme <strong>is</strong> estimated to save around 1,400 lives each year <strong>in</strong><strong>Engl<strong>and</strong></strong>. For every 400 women screened regularly by <strong>the</strong> <strong>NHS</strong> Breast Screen<strong>in</strong>g Programmeover a ten year period, one woman fewer will die from breast cancer (Adv<strong>is</strong>ory Committee onBreast Cancer Screen<strong>in</strong>g 2006).In <strong>Cumbria</strong> over <strong>the</strong> past 3 years 68.3% of women who are eligible have attended for breastscreen<strong>in</strong>g. Th<strong>is</strong> falls short of <strong>the</strong> m<strong>in</strong>imum target of 70%.Fiona Hunt<strong>in</strong>gton 30 of 47
18.3 Chlamydia.Chlamydia <strong>is</strong> <strong>the</strong> <strong>most</strong> common sexually transmitted <strong>in</strong>fection <strong>in</strong> <strong>the</strong> UK <strong>and</strong> it affects both men<strong>and</strong> women. The condition <strong>is</strong> easy to treat once detected, bur <strong>the</strong> majority of cases areasymptomatic. Untreated Chlamydia can lead to long term problems such as <strong>in</strong>fertility <strong>and</strong>ectopic pregnancy.Chlamydia <strong>is</strong> <strong>most</strong> common <strong>in</strong> <strong>the</strong> under 25 age group with 1 <strong>in</strong> ten people <strong>in</strong> th<strong>is</strong> cohort test<strong>in</strong>gpositive for <strong>the</strong> condition.In March 2007 <strong>the</strong> National Chlamydia screen<strong>in</strong>g programme was launched. The programmeaims to prevent <strong>and</strong> control Chlamydia <strong>in</strong>fection through early detection <strong>and</strong> treatment of <strong>the</strong>asymptomatic condition.The programme <strong>in</strong>volves <strong>the</strong> implementation of a multi-faceted, evidence-based <strong>and</strong> cost –effective national prevention <strong>and</strong> control programme.19. Childhood Immun<strong>is</strong>ation.Immun<strong>is</strong>ation programmes provide protection aga<strong>in</strong>st serious d<strong>is</strong>eases.The <strong>NHS</strong> adv<strong>is</strong>es that all children are immun<strong>is</strong>ed aga<strong>in</strong>st <strong>the</strong> follow<strong>in</strong>g <strong>in</strong>fectious d<strong>is</strong>eases:• Diph<strong>the</strong>ria• Tetanus• Pertuss<strong>is</strong>• Polio• Haemophilus Influenzae Type b (Hib)• Pneumococcal Infection• Men<strong>in</strong>git<strong>is</strong> C• Measles• Mumps• RubellaThe Department of Health has set a target rate of 95% for <strong>the</strong> uptake of all rout<strong>in</strong>e childhoodvacc<strong>in</strong>ations with an overall rate of 96% to be achieved for <strong>the</strong> period 2010 -11.Table 10 illustrates <strong>the</strong> percentage of children under <strong>the</strong> age of two who received rout<strong>in</strong>echildhood immun<strong>is</strong>ations <strong>in</strong> <strong>Carl<strong>is</strong>le</strong> <strong>and</strong> compares <strong>the</strong>m to children <strong>in</strong> <strong>Cumbria</strong> as a whole.While <strong>the</strong>re are currently no data available relat<strong>in</strong>g to pneumococcal immun<strong>is</strong>ation, we can seethat we are currently hitt<strong>in</strong>g <strong>the</strong> immun<strong>is</strong>ation target for <strong>the</strong> majority of identified d<strong>is</strong>eases.However we are below <strong>the</strong> target for measles, Mumps <strong>and</strong> Rubella vacc<strong>in</strong>ation.Table 10: Immun<strong>is</strong>ation Stat<strong>is</strong>tics for Children Under <strong>the</strong> Age of Two – 2006-07D<strong>is</strong>eases ProtectedAga<strong>in</strong>st% Protected<strong>Carl<strong>is</strong>le</strong>% Protected<strong>Cumbria</strong>Diph<strong>the</strong>ria98% 97.5%Pertuss<strong>is</strong>TetanusPolioHibMen<strong>in</strong>git<strong>is</strong> C 97% 97%Measles91% 91.2%MumpsRubellaPneumococcalInfectionData Unavailable Data UnavailableFiona Hunt<strong>in</strong>gton 31 of 47
20. Influenza Vacc<strong>in</strong>e.Influenza - flu - <strong>is</strong> a highly <strong>in</strong>fectious acute viral <strong>in</strong>fection, which affects people of all ages,ma<strong>in</strong>ly dur<strong>in</strong>g <strong>the</strong> w<strong>in</strong>ter months.While <strong>most</strong> people recover without complications <strong>in</strong> 1-2 weeks, flu can cause serious illness <strong>and</strong>death, especially <strong>in</strong> <strong>the</strong> very young <strong>and</strong> <strong>the</strong> elderly.Flu epidemics result <strong>in</strong> widespread illness <strong>and</strong> d<strong>is</strong>ruption to health <strong>and</strong> o<strong>the</strong>r services.A vacc<strong>in</strong>e <strong>is</strong> produced every year based on <strong>the</strong> stra<strong>in</strong>s of virus expected to be circulat<strong>in</strong>g.The national policy <strong>is</strong> for ‘flu vacc<strong>in</strong>e to be offered to <strong>the</strong> follow<strong>in</strong>g groups:- chronic respiratory d<strong>is</strong>ease, <strong>in</strong>clud<strong>in</strong>g asthma;- chronic heart d<strong>is</strong>ease;- chronic renal d<strong>is</strong>ease;- chronic liver d<strong>is</strong>ease;- diabetes;- immunosuppression due to d<strong>is</strong>ease or treatment; <strong>and</strong> those liv<strong>in</strong>g <strong>in</strong> long stay residential carehomes or o<strong>the</strong>r long stay care facilities.The target set by <strong>the</strong> world Health Organ<strong>is</strong>ation <strong>is</strong> by 2006, 75% of people over <strong>the</strong> age of 65should receive annual ‘flu vacc<strong>in</strong>ation. The flu jab <strong>is</strong> effective for up to 12 months <strong>and</strong> <strong>the</strong> fluvirus constantly mutates, so it <strong>is</strong> necessary to have a new jab each year. Table 11 shows thatdur<strong>in</strong>g <strong>the</strong> 2006 / 07 ‘flu vacc<strong>in</strong>ation programme <strong>Carl<strong>is</strong>le</strong> reached its target of 75% of residentsover <strong>the</strong> age of 65 received ‘flu vacc<strong>in</strong>e.Table 11: Over 65 Rates for Influenza by PBC as at 31/01/2007PatientsReg<strong>is</strong>teredNumberVacc<strong>in</strong>ated% UptakeAreaAllerdale 18,928 14,739 78%Barrow 10,952 8,691 79%<strong>Carl<strong>is</strong>le</strong> 18,866 14,138 75%Copel<strong>and</strong> 12,639 9,140 72%Eden 10,107 7,668 76%South Lakel<strong>and</strong> 24,178 18,238 75%<strong>Cumbria</strong> PCT 103,572 78,899 76%21. Dental Health <strong>in</strong> Children.The 1994 Oral Health Strategy outl<strong>in</strong>ed objectives for oral health for <strong>the</strong> year 2003 which concentratedon <strong>the</strong> prevalence of tooth decay, specifically <strong>in</strong> children.The targets were:• 70% of five year old children should not have experienced decayFiona Hunt<strong>in</strong>gton 32 of 47
• On average, five year old children should have no more than one decayed, m<strong>is</strong>s<strong>in</strong>g due todecay or filled primary tooth• On average, twelve year old children should have no more than one decayed, m<strong>is</strong>s<strong>in</strong>g due todecay or filled tooth (DMFT)Figure 30 shows that dur<strong>in</strong>g 2005/06, 48% of children aged five years <strong>in</strong> <strong>Carl<strong>is</strong>le</strong> wereexperienc<strong>in</strong>g decay. Th<strong>is</strong> <strong>is</strong> higher than any of <strong>the</strong> local authorities <strong>in</strong> <strong>Cumbria</strong> <strong>and</strong> 10% higherthan <strong>the</strong> average for <strong>Engl<strong>and</strong></strong> <strong>and</strong> means that only 52% had no decay. Th<strong>is</strong> <strong>is</strong> well below <strong>the</strong>target set for 2003.Figure 30: Children with Tooth Decay.Percentage605040302010047AllerdalePercentage of five year old children <strong>in</strong> <strong>Cumbria</strong> with toothdecay 2005/0640Barrow <strong>in</strong>Furness48364533<strong>Carl<strong>is</strong>le</strong> Copel<strong>and</strong> Eden SouthLocalityLakel<strong>and</strong>42 38<strong>Cumbria</strong>PCT<strong>Engl<strong>and</strong></strong>22. Air Quality.Clean air <strong>is</strong> an important feature of <strong>the</strong> local environment <strong>and</strong> <strong>is</strong> essential <strong>in</strong> ensur<strong>in</strong>g a goodquality of life. The National Air Quality Strategy (1997) aims to m<strong>in</strong>im<strong>is</strong>e <strong>the</strong> r<strong>is</strong>k of poor airquality to human health. The Strategy identifies seven common air pollutants that occur widelythroughout <strong>the</strong> UK <strong>and</strong> which can cause harm to human health. These pollutants are largely <strong>the</strong>result of <strong>in</strong>dustry <strong>and</strong> motor vehicles. They are identified as Benzene, Butadiene, CarbonMonoxide, Lead, Nitrogen dioxide, Particles (PM10) <strong>and</strong> Sulphur Dioxide. The Strategy sets outacceptable st<strong>and</strong>ards for concentrations of <strong>the</strong>se pollutants along with dates for which <strong>the</strong>sest<strong>and</strong>ards should be achieved. All of <strong>the</strong>se dates are now timed out with <strong>the</strong> exception ofBenzene where <strong>the</strong> target date <strong>is</strong> December 2010.All local authorities have a legal duty to periodically review <strong>and</strong> assess <strong>the</strong> current <strong>and</strong> likelyfuture air quality <strong>in</strong> <strong>the</strong>ir area aga<strong>in</strong>st <strong>the</strong>se air quality st<strong>and</strong>ards.There are thirteen air quality monitor<strong>in</strong>g locations across <strong>the</strong> <strong>city</strong> of <strong>Carl<strong>is</strong>le</strong>.Where an air quality objective <strong>is</strong> not likely to be met, <strong>the</strong> Local Authority must declare an AirQuality Management Area (AQMA) <strong>and</strong> produce an action plan outl<strong>in</strong><strong>in</strong>g how <strong>the</strong> Authority<strong>in</strong>tends to improve air quality with<strong>in</strong> <strong>the</strong> AQMA.Table 12 illustrates <strong>the</strong> National Air Quality St<strong>and</strong>ards <strong>and</strong> dates by which <strong>the</strong>y should beachieved.Table 12: National Air Quality Targets.Pollutant Concentration Date to be Achieved ByBenzene (All authorities) 16.25mg/m3 31.12.2003Benzene (<strong>Engl<strong>and</strong></strong> <strong>and</strong> Wales) 5.00mg/m3 31.12.2010Butadiene 2.25mg/m3 31.12.2003Carbon Monoxide 10.0mg/m3 31.12.2003Lead 0.5mg/m3 31.12.2004Fiona Hunt<strong>in</strong>gton 33 of 47
Nitrogen DioxideParticles (PM10)Sulphur Dioxide200mg/m3 not to be exceededmore than 18 times a year50mg/m3 not to be exceededmore than 35 times a year266mg/m3 not to be exceededmore than 35 times a year31.12.200531.12.200431.12.2005The Local Authority <strong>is</strong> now only required to report a detailed assessment specifically on levels ofNitrogen Dioxide (NO 2 ) <strong>and</strong> Particles (PM10). Th<strong>is</strong> <strong>is</strong> because none of <strong>the</strong> o<strong>the</strong>r pollutants hitany of <strong>the</strong> trigger levels which would lead to <strong>the</strong> possibility of <strong>the</strong>m exceed<strong>in</strong>g <strong>the</strong> limits.Dur<strong>in</strong>g <strong>the</strong> last round of review <strong>and</strong> assessment which was publ<strong>is</strong>hed <strong>in</strong> 2006 it was identifiedthat exceedences of <strong>the</strong> annual mean NO 2 objective were likely to occur along sections of <strong>the</strong>A7 <strong>in</strong> <strong>Carl<strong>is</strong>le</strong>. The area between Junction 44 of <strong>the</strong> M6 to Hardwick Circus was <strong>the</strong>reforedeclared an Air Quality Management Area.<strong>Carl<strong>is</strong>le</strong> City Council <strong>is</strong> now <strong>in</strong> <strong>the</strong> process of undertak<strong>in</strong>g <strong>the</strong> third round of review <strong>and</strong>assessment. The first stage (a scop<strong>in</strong>g report) has been completed <strong>and</strong> concludes that <strong>the</strong>reare several o<strong>the</strong>r areas with<strong>in</strong> <strong>the</strong> City which are at r<strong>is</strong>k of exceed<strong>in</strong>g <strong>the</strong> annual mean airquality objective for nitrogen dioxide. They conclude that <strong>the</strong>re was sufficient monitor<strong>in</strong>g data toshow that <strong>the</strong> annual mean air quality objective for nitrogen dioxide was be<strong>in</strong>g exceeded atlocations alongside Currock Street. Th<strong>is</strong> location has now been declared a second Air QualityManagement Area.Overall <strong>Carl<strong>is</strong>le</strong> <strong>is</strong> 86 th out of 354 d<strong>is</strong>tricts <strong>in</strong> <strong>Engl<strong>and</strong></strong> for CO2 em<strong>is</strong>sions per head of population.Th<strong>is</strong> <strong>is</strong> <strong>in</strong> <strong>the</strong> worst 25%.<strong>Carl<strong>is</strong>le</strong> City Council <strong>is</strong> currently draw<strong>in</strong>g up an Action Plan specify<strong>in</strong>g <strong>the</strong> measures it <strong>in</strong>tends totake <strong>in</strong> pursuit of reduc<strong>in</strong>g nitrogen dioxide concentrations with<strong>in</strong> <strong>the</strong> Air Quality ManagementAreas.The follow<strong>in</strong>g are head<strong>in</strong>gs under which Action Plan measures are be<strong>in</strong>g considered to improveair quality <strong>in</strong> <strong>the</strong> production of <strong>the</strong> Air Quality Action Plan.• Reduc<strong>in</strong>g <strong>the</strong> need to travel• Encourag<strong>in</strong>g walk<strong>in</strong>g <strong>and</strong> cycl<strong>in</strong>g• Encourag<strong>in</strong>g use of public transport• Reduc<strong>in</strong>g <strong>the</strong> number <strong>and</strong> d<strong>is</strong>tance of trips with<strong>in</strong> <strong>the</strong> AQMA• Encourag<strong>in</strong>g <strong>the</strong> use of alternative fuels <strong>and</strong> smaller more efficient vehicles• Improv<strong>in</strong>g traffic management <strong>and</strong> congestion• Reduc<strong>in</strong>g em<strong>is</strong>sions from heavy goods vehicles <strong>and</strong> buses• Reduc<strong>in</strong>g em<strong>is</strong>sions from non transport related sources.In relation to Particulate Matter monitor<strong>in</strong>g a summary of PM 10 concentrations monitoredbetween January <strong>and</strong> December 2006 were well below <strong>the</strong> objective levels for 2004.23. Mental Health.Evidence suggests that <strong>the</strong> places where people live have an important effect on <strong>the</strong>ir mentalhealth (Fone <strong>and</strong> Dunstan 2006), <strong>the</strong>re <strong>is</strong> also a well recogn<strong>is</strong>ed l<strong>in</strong>k between <strong>in</strong>equalities,employment <strong>and</strong> mental health.Figure 31 shows <strong>the</strong> percentage of those people who are claim<strong>in</strong>g <strong>in</strong>capa<strong>city</strong> benefit for each of<strong>the</strong> wards <strong>in</strong> <strong>Carl<strong>is</strong>le</strong> whose claim <strong>is</strong> due to a mental health problem.We can see that twelve of <strong>the</strong> <strong>Carl<strong>is</strong>le</strong> wards have higher than <strong>the</strong> average figure for <strong>Cumbria</strong>whose claim <strong>is</strong> due to mental health <strong>is</strong>sues. However those wards that are <strong>in</strong> <strong>the</strong> higher socioeconomic bracket generally have lower levels of mental health problems than <strong>the</strong> mored<strong>is</strong>advantaged wards.Fiona Hunt<strong>in</strong>gton 34 of 47
Figure 31: Incapa<strong>city</strong> Claimants by WardPercentage of all <strong>in</strong>capa<strong>city</strong> claimants that have a mental health d<strong>is</strong>ease code, by ward, May 200760.0%50.0%40.0%<strong>Cumbria</strong> = 38.4%Percentage30.0%20.0%10.0%0.0%BurghDalstonLyneStanwix RuralGreat Corby <strong>and</strong> GeltsdaleYewdaleLongtown & RockcliffeStanwix UrbanBelahHaytonWe<strong>the</strong>ralBelle VueHarrabyIrth<strong>in</strong>gCurrockUpperbyMortonBotcherbyBramptonDenton HolmeCastleSt AidansWardFigure 32 shows <strong>the</strong> number of hospital adm<strong>is</strong>sions due to self harm for <strong>the</strong> period 2003 - 2008.We can aga<strong>in</strong> see that such <strong>in</strong>cidents are concentrated <strong>in</strong> <strong>the</strong> <strong>most</strong> d<strong>is</strong>advantaged wards.Botcherby <strong>in</strong> particular has a notably high <strong>in</strong>cidence of self harm. However it should be notedthat <strong>the</strong> data represent <strong>in</strong>cidences <strong>and</strong> not <strong>in</strong>dividuals, <strong>the</strong>refore it <strong>is</strong> possible that one <strong>in</strong>dividualmay be responsible for a number of hospital adm<strong>is</strong>sions dur<strong>in</strong>g <strong>the</strong> timescale.Figure 32: Hospital adm<strong>is</strong>sions due to self-harmHospital Adm<strong>is</strong>sion Rates/100,000 due to self-harm, <strong>Carl<strong>is</strong>le</strong> 2003-20082500.002000.00Crude Rate/100,0001500.001000.00500.00<strong>Carl<strong>is</strong>le</strong>0.00BotcherbyMortonHarrabyUpperbySt AidansCastleBelle VueLongtown And RockcliffeYewdaleCurrockWe<strong>the</strong>ralDenton HolmeStanwix UrbanBelahBramptonGreat Corby And GeltsdaleDalstonStanwix RuralLyneBurghIrth<strong>in</strong>gHaytonWardFiona Hunt<strong>in</strong>gton 35 of 47
Figure 33 shows hospital adm<strong>is</strong>sions for a mental health condition. Aga<strong>in</strong> <strong>the</strong> data clearlydemonstrate that those wards with <strong>the</strong> greatest level of socio-economic d<strong>is</strong>advantage have <strong>the</strong>highest rates of mental poor health, while <strong>the</strong> more affluent wards all have rates noticeablylower than <strong>the</strong> <strong>Carl<strong>is</strong>le</strong> average.Figure 33: Hospital adm<strong>is</strong>sions – Mental HealthCrude rate/100,000 for adm<strong>is</strong>sions to hospital due to mental health, <strong>Carl<strong>is</strong>le</strong> 2003-20081000.00900.00800.00700.00Rate/100,000600.00500.00400.00300.00<strong>Carl<strong>is</strong>le</strong>200.00100.000.00CastleBotcherbySt AidansMortonDenton HolmeUpperbyHarrabyCurrockBelle VueDalstonBramptonLongtown And RockcliffeGreat Corby And GeltsdaleYewdaleStanwix UrbanBelahWe<strong>the</strong>ralLyneHaytonBurghIrth<strong>in</strong>gStanwix RuralWard23. Long Term Limit<strong>in</strong>g Illness.Figure 34 represents <strong>the</strong> percentage of people report<strong>in</strong>g that <strong>the</strong>y have a long term limit<strong>in</strong>gillness (LTLI) by ward.The data show that Morton <strong>is</strong> ranked <strong>the</strong> highest of <strong>the</strong> 22 <strong>Carl<strong>is</strong>le</strong> wards for people liv<strong>in</strong>g withLTLI, th<strong>is</strong> represents 25.7% of <strong>the</strong> ward population. However, <strong>the</strong>se data are not st<strong>and</strong>ard<strong>is</strong>edfor age <strong>and</strong> it should be noted that 29% of people liv<strong>in</strong>g <strong>in</strong> Morton ward are over <strong>the</strong> age of 65.Overall, 19.7% of <strong>the</strong> <strong>Carl<strong>is</strong>le</strong> population are liv<strong>in</strong>g with a long term limit<strong>in</strong>g illness. Th<strong>is</strong>compares to <strong>the</strong> average for <strong>Engl<strong>and</strong></strong> which <strong>is</strong> 17.9%. <strong>Carl<strong>is</strong>le</strong> has a similar proportion ofresidents over <strong>the</strong> age of 65 to <strong>the</strong> rest of <strong>Engl<strong>and</strong></strong>. However <strong>the</strong> data <strong>in</strong>dicate that <strong>Carl<strong>is</strong>le</strong> hasa prevalence of long term limit<strong>in</strong>g illness al<strong>most</strong> 2% higher than <strong>the</strong> national average.Fiona Hunt<strong>in</strong>gton 36 of 47
Figure 34: Long Term Limit<strong>in</strong>g IllnessThe Percentage of People <strong>in</strong> <strong>Carl<strong>is</strong>le</strong> with a Long Term Limit<strong>in</strong>g Illness (Source - 2001 Census)30.0%25.0%25.7%24.7%22.0% 21.7% 21.1% 20.7% 20.1% 20.0%18.2% 18.0% 17.6% 17.6%16.0%15.2%14.7%<strong>Cumbria</strong> average20.0%19.3%18.9%<strong>Engl<strong>and</strong></strong> averagePercentage (%)15.0%16.8%16.7%16.6%14.2%13.6%10.0%5.0%0.0%MortonUpperbyCastleHarrabyBotcherbyLongtown &RockcliffeBelle VueDenton HolmeBramptonDalstonSt AidansStanwix UrbanCurrockYewdaleHaytonWe<strong>the</strong>ralBelahLyneIrth<strong>in</strong>gStanwix RuralGreat Corby <strong>and</strong>GeltsdaleBurghWard24. Quality of Life.The <strong>Cumbria</strong> Quality of Life Survey was conducted <strong>in</strong> 2006 by <strong>the</strong> Ipsos MORI Social ResearchCouncil. The research covered <strong>the</strong> follow<strong>in</strong>g <strong>is</strong>sues:• Sat<strong>is</strong>faction with <strong>Cumbria</strong> as a place to live• Views of council participation, volunteer<strong>in</strong>g <strong>and</strong> social cohesion• Perceptions of community <strong>and</strong> safety <strong>in</strong> <strong>the</strong> local area• Attitudes towards <strong>the</strong> local environment• Sat<strong>is</strong>faction with service prov<strong>is</strong>ion• Transport <strong>and</strong> mobility• Perceptions of health <strong>and</strong> wellbe<strong>in</strong>g.The key f<strong>in</strong>d<strong>in</strong>gs <strong>in</strong> relation to <strong>Carl<strong>is</strong>le</strong> City Council residents are summar<strong>is</strong>ed as follows.Levels of sat<strong>is</strong>faction with <strong>the</strong> local area are relatively high <strong>in</strong> <strong>Carl<strong>is</strong>le</strong> with 84% of residentssay<strong>in</strong>g <strong>the</strong>y are sat<strong>is</strong>fied. However, people liv<strong>in</strong>g <strong>in</strong> <strong>Carl<strong>is</strong>le</strong> are less sat<strong>is</strong>fied with <strong>the</strong>ir localarea than those <strong>in</strong> <strong>Cumbria</strong> overall <strong>and</strong> are more likely to say <strong>the</strong> area has got worse <strong>in</strong> recentyears.Concern about crime <strong>is</strong> more widespread <strong>in</strong> <strong>Carl<strong>is</strong>le</strong> than it <strong>is</strong> <strong>in</strong> <strong>Cumbria</strong> overall.<strong>Carl<strong>is</strong>le</strong> residents are more worried about be<strong>in</strong>g a victim of crime <strong>and</strong> less likely to feel safeoutdoors after dark than are <strong>Cumbria</strong> residents generally (33% <strong>in</strong> <strong>Carl<strong>is</strong>le</strong> compared to 21% <strong>in</strong><strong>Cumbria</strong>) <strong>and</strong> also <strong>the</strong> population nationally.Anti-social behaviour <strong>is</strong> a key concern for <strong>Carl<strong>is</strong>le</strong> residents, <strong>and</strong> <strong>most</strong> do not feel well <strong>in</strong>formedabout what <strong>is</strong> be<strong>in</strong>g done about it.A strong sense of community cohesion <strong>is</strong> evident <strong>in</strong> <strong>Carl<strong>is</strong>le</strong> with more than half of residentssay<strong>in</strong>g <strong>the</strong>y feel <strong>the</strong>y belong to <strong>the</strong>ir communityHalf of residents <strong>in</strong> <strong>Carl<strong>is</strong>le</strong> believe people <strong>in</strong> <strong>the</strong>ir neighbourhood are able to <strong>in</strong>fluence localdec<strong>is</strong>ion mak<strong>in</strong>g by work<strong>in</strong>g toge<strong>the</strong>r. However, many <strong>Carl<strong>is</strong>le</strong> residents are keen to have moreof a say <strong>in</strong> Council dec<strong>is</strong>ions.Fiona Hunt<strong>in</strong>gton 37 of 47
<strong>Carl<strong>is</strong>le</strong> residents’ top priorities for improvement <strong>in</strong> <strong>the</strong>ir local area are activities for teenagers,traffic congestion <strong>and</strong> road <strong>and</strong> pavement repairs.Broadly speak<strong>in</strong>g, residents th<strong>in</strong>k service delivery <strong>in</strong> <strong>the</strong> local area <strong>is</strong> good. However sat<strong>is</strong>factionwith a number of local services <strong>and</strong> facilities - children’s playgrounds <strong>and</strong> play areas, libraries,hospitals, tra<strong>in</strong> services <strong>and</strong> social services <strong>is</strong> lower among users of <strong>the</strong>se services resident <strong>in</strong><strong>Carl<strong>is</strong>le</strong> than <strong>in</strong> <strong>Cumbria</strong> overall.25. Crime.<strong>Carl<strong>is</strong>le</strong> <strong>and</strong> Eden local authorities have an establ<strong>is</strong>hed Crime <strong>and</strong> D<strong>is</strong>order ReductionPartnership (CDRP) which <strong>in</strong>cludes <strong>the</strong> Police, Primary Care Trust, Probation Service, Localresidents <strong>and</strong> <strong>the</strong> Voluntary Sector.The CDRP produces an annual strategic assessment of local priorities <strong>in</strong> relation to crime <strong>and</strong>a tactical plan <strong>is</strong> dev<strong>is</strong>ed to address <strong>the</strong> identified priorities.Current priorities relate to anti-social behaviour, violent crime <strong>and</strong> crim<strong>in</strong>al damage. Targets areset <strong>in</strong> order to measure performance.Figure 35 shows <strong>the</strong> rate of offences per 1,000 of <strong>the</strong> population dur<strong>in</strong>g <strong>the</strong> period 2005 /06.The chart demonstrates that <strong>the</strong> chosen area (<strong>Carl<strong>is</strong>le</strong>) has higher than <strong>the</strong> national averagerates of offences for each of <strong>the</strong> three month periods.Figure 35: Compar<strong>is</strong>on of Rates of Offences <strong>in</strong> <strong>Carl<strong>is</strong>le</strong> Local Authority Compared to <strong>the</strong> National Average.Figure 36 illustrates trends <strong>in</strong> offences <strong>in</strong> each of <strong>the</strong> local authorities <strong>in</strong> <strong>Cumbria</strong> 0ver a fiveyear period (2003 /08). The trend data show that trends are fairly similar across <strong>the</strong> localauthorities. From 2003 to 2006 <strong>the</strong>re was a r<strong>is</strong>e <strong>in</strong> <strong>the</strong> number of crimes, however th<strong>is</strong> trend hasreversed <strong>and</strong> <strong>in</strong> <strong>the</strong> period to 2008 <strong>the</strong>re has been a general downward trend <strong>in</strong> offences.It should be noted that <strong>the</strong>se figures relate to actual numbers of offences ra<strong>the</strong>r than rates perpopulation. <strong>Carl<strong>is</strong>le</strong> has <strong>the</strong> greatest population of all <strong>the</strong> local authorities <strong>in</strong> <strong>Cumbria</strong> <strong>and</strong> th<strong>is</strong> <strong>is</strong>reflected <strong>in</strong> <strong>the</strong> number of offences reported.Fiona Hunt<strong>in</strong>gton 38 of 47
Figure 36: trends <strong>in</strong> Offences by Local Authority 2003 - 081400012000100008000600040002000AllerdaleBarrow<strong>Carl<strong>is</strong>le</strong>Copel<strong>and</strong>EdenS.Lakes02003/04 2004/05 2005/06 2006/07 2007/08Table 13 illustrates <strong>the</strong> type of offences reported with<strong>in</strong> <strong>the</strong> Local Authority over <strong>the</strong> five yearperiod from 2003 to 2008. We can see that <strong>the</strong> commonest types of offences are crim<strong>in</strong>aldamage, <strong>the</strong>ft <strong>and</strong> offences aga<strong>in</strong>st <strong>the</strong> person which <strong>in</strong>cludes assault, actual <strong>and</strong> grievousbodily harm, as well as murder.Table 13: Types of Offence 2003-08Offence Type<strong>Carl<strong>is</strong>le</strong>Burglary Dwell<strong>in</strong>g 1923Burglary O<strong>the</strong>r 3826Crim<strong>in</strong>al Damage 16913Drugs 1666Fraud & Forgery 1762Offences Aga<strong>in</strong>st <strong>the</strong>Person 11006O<strong>the</strong>r 767Robbery 175Sexual Offences 494Theft 14288Theft from a Motor Vehicle 3388Theft of a Motor Vehicle 1746TOTAL 5795426. Education.Table 14 shows <strong>the</strong> percentage of children aged 15 who have achieved five or more GCSEpasses at grade A* to C. We can see that <strong>Carl<strong>is</strong>le</strong> <strong>is</strong> ranked lowest of all <strong>the</strong> local authorities <strong>in</strong><strong>Cumbria</strong> with just 47.7% of children achiev<strong>in</strong>g th<strong>is</strong> st<strong>and</strong>ard. <strong>Carl<strong>is</strong>le</strong> also falls considerablybelow <strong>the</strong> average for <strong>the</strong> North West region which <strong>is</strong> 56.5% <strong>and</strong> <strong>is</strong> improv<strong>in</strong>g less rapidly than<strong>Cumbria</strong>, <strong>the</strong> North West Region <strong>and</strong> <strong>Engl<strong>and</strong></strong>.<strong>Carl<strong>is</strong>le</strong> local authority has <strong>the</strong> highest proportion of children <strong>in</strong> <strong>Cumbria</strong> who have received nopasses at GCSE level with 5.6% of all pupils aged 15 not achiev<strong>in</strong>g th<strong>is</strong> st<strong>and</strong>ard. Th<strong>is</strong>compares to <strong>the</strong> percentage of pupils <strong>in</strong> <strong>the</strong> North West region which <strong>is</strong> 3.4%.Fewer 16 year olds stay on <strong>in</strong> education <strong>in</strong> <strong>Carl<strong>is</strong>le</strong> than <strong>in</strong> <strong>the</strong> rest of <strong>Cumbria</strong> <strong>and</strong> <strong>Engl<strong>and</strong></strong>.Fiona Hunt<strong>in</strong>gton 39 of 47
Table14: Percentage of children achiev<strong>in</strong>g 5 or more GCSE passes.All 15 YearOld Pupils% All 15Year OldPupilsAchiev<strong>in</strong>g5+ A* - C% All 15Year OldPupils withNo PassesAllerdale 1237 63.3 3.6Barrow-<strong>in</strong>-Furness 927 50.7 5.1<strong>Carl<strong>is</strong>le</strong> 1207 47.7 5.6Copel<strong>and</strong> 904 56.1 5Eden 622 62.5 3.4South Lakel<strong>and</strong> 1096 65.8 1.6North West 87244 56.5 3.4Figure 37 illustrates <strong>the</strong> percentage of people with no qualifications. We can see that 32% of<strong>Carl<strong>is</strong>le</strong> residents have no qualifications compared to <strong>the</strong> average for <strong>Cumbria</strong> of 21%.Figure 37: Percentage of <strong>the</strong> Population with No QualificationsPercentage of Population With No Qualifications% Population40.0%35.0%30.0%25.0%20.0%15.0%10.0%5.0%0.0%Series1AllerdaleBarrow-<strong>in</strong>-Furness<strong>Carl<strong>is</strong>le</strong>Copel<strong>and</strong>EdenSouth Lakel<strong>and</strong><strong>Cumbria</strong>Local Authority27. Accidents.27.1 Road Traffic Accidents.Road traffic accidents are a major cause of accidental deaths <strong>in</strong> young people <strong>and</strong> are a publichealth priority <strong>in</strong> <strong>the</strong> UK.In <strong>Cumbria</strong> dur<strong>in</strong>g 2007 <strong>the</strong> target set to reduce <strong>the</strong> number of people killed or seriously <strong>in</strong>juredon our roads was set at a 14.5% reduction on <strong>the</strong> previous year. In real figures th<strong>is</strong> means 20fewer <strong>in</strong>dividuals with a target of 144 casualties. The target was achieved with an overall figureof 130 casualties for <strong>the</strong> year.Fiona Hunt<strong>in</strong>gton 40 of 47
Figure 38: Road Traffic Coll<strong>is</strong>ions by ward.Number of coll<strong>is</strong>ions <strong>Carl<strong>is</strong>le</strong> (CuPS, 2004-2005)180160140120100806040200LYNEGREAT CORBY & GELTSDALEBURGHSTANWIX RURALLONGTOWN & ROCKCLIFFEBRAMPTONYEWDALESTANWIX URBANBELAHWETHERALHARRABYDALSTONMORTONUPPERBYST. AIDANSDENTON HOLMECASTLEBOTCHERBYCURROCKBELLE VUEColl<strong>is</strong>ons (all types)Figure 36 shows <strong>the</strong> number of road traffic coll<strong>is</strong>ions by ward, <strong>and</strong> demonstrates that <strong>the</strong> wardswith <strong>the</strong> highest number of accidents are <strong>in</strong> those suffer<strong>in</strong>g from <strong>the</strong> higher levels of deprivation.27.2 Falls.The National Service Framework for Older People St<strong>and</strong>ard Six, (DoH 2001) aims to reduce <strong>the</strong>number of falls which result <strong>in</strong> serious <strong>in</strong>jury, <strong>and</strong> ensure effective treatment <strong>and</strong> rehabilitationfor those who have fallen. A dedicated falls Prevention <strong>and</strong> Management Service <strong>is</strong> basedwith<strong>in</strong> <strong>the</strong> Acute Hospital Trust <strong>in</strong> <strong>Carl<strong>is</strong>le</strong>.Figure 39 shows st<strong>and</strong>ard<strong>is</strong>ed mortality ratios from accidental falls for each of <strong>the</strong> <strong>Cumbria</strong> localauthorities. We can see that while <strong>the</strong> <strong>Carl<strong>is</strong>le</strong> rate <strong>is</strong> slightly above <strong>the</strong> national average, th<strong>is</strong> <strong>is</strong>not stat<strong>is</strong>tically significant.Fiona Hunt<strong>in</strong>gton 41 of 47
Figure 39: SMRs from Accidental Falls.SMR mortality from accidental falls (W00-W19) 2004-2006400350300250SMR200150100500Copel<strong>and</strong> CD Eden CD Allerdale CD <strong>Carl<strong>is</strong>le</strong> CD South Lakel<strong>and</strong> CD Barrow-<strong>in</strong>-Furness CDLocalityAccidental <strong>and</strong> Non- Accidental Injury <strong>in</strong> Children.Accidents are <strong>the</strong> lead<strong>in</strong>g cause of <strong>in</strong>jury to children <strong>and</strong> d<strong>is</strong>proportionately affect children from<strong>the</strong> lower socio-economic groups.National <strong>in</strong>dicators for Local authorities <strong>and</strong> Local Authority Partnerships identify <strong>the</strong> reduction<strong>in</strong> emergency hospital adm<strong>is</strong>sion caused by un<strong>in</strong>tentional <strong>and</strong> deliberate <strong>in</strong>juries to children <strong>and</strong>young people as a national priority. Report<strong>in</strong>g on national <strong>in</strong>dicators commenced from April2008.Performance <strong>is</strong> measured by divid<strong>in</strong>g <strong>the</strong> total number of f<strong>in</strong><strong>is</strong>hed <strong>in</strong>-year adm<strong>is</strong>sions ofchildren <strong>and</strong> young people to hospital as a result of accidental <strong>and</strong> non-accidental <strong>in</strong>jury.Good performance relat<strong>in</strong>g to th<strong>is</strong> <strong>in</strong>dicator <strong>is</strong> typified by local authorities demonstrat<strong>in</strong>g adecreased rate.Figure 40 illustrates <strong>the</strong> rate of emergency adm<strong>is</strong>sions with an external cause per 10,000people aged 0 – 19 years of age for each local authority <strong>in</strong> <strong>Cumbria</strong>. Only Eden <strong>and</strong> SouthLakel<strong>and</strong> show rates below <strong>the</strong> average for <strong>Engl<strong>and</strong></strong>. The rema<strong>in</strong><strong>in</strong>g local authorities show adecreas<strong>in</strong>g trend over <strong>the</strong> three year period 2003 – 2007 for <strong>in</strong>juries result<strong>in</strong>g from an externalcause.The exception <strong>is</strong> <strong>Carl<strong>is</strong>le</strong> which has shown no such decrease, <strong>and</strong> <strong>in</strong> fact shows a slight<strong>in</strong>crease for 2006 / 07. Th<strong>is</strong> <strong>in</strong>dicates that performance needs to improve if we are todemonstrate a reduction <strong>in</strong> <strong>in</strong>juries to our children <strong>and</strong> young people.Fiona Hunt<strong>in</strong>gton 42 of 47
Figure 40: Emergency adm<strong>is</strong>sions per 10,000 people aged under 19 years result<strong>in</strong>gfrom un<strong>in</strong>tentional or deliberate <strong>in</strong>juries, by locality, 2004-07250Rate 200 per 10,000 people aged 0-19 years1501002005-06 <strong>Engl<strong>and</strong></strong> average =123.52004-052005-062006-07500Allerdale Barrow-<strong>in</strong>-Furness <strong>Carl<strong>is</strong>le</strong> Copel<strong>and</strong> Eden South Lakel<strong>and</strong> <strong>Cumbria</strong>Locality28. Sport <strong>and</strong> Le<strong>is</strong>ure.Urban parks <strong>and</strong> green spaces are recogn<strong>is</strong>ed as mak<strong>in</strong>g a positive contribution to health.Trees <strong>and</strong> vegetation help to reduce <strong>the</strong> effects of pollution, while regular exposure to outdoorgreen environments reduces stress <strong>and</strong> accelerates recovery (Maller et al 2006).There are four green space open parks with<strong>in</strong> <strong>Carl<strong>is</strong>le</strong>, <strong>the</strong>y are located at Denton Holme,Upperby, Hardwick Circus <strong>and</strong> Rickerby.<strong>Carl<strong>is</strong>le</strong> City Council own a number of sports <strong>and</strong> le<strong>is</strong>ure facilities across <strong>the</strong> d<strong>is</strong>trict. These<strong>in</strong>clude The S<strong>and</strong>s events centre which provides arts, enterta<strong>in</strong>ment, exhibitions <strong>and</strong> meet<strong>in</strong>gsas well as health <strong>and</strong> fitness facilities.There <strong>is</strong> a swimm<strong>in</strong>g pool complex which compr<strong>is</strong>es three swimm<strong>in</strong>g pools, Victorian Turk<strong>is</strong>hBaths, fitness room, <strong>and</strong> fitness studio.There are two municipal golf courses <strong>and</strong> a driv<strong>in</strong>g range with<strong>in</strong> <strong>the</strong> <strong>city</strong>.Bitts Park features syn<strong>the</strong>tic <strong>and</strong> grass tenn<strong>is</strong> courts <strong>and</strong> bowl<strong>in</strong>g green.As well as <strong>the</strong> above facilities <strong>the</strong>re are a number of dedicated sports clubs for privatemembers, for example tenn<strong>is</strong>, golf <strong>and</strong> bowl<strong>in</strong>g as well as several private membersgymnasiums.The Sheepmount Stadium features a six lane syn<strong>the</strong>tic track <strong>and</strong> field event facilities <strong>and</strong> a 300-seater gr<strong>and</strong>st<strong>and</strong>. The Stadium <strong>is</strong> home to <strong>the</strong> Border Harriers <strong>and</strong> Athletic Club <strong>and</strong> <strong>the</strong><strong>Carl<strong>is</strong>le</strong> & Aspatria Club. The site <strong>is</strong> also home to <strong>Carl<strong>is</strong>le</strong>'s Municipal pitches with eight soccerpitches, two cricket pitches <strong>and</strong> a 330-metre grass cycle track. The Homes of <strong>Carl<strong>is</strong>le</strong> City FC<strong>and</strong> <strong>the</strong> Cumberl<strong>and</strong> News Rifle Club also occupy <strong>the</strong> site. The Sheepmount toge<strong>the</strong>r with TheS<strong>and</strong>s Centre have been given <strong>the</strong> status of an accredited tra<strong>in</strong><strong>in</strong>g venue for <strong>the</strong> 2012 OlympicGames.Fiona Hunt<strong>in</strong>gton 43 of 47
The next stage of th<strong>is</strong> process <strong>is</strong> for venues to work on promot<strong>in</strong>g <strong>the</strong>ir facilities to attract<strong>in</strong>ternational athletes. Th<strong>is</strong> has led to representatives from <strong>Carl<strong>is</strong>le</strong> Le<strong>is</strong>ure Ltd – <strong>the</strong> companymanag<strong>in</strong>g <strong>Carl<strong>is</strong>le</strong> City council’s sport <strong>and</strong> le<strong>is</strong>ure facilities - be<strong>in</strong>g <strong>in</strong>volved with <strong>the</strong> <strong>Cumbria</strong>2012 steer<strong>in</strong>g group <strong>and</strong> <strong>the</strong> creation of a 6 year strategy lead<strong>in</strong>g to <strong>the</strong> London 2012 Games<strong>and</strong> beyond to <strong>the</strong> Glasgow Commonwealth games <strong>in</strong> 2014.Fiona Hunt<strong>in</strong>gton 44 of 47
REFERENCES AND BIBLIOGRAPPHY.Adv<strong>is</strong>ory Committee on Breast Screen<strong>in</strong>g (2006) Screen<strong>in</strong>g for breast cancer <strong>in</strong> <strong>Engl<strong>and</strong></strong>: past<strong>and</strong> future. Journal of Medical Screen<strong>in</strong>g. 13, 59-61ASH (2008) Facts at a glance - Smok<strong>in</strong>g Stat<strong>is</strong>tics.http://www.ash.org.uk/files/documents/ASH_93.pdf Accessed 4/7/08Ashton JR (2008) Health <strong>in</strong> <strong>Cumbria</strong> 2008 The Annual Report of <strong>the</strong> Director of PublicHealth <strong>Cumbria</strong> Primary Care Trust/ <strong>Cumbria</strong> County CouncilClay J (2007) A Time to be Born. Version 6. Report 2. General Issue (Non – <strong>NHS</strong> use).Public Health Directorate. <strong>Carl<strong>is</strong>le</strong>: <strong>Cumbria</strong> Primary Care Trust.Department for Environment Food <strong>and</strong> Rural Affairs (1997) The air quality strategy for<strong>Engl<strong>and</strong></strong>, Scotl<strong>and</strong>, Wales <strong>and</strong> Nor<strong>the</strong>rn Irel<strong>and</strong>. Norwich: HMSODepartment of Health (2001) National Service Framework for Older People. London:Department of HealthDepartment of Health (2006) <strong>NHS</strong> Cancer Screen<strong>in</strong>g Programmes. Cervical Screen<strong>in</strong>g – TheFacts. London: Crown Copyright.Department of Health (2006) <strong>NHS</strong> Cancer Screen<strong>in</strong>g Programmes. Breast Screen<strong>in</strong>g – TheFacts. London: Crown Copyright.Fone DL, Dunstan F (2006). Mental health places <strong>and</strong> people: a multilevel analys<strong>is</strong> of economic<strong>in</strong>activity <strong>and</strong> social deprivation. Health <strong>and</strong> Place. 12, 3, 332-44Ipsos MORI Social Research Institute (2006) <strong>Cumbria</strong> Quality of Life Survey 2006. <strong>Carl<strong>is</strong>le</strong>D<strong>is</strong>trict Report. <strong>Cumbria</strong> County Council.http://www.cumbria.gov.uk/eLibrary/Content/Internet/536/646/39093112213.ppt Accessed4/7/08J<strong>in</strong> RL, Shah CP, Svoboda TJ (1995) The impact of unemployment on health: a review of <strong>the</strong>evidence. Canadian Medical Association Journal. 153, 5, 529-40Maller C, Townsend M, Pryor A, Brown P, St Leger L (2006) Healthy nature healthy people:’contact with nature@ as an upstream health promotion <strong>in</strong>tervention for populations. HealthPromotion International. 21, 1, 45-542Massey P (2007) Income, <strong>in</strong>equality <strong>and</strong> health status: a nurs<strong>in</strong>g <strong>is</strong>sue. Australian Journal ofAdvanced Nurs<strong>in</strong>g 25, 2, 84-88Office for National Stat<strong>is</strong>tics (2008) Key figures for people <strong>and</strong> society: Population <strong>and</strong>Migration.http://www.neighbourhood.stat<strong>is</strong>tics.gov.uk/d<strong>is</strong>sem<strong>in</strong>ation/LeadKeyFigures.do?a=7&b=276912&c=carl<strong>is</strong>le&d=13&e=13&g=432052&i=1001x1003x1004&m=0&r=1&s=1215178984798&enc=1Accessed 1/5/08Office of <strong>the</strong> Deputy Prime M<strong>in</strong><strong>is</strong>ter (2005) Work<strong>in</strong>g Paper 7: Homeless Families. London:ODPMFiona Hunt<strong>in</strong>gton 45 of 47
Pearce D (2003) North <strong>Cumbria</strong> Health <strong>and</strong> Lifestyle Survey. A report on <strong>the</strong> health <strong>and</strong>lifestyles of <strong>the</strong> population of North <strong>Cumbria</strong>. Public Health Directorate. North <strong>Cumbria</strong>Primary Care Trusts.Fiona Hunt<strong>in</strong>gton 46 of 47


