1.1 Students Who Bully: Summary DescriptionSummary: Social <strong>and</strong> <strong>emotional</strong> characteristics clearly <strong>different</strong>iate <strong>students</strong> <strong>who</strong> <strong>bully</strong> from<strong>students</strong> <strong>who</strong> do not <strong>bully</strong>. Larger percentages <strong>of</strong> <strong>students</strong> <strong>who</strong> <strong>bully</strong> in comparison with <strong>students</strong><strong>who</strong> do not <strong>bully</strong> experience <strong>emotional</strong> <strong>and</strong> behavioural problems (lose their temper, stress,worry, feel down, drink alcohol, use drugs). Smaller percentages <strong>of</strong> <strong>students</strong> <strong>who</strong> <strong>bully</strong>experience positive indicators <strong>of</strong> SEWB (get along with teachers, achieve to the best <strong>of</strong> theirability, volunteer). Teachers say that just over 50 percent <strong>of</strong> <strong>students</strong> <strong>who</strong> <strong>bully</strong> have positiveself-esteem; just under 50 percent <strong>of</strong> <strong>students</strong> <strong>who</strong> <strong>bully</strong> have positive self-esteem. In terms <strong>of</strong>resilience, teachers report lower percentages <strong>of</strong> <strong>students</strong> <strong>who</strong> <strong>bully</strong> in comparison with <strong>students</strong><strong>who</strong> do not <strong>bully</strong> display the ability to manage their emotions (anger, depression) <strong>and</strong> to thinkbefore they act (impulsive, low frustration tolerance). In terms <strong>of</strong> a positive <strong>social</strong> orientation,smaller percentages <strong>of</strong> <strong>students</strong> <strong>who</strong> <strong>bully</strong> in comparison with those <strong>who</strong> do not <strong>bully</strong> display<strong>social</strong> skills (e.g., empathy, conflict resolution, friendship making) <strong>and</strong> values (e.g., honesty,integrity). In terms <strong>of</strong> a positive work orientation, with the exception <strong>of</strong> work confidence, smallerpercentages <strong>of</strong> <strong>students</strong> <strong>who</strong> <strong>bully</strong> display learning capabilities (persistence, organisation,teamwork). Differences between the percentages <strong>of</strong> <strong>students</strong> in the two groups perceivingpositive indicators in school, home <strong>and</strong> community are relatively small with the exception <strong>of</strong> alower percentage <strong>of</strong> <strong>students</strong> <strong>who</strong> <strong>bully</strong> <strong>who</strong> report having friends <strong>who</strong> behave well <strong>and</strong> try hardthan <strong>students</strong> <strong>who</strong> do not <strong>bully</strong>.<strong>The</strong> percentage <strong>of</strong> <strong>students</strong> in the total sample <strong>who</strong> say they <strong>bully</strong> others (<strong>who</strong> say they aresometimes quite mean to others) <strong>and</strong> <strong>who</strong> teachers say physically <strong>bully</strong> or verbally taunt other<strong>students</strong> are reported below in Table 1.1.Table 1.1 Percentages <strong>of</strong> Students Who BullyStudent SurveyStudents Who BullyTeacher SurveyStudents Who BullyTotal Sample 33%(3,804 <strong>students</strong>)17%(1,166 <strong>students</strong>)SEWB Level 6 (Highest) 1% (3 <strong>students</strong>) 1% (19 <strong>students</strong>)SEWB Level 5 (Very High) 11% (344 <strong>students</strong>) 4% (55 <strong>students</strong>)SEWB Level 4 (High) 27% (843 <strong>students</strong>) 9% (91 <strong>students</strong>)SEWB Level 3 (Low) 44% (1,217 <strong>students</strong>) 19% (195 <strong>students</strong>)SEWB Level 2 (Very Low) 60% (1,141 <strong>students</strong>) 31% (129 <strong>students</strong>)SEWB Level 1 (Lowest) 72% (216 <strong>students</strong>) 60% (675 <strong>students</strong>)<strong>The</strong> 17% <strong>of</strong> <strong>students</strong> <strong>who</strong> teachers say <strong>bully</strong> other <strong>students</strong> is similar to percentages reported inresearch (e.g., Rigby & Slee, 1999). <strong>The</strong> higher percentage <strong>of</strong> 33% <strong>of</strong> <strong>students</strong> <strong>who</strong> report beingquite mean to others may reflect the fact that <strong>students</strong> can be mean to another person while not<strong>bully</strong>ing the person as when they are having an argument with another or are fighting withanother person <strong>of</strong> equal status. Or it may be that teachers are not fully aware <strong>of</strong> the extent <strong>of</strong><strong>bully</strong>ing behaviour.<strong>The</strong> data reveals that <strong>bully</strong>ing is displayed by <strong>students</strong> at all levels <strong>of</strong> SEWB but far greaterpercentages <strong>of</strong> <strong>students</strong> <strong>who</strong> are at lower SEWB levels are likely to <strong>bully</strong> than the percentages <strong>of</strong><strong>students</strong> at higher SEWB levels.8
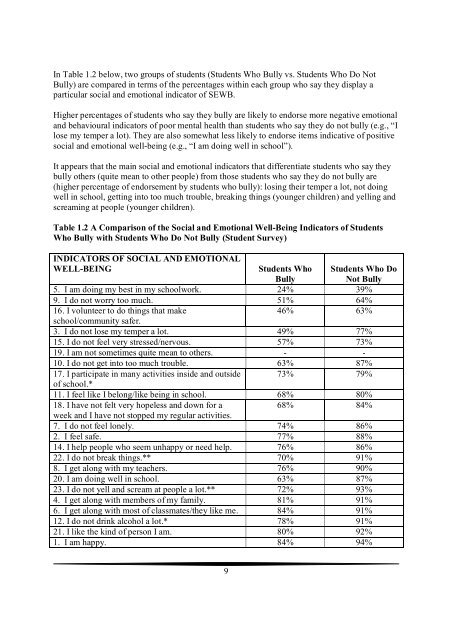
In Table 1.2 below, two groups <strong>of</strong> <strong>students</strong> (Students Who Bully vs. Students Who Do NotBully) are compared in terms <strong>of</strong> the percentages within each group <strong>who</strong> say they display aparticular <strong>social</strong> <strong>and</strong> <strong>emotional</strong> indicator <strong>of</strong> SEWB.Higher percentages <strong>of</strong> <strong>students</strong> <strong>who</strong> say they <strong>bully</strong> are likely to endorse more negative <strong>emotional</strong><strong>and</strong> behavioural indicators <strong>of</strong> poor mental health than <strong>students</strong> <strong>who</strong> say they do not <strong>bully</strong> (e.g., “Ilose my temper a lot). <strong>The</strong>y are also somewhat less likely to endorse items indicative <strong>of</strong> positive<strong>social</strong> <strong>and</strong> <strong>emotional</strong> well-being (e.g., “I am doing well in school”).It appears that the main <strong>social</strong> <strong>and</strong> <strong>emotional</strong> indicators that <strong>different</strong>iate <strong>students</strong> <strong>who</strong> say they<strong>bully</strong> others (quite mean to other people) from those <strong>students</strong> <strong>who</strong> say they do not <strong>bully</strong> are(higher percentage <strong>of</strong> endorsement by <strong>students</strong> <strong>who</strong> <strong>bully</strong>): losing their temper a lot, not doingwell in school, getting into too much trouble, breaking things (younger children) <strong>and</strong> yelling <strong>and</strong>screaming at people (younger children).Table 1.2 A Comparison <strong>of</strong> the Social <strong>and</strong> Emotional Well-Being Indicators <strong>of</strong> StudentsWho Bully with Students Who Do Not Bully (Student Survey)INDICATORS OF SOCIAL AND EMOTIONALWELL-BEINGStudents WhoBully5. I am doing my best in my schoolwork. 24% 39%9. I do not worry too much. 51% 64%16. I volunteer to do things that make46% 63%school/community safer.3. I do not lose my temper a lot. 49% 77%15. I do not feel very stressed/nervous. 57% 73%19. I am not sometimes quite mean to others. - -10. I do not get into too much trouble. 63% 87%Students Who DoNot Bully17. I participate in many activities inside <strong>and</strong> outside 73% 79%<strong>of</strong> school.*11. I feel like I belong/like being in school. 68% 80%18. I have not felt very hopeless <strong>and</strong> down for a68% 84%week <strong>and</strong> I have not stopped my regular activities.7. I do not feel lonely. 74% 86%2. I feel safe. 77% 88%14. I help people <strong>who</strong> seem unhappy or need help. 76% 86%22. I do not break things.** 70% 91%8. I get along with my teachers. 76% 90%20. I am doing well in school. 63% 87%23. I do not yell <strong>and</strong> scream at people a lot.** 72% 93%4. I get along with members <strong>of</strong> my family. 81% 91%6. I get along with most <strong>of</strong> classmates/they like me. 84% 91%12. I do not drink alcohol a lot.* 78% 91%21. I like the kind <strong>of</strong> person I am. 80% 92%1. I am happy. 84% 94%9