Integration - the Australian Mathematical Sciences Institute
Integration - the Australian Mathematical Sciences Institute
Integration - the Australian Mathematical Sciences Institute

Create successful ePaper yourself
Turn your PDF publications into a flip-book with our unique Google optimized e-Paper software.
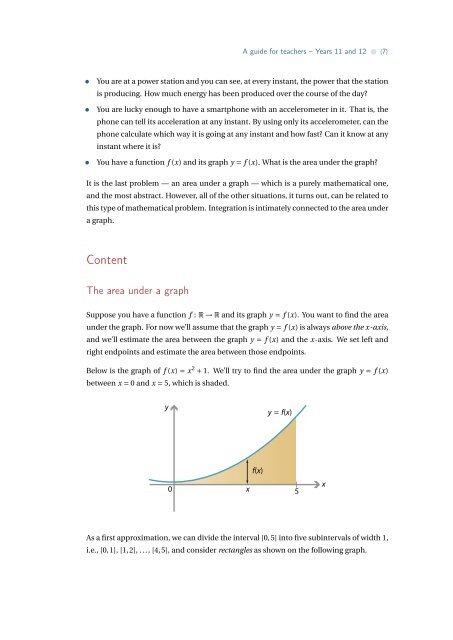
A guide for teachers – Years 11 and 12 • {7}• You are at a power station and you can see, at every instant, <strong>the</strong> power that <strong>the</strong> stationis producing. How much energy has been produced over <strong>the</strong> course of <strong>the</strong> day?• You are lucky enough to have a smartphone with an accelerometer in it. That is, <strong>the</strong>phone can tell its acceleration at any instant. By using only its accelerometer, can <strong>the</strong>phone calculate which way it is going at any instant and how fast? Can it know at anyinstant where it is?• You have a function f (x) and its graph y = f (x). What is <strong>the</strong> area under <strong>the</strong> graph?It is <strong>the</strong> last problem — an area under a graph — which is a purely ma<strong>the</strong>matical one,and <strong>the</strong> most abstract. However, all of <strong>the</strong> o<strong>the</strong>r situations, it turns out, can be related tothis type of ma<strong>the</strong>matical problem. <strong>Integration</strong> is intimately connected to <strong>the</strong> area undera graph.ContentThe area under a graphSuppose you have a function f : R → R and its graph y = f (x). You want to find <strong>the</strong> areaunder <strong>the</strong> graph. For now we’ll assume that <strong>the</strong> graph y = f (x) is always above <strong>the</strong> x-axis,and we’ll estimate <strong>the</strong> area between <strong>the</strong> graph y = f (x) and <strong>the</strong> x-axis. We set left andright endpoints and estimate <strong>the</strong> area between those endpoints.Below is <strong>the</strong> graph of f (x) = x 2 + 1. We’ll try to find <strong>the</strong> area under <strong>the</strong> graph y = f (x)between x = 0 and x = 5, which is shaded.yy = f(x)f(x)0 x5xAs a first approximation, we can divide <strong>the</strong> interval [0,5] into five subintervals of width 1,i.e., [0,1], [1,2], ..., [4,5], and consider rectangles as shown on <strong>the</strong> following graph.