Integration - the Australian Mathematical Sciences Institute
Integration - the Australian Mathematical Sciences Institute
Integration - the Australian Mathematical Sciences Institute

Create successful ePaper yourself
Turn your PDF publications into a flip-book with our unique Google optimized e-Paper software.
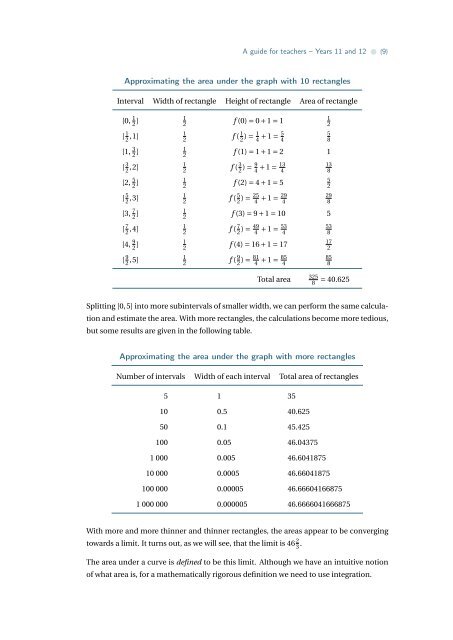
A guide for teachers – Years 11 and 12 • {9}Approximating <strong>the</strong> area under <strong>the</strong> graph with 10 rectanglesInterval Width of rectangle Height of rectangle Area of rectangle[0, 1 2 ] 12f (0) = 0 + 1 = 1[ 1 2 ,1] 12f ( 1 2 ) = 1 4 + 1 = 5 4[1, 3 2 ] 12f (1) = 1 + 1 = 2 1[ 3 2 ,2] 12f ( 3 2 ) = 9 4 + 1 = 13 4[2, 5 2 ] 12f (2) = 4 + 1 = 5[ 5 2 ,3] 12f ( 5 2 ) = 25 4 + 1 = 29 4[3, 7 2 ] 12f (3) = 9 + 1 = 10 5[ 7 2 ,4] 12f ( 7 2 ) = 49 4 + 1 = 53 4[4, 9 2 ] 12f (4) = 16 + 1 = 17[ 9 2 ,5] 12f ( 9 2 ) = 81 4 + 1 = 85 4125813852298538172858Total area3258 = 40.625Splitting [0,5] into more subintervals of smaller width, we can perform <strong>the</strong> same calculationand estimate <strong>the</strong> area. With more rectangles, <strong>the</strong> calculations become more tedious,but some results are given in <strong>the</strong> following table.Approximating <strong>the</strong> area under <strong>the</strong> graph with more rectanglesNumber of intervals Width of each interval Total area of rectangles5 1 3510 0.5 40.62550 0.1 45.425100 0.05 46.043751 000 0.005 46.604187510 000 0.0005 46.66041875100 000 0.00005 46.666041668751 000 000 0.000005 46.6666041666875With more and more thinner and thinner rectangles, <strong>the</strong> areas appear to be convergingtowards a limit. It turns out, as we will see, that <strong>the</strong> limit is 46 2 3 .The area under a curve is defined to be this limit. Although we have an intuitive notionof what area is, for a ma<strong>the</strong>matically rigorous definition we need to use integration.