MOL Hungarian Oil and Gas Public Limited Company
MOL Hungarian Oil and Gas Public Limited Company
MOL Hungarian Oil and Gas Public Limited Company

You also want an ePaper? Increase the reach of your titles
YUMPU automatically turns print PDFs into web optimized ePapers that Google loves.
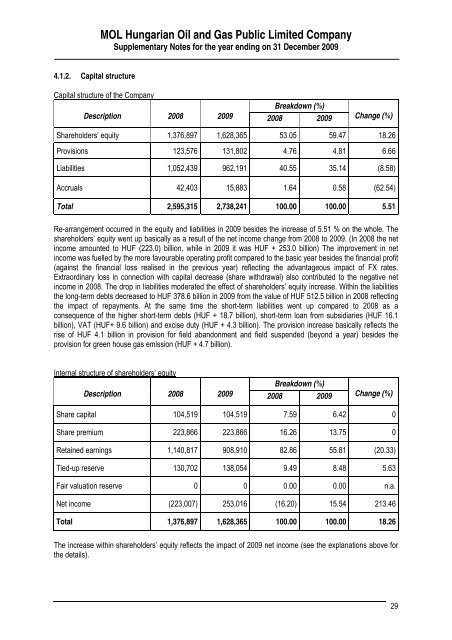
<strong>MOL</strong> <strong>Hungarian</strong> <strong>Oil</strong> <strong>and</strong> <strong>Gas</strong> <strong>Public</strong> <strong>Limited</strong> <strong>Company</strong>Supplementary Notes for the year ending on 31 December 20094.1.2. Capital structureCapital structure of the <strong>Company</strong>Breakdown (%)Description 2008 2009 2008 2009 Change (%)Shareholders’ equity 1,376,897 1,628,365 53.05 59.47 18.26Provisions 123,576 131,802 4.76 4.81 6.66Liabilities 1,052,439 962,191 40.55 35.14 (8.58)Accruals 42,403 15,883 1.64 0.58 (62.54)Total 2,595,315 2,738,241 100.00 100.00 5.51Re-arrangement occurred in the equity <strong>and</strong> liabilities in 2009 besides the increase of 5.51 % on the whole. Theshareholders’ equity went up basically as a result of the net income change from 2008 to 2009. (In 2008 the netincome amounted to HUF (223.0) billion, while in 2009 it was HUF + 253.0 billion) The improvement in netincome was fuelled by the more favourable operating profit compared to the basic year besides the financial profit(against the financial loss realised in the previous year) reflecting the advantageous impact of FX rates.Extraordinary loss in connection with capital decrease (share withdrawal) also contributed to the negative netincome in 2008. The drop in liabilities moderated the effect of shareholders’ equity increase. Within the liabilitiesthe long-term debts decreased to HUF 378.6 billion in 2009 from the value of HUF 512.5 billion in 2008 reflectingthe impact of repayments. At the same time the short-term liabilities went up compared to 2008 as aconsequence of the higher short-term debts (HUF + 18.7 billion), short-term loan from subsidiaries (HUF 16.1billion), VAT (HUF+ 9.6 billion) <strong>and</strong> excise duty (HUF + 4.3 billion). The provision increase basically reflects therise of HUF 4.1 billion in provision for field ab<strong>and</strong>onment <strong>and</strong> field suspended (beyond a year) besides theprovision for green house gas emission (HUF + 4.7 billion).Internal structure of shareholders’ equityBreakdown (%)Description 2008 2009 2008 2009 Change (%)Share capital 104,519 104,519 7.59 6.42 0Share premium 223,866 223,866 16.26 13.75 0Retained earnings 1,140,817 908,910 82.86 55.81 (20.33)Tied-up reserve 130,702 138,054 9.49 8.48 5.63Fair valuation reserve 0 0 0.00 0.00 n.a.Net income (223,007) 253,016 (16.20) 15.54 213.46Total 1,376,897 1,628,365 100.00 100.00 18.26The increase within shareholders’ equity reflects the impact of 2009 net income (see the explanations above forthe details).29