MOL Hungarian Oil and Gas Public Limited Company
MOL Hungarian Oil and Gas Public Limited Company
MOL Hungarian Oil and Gas Public Limited Company

Create successful ePaper yourself
Turn your PDF publications into a flip-book with our unique Google optimized e-Paper software.
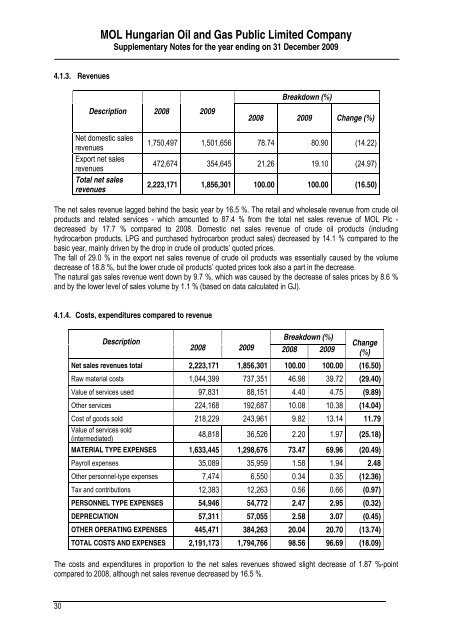
<strong>MOL</strong> <strong>Hungarian</strong> <strong>Oil</strong> <strong>and</strong> <strong>Gas</strong> <strong>Public</strong> <strong>Limited</strong> <strong>Company</strong>Supplementary Notes for the year ending on 31 December 20094.1.3. RevenuesDescription 2008 2009Breakdown (%)2008 2009 Change (%)Net domestic salesrevenuesExport net salesrevenuesTotal net salesrevenues1,750,497 1,501,656 78.74 80.90 (14.22)472,674 354,645 21.26 19.10 (24.97)2,223,171 1,856,301 100.00 100.00 (16.50)The net sales revenue lagged behind the basic year by 16.5 %. The retail <strong>and</strong> wholesale revenue from crude oilproducts <strong>and</strong> related services - which amounted to 87.4 % from the total net sales revenue of <strong>MOL</strong> Plc -decreased by 17.7 % compared to 2008. Domestic net sales revenue of crude oil products (includinghydrocarbon products, LPG <strong>and</strong> purchased hydrocarbon product sales) decreased by 14.1 % compared to thebasic year, mainly driven by the drop in crude oil products’ quoted prices.The fall of 29.0 % in the export net sales revenue of crude oil products was essentially caused by the volumedecrease of 18.8 %, but the lower crude oil products’ quoted prices took also a part in the decrease.The natural gas sales revenue went down by 9.7 %, which was caused by the decrease of sales prices by 8.6 %<strong>and</strong> by the lower level of sales volume by 1.1 % (based on data calculated in GJ).4.1.4. Costs, expenditures compared to revenueDescriptionBreakdown (%)2008 2009 2008 2009Change(%)Net sales revenues total 2,223,171 1,856,301 100.00 100.00 (16.50)Raw material costs 1,044,399 737,351 46.98 39.72 (29.40)Value of services used 97,831 88,151 4.40 4.75 (9.89)Other services 224,168 192,687 10.08 10.38 (14.04)Cost of goods sold 218,229 243,961 9.82 13.14 11.79Value of services sold(intermediated)48,818 36,526 2.20 1.97 (25.18)MATERIAL TYPE EXPENSES 1,633,445 1,298,676 73.47 69.96 (20.49)Payroll expenses 35,089 35,959 1.58 1.94 2.48Other personnel-type expenses 7,474 6,550 0.34 0.35 (12.36)Tax <strong>and</strong> contributions 12,383 12,263 0.56 0.66 (0.97)PERSONNEL TYPE EXPENSES 54,946 54,772 2.47 2.95 (0.32)DEPRECIATION 57,311 57,055 2.58 3.07 (0.45)OTHER OPERATING EXPENSES 445,471 384,263 20.04 20.70 (13.74)TOTAL COSTS AND EXPENSES 2,191,173 1,794,766 98.56 96.69 (18.09)The costs <strong>and</strong> expenditures in proportion to the net sales revenues showed slight decrease of 1.87 %-pointcompared to 2008, although net sales revenue decreased by 16.5 %.30