

Annual Report 30 June 2007 - One Horizon Group
Annual Report 30 June 2007 - One Horizon Group
Annual Report 30 June 2007 - One Horizon Group

You also want an ePaper? Increase the reach of your titles
YUMPU automatically turns print PDFs into web optimized ePapers that Google loves.
18<br />
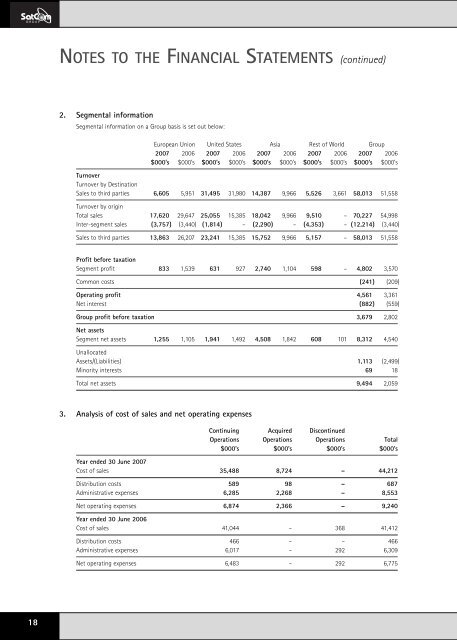
NOTES TO THE FINANCIAL STATEMENTS (continued)<br />
2. Segmental information<br />
Segmental information on a <strong>Group</strong> basis is set out below:<br />
European Union United States Asia Rest of World <strong>Group</strong><br />
<strong>2007</strong> 2006 <strong>2007</strong> 2006 <strong>2007</strong> 2006 <strong>2007</strong> 2006 <strong>2007</strong> 2006<br />
$000’s $000’s $000’s $000’s $000’s $000’s $000’s $000’s $000’s $000’s<br />
Turnover<br />
Turnover by Destination<br />
Sales to third parties 6,605 5,951 31,495 31,980 14,387 9,966 5,526 3,661 58,013 51,558<br />
Turnover by origin<br />
Total sales 17,620 29,647 25,055 15,385 18,042 9,966 9,510 – 70,227 54,998<br />
Inter-segment sales (3,757) (3,440) (1,814) – (2,290) – (4,353) – (12,214) (3,440)<br />
Sales to third parties 13,863 26,207 23,241 15,385 15,752 9,966 5,157 – 58,013 51,558<br />
Profit before taxation<br />
Segment profit 833 1,539 631 927 2,740 1,104 598 – 4,802 3,570<br />
Common costs (241) (209)<br />
Operating profit 4,561 3,361<br />
Net interest (882) (559)<br />
<strong>Group</strong> profit before taxation 3,679 2,802<br />
Net assets<br />
Segment net assets 1,255 1,105 1,941 1,492 4,508 1,842 608 101 8,312 4,540<br />
Unallocated<br />
Assets/(Liabilities) 1,113 (2,499)<br />
Minority interests 69 18<br />
Total net assets 9,494 2,059<br />
3. Analysis of cost of sales and net operating expenses<br />
Continuing Acquired Discontinued<br />
Operations Operations Operations Total<br />
$000’s $000’s $000’s $000’s<br />
Year ended <strong>30</strong> <strong>June</strong> <strong>2007</strong><br />
Cost of sales 35,488 8,724 – 44,212<br />
Distribution costs 589 98 – 687<br />
Administrative expenses 6,285 2,268 – 8,553<br />
Net operating expenses 6,874 2,366 – 9,240<br />
Year ended <strong>30</strong> <strong>June</strong> 2006<br />
Cost of sales 41,044 – 368 41,412<br />
Distribution costs 466 – – 466<br />
Administrative expenses 6,017 – 292 6,<strong>30</strong>9<br />
Net operating expenses 6,483 – 292 6,775