Lesson 27 Production - Alaska Geobotany Center
Lesson 27 Production - Alaska Geobotany Center
Lesson 27 Production - Alaska Geobotany Center

You also want an ePaper? Increase the reach of your titles
YUMPU automatically turns print PDFs into web optimized ePapers that Google loves.
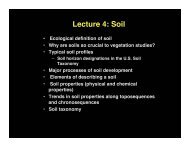
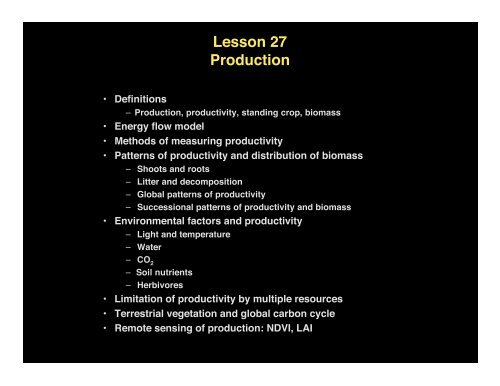
<strong>Lesson</strong> <strong>27</strong><strong>Production</strong>• Definitions– <strong>Production</strong>, productivity, standing crop, biomass• Energy flow model• Methods of measuring productivity• Patterns of productivity and distribution of biomass– Shoots and roots– Litter and decomposition– Global patterns of productivity– Successional patterns of productivity and biomass• Environmental factors and productivity– Light and temperature– Water– CO 2– Soil nutrients– Herbivores• Limitation of productivity by multiple resources• Terrestrial vegetation and global carbon cycle• Remote sensing of production: NDVI, LAI
<strong>Production</strong> basic definitions• Plant biomass: The dry weight of plant material at any point intime expressed as mass/unit area (e.g., g m -2 )includesdeadmaterial (= phytomass, standing crop).• Primary productivity: The conversion of sunlight to biomass,usually measured over a period of one year (e.g., g m -2 yr -1 )– Gross primary productivity (GPP): The total amount of biomasscreated by plants per unit time.– Net primary productivity (NPP): The total amount of biomass minusrespiration per unit time.
Energy flow diagram for conversion of sunlightto plant biomass (standing crop)• A portion of solar radiation isconverted to gross primaryproduction (GPP).• Part of this is lost throughrespiration.• The net primary production(NPP) is what remains afterrespiration.• The standing crop is thebiomass measured at any pointin time, and reflects losses dueto detritus and herbivory. Itincludes the live and deadcomponents of the above- andbelow-ground plant parts.
EfficiencyEfficiency is the ratio of output to input of energy at variouspoints along the pathways of energy flow within a plant or ecosystem.
Above- and belowground NPP vs. temperature• Productivity increases along themean annual temperaturegradient from the poles towardthe equator.• Optimum temperatures forproductivity coincide with the 15-25˚C optimum range forphotosynthesis.• Length of the growing seasonmay be a more importantdeterminant than temperatureitself.• The wide spread of points fromthe line indicate that manyenvironmental factors other thantemperature affect productivity.From Leith 1973• Light and temperature influencewater use and availability and, asa result, have few completelyindependent effects.
NPP vs. precipitation and evapotranspirationPrecipitation• WATER is the environmental factor mostdirectly correlated with productivity is water.• NPP vs. total annual precipitiation is goodbelow about 500 mm in arid regions becauseprecipitation and ET rates are nearly equal.• At higher precipitation, much of the annualprecipitation can be lost to runoff or to deepgroundwater tables.EvapotranspirationFrom Leith 1973• The influence of winter snowfall can beminimal in some areas (e.g., the Arctic)because ground is frozen when it runs off.• ET rates are a better predictor because itincludes the influence not only of water butalso of light and temperature.From Rosenzweig 1968
Fitted curves of NPP vs. reality along the Santa Catalina Mountainselevation gradient• The sudden rise in NPP atabout 700 m corresponds tothe transition from openwoodland (Pinon pine?)forests to dense woodland(Pinus ponderosa?).• The dashed leveling off ofthe curve at about 1500 g m -2yr -1 is the estimatedmaximum NPP for climaxtemperate forests.(a) NPP predicted from Rosenzweig (1968) in relation to annual ET(b) Prediction from Leith (1973) in relation to annual precipitation(c)Actual NPP from Whittaker and Niering (1975)
Causes of variation in production are often not simpleRelationship of NPP to N availability, nitrification, and soil texture: Blackhawk Island, WI• There is a highly significant positivecorrelation between NPP and nitrogenavailability among different foreststand types on Blackhawk Island.N availability• Similar correlation between NPP andsoil texture.• Indicates that although there isnitrogen limitation, the positivecorrelation between N availability andsoil texture suggests that both NPPand nitrogen mineralization arecontrolled by the same factor, wateravailability, which is stronglyinfluenced by soil texture.Nitrification• Differences in production are oftenrelated to differences in N, but otheredaphic characteristics, such as soiltexture and depth, can stronglyinfluence N patterns.Soil texturePastor et al. 1984
CO 2concentrations in a forest canopy at different times of day• In mid-afternoon the CO 2 concentrationsare significantly reduced in the portion ofthe canopy with the highest LAI, and thereis a steep gradient between the canopy andthe forest floor.• The concentrations are highest near theforest floor because of fine-root respirationand the low diffusivity of CO 2 near theground.• Because most plants emit CO 2 at night theconcentrations inside the canopy risequickly following sunset.From Holmén 1992
Successional pattern of productivity• Productivity tends toincrease steadilyduring the earlyphases of successionand then decline asthe forest matures andthe self-perpetuatingclimax trees reachmaturity.• Botkin hasdeveloped modelsthat show that forestgrowth reaches apeak in about 200years, then drops 30-40% during thefollowing 200 years.From Loucks, L. 1970.
Factors contributing to declining forestproductivity with greater age• Decline in photosynthetic efficiency of older trees (Waring andSchlesinger 1985).• Allocation of a greater proportion of NPP to nonphotosyntheticstructural biomass (stems).• Limitations imposed upon LAI by canopy form and leaf orientation(Horn 1974).• Binding of nutrients into structural biomass (Connell and Slatyer1977).
Limitation of productivity by multiple resources: The transient maximahypothesis (Seastedt and Knapp 1993)Periodic fireDrought•The TMH explains patterns of productivity of anynonequlibrium ecosystem. It was developed for tallgrass prairies, ecosystems that experience frequenttemporal shifts in limiting factors - namely light,water, and nutrients.•These are mediated by fire, grazing, and drought.•Periodic Fire: In the upper diagram, during longperiods of no fire, detritus builds up. This serves as afilter for sunlight, water, and atmospheric N. After afire, sunlight increases in a stepwise fashion. Soilnitrogen is depleted following fire because of thesudden increase in ANPP and slowly rebuilds in thesoil from atmospheric deposition once light becomesthe limiting factor. Productivity is highest (in atransient fashion) following fire because of thesudden pulse of both light and nitrogen. It exceedsthe ANPP under “annual fire” scenario.•Drought: Under a drought scenario, NPP declinesto a low level because of water limitation. Soil Naccumulates during the drought because of reducedproduction from water limitation. Once waterbecomes available again, there is increasedproduction because of abundant N.
Biomass distribution in major terrestrial biomesChapin Matson and Mooney, in pressData from Roy 2001
NPP and biomass in the major ecosystems1. Tropical rain forests account for about 32% of the total NPP, and 42% of the total dry biomass, although they cover only about11.4% of the terrestrial surface.2. All tropical forests combined (rainforests and tropical seasonal forests) account for about 42% of the total NPP and 55.7% ofthe total biomass and cover about 16% if the terrestrial surface.3. Savannas have the next highest NPP with 11.4% of the total NPP, 3% of the biomass, and cover about 10% of the totalterrestrial surface.4. Boreal forests account for about 7.1% of the total and they cover about 8% of the terrestrial surface.5. Tundra covers about 5.4% of the terrestrial surface, but has less than 1% of the total NPP, and on 0.3% of the total biomass.
Global NPP and related characteristics of terrestrial biomes:• Terrestrial vegetation occupies about 30% of the earth s surface.• It accounts for 62% of the earth s primary productivity (theremainder is marine primary productivity).• Total global NPP is about 224.5 Pg yr -1 . (Pg = 10 15 g).• About 132.2 Pg yr -1 is from terrestrial systems.
Total above- and belowground carbon in major ecosystems• Although Arctic andBoreal systems haverelatively modestamounts of abovegroundcarbon, they have hugestores of belowgroundcarbon. This is thecarbon that is of greatestconcern in the Arctic.• It is currently unknownwhether a large portionof this carbon will beconverted to CO 2through decomposition,and thus create afeedback leading to evenhigher atmospherictemperature, orwhether increasedtemperature will lead toincreased productivityand greater biomassstorage.
Net Ecosystem <strong>Production</strong> (NEP)• NEP is the rate of carbonaccumulation in an ecosystem• It is the difference between GPPand respiration .From Chapin, Matson, and Mooney, in press
Major carbon pools and fluxes• The atmosphere is one ofthe more dynamiccomponents of the globalcarbon cycle.• Carbon fluxes here areabout 150-160 Gt per year,or about 20% of the totalcarbon store (750 Gt).• Major sources of carbon tothe atmosphere are soil andvegetation respiration,respiration from the ocean,burning related to land-usechanges, and fossil fuel andcement production.• Major sinks are the plantbiomass and the ocean.From Schimel 1995
Atmospheric CO 2 versus time for the past 550 million yearsHowever, the recent history ofatmospheric CO 2 is just a blipcompared to the fluctuationsthat have occurred in thegeologic past!Silurian-Devonian boundaryRelative CO 2to presentPermian-Triassic boundaryModified from Berner 1997
Global productivity models• Numerous process-based ecosystem models are being used incombination with global climate models (GCMs) to predict theconsequences of increased temperature and CO 2levels.• The Terrestrial Ecosystem Model (TEM; Melillo et al. 1993) is onesuch model.• This model predicts a 16% increase of global NPP with a doublingof the CO 2and no increase in temperature.• Increases in temperature without a change in CO 2results in littlechange in NPP.• Doubling CO 2, combined with a 4˚C temperature increase, resultedin a 20-26% increase in productivity.• Northern and temperate ecosystems responded the most becauseof temperature mediated increases in nitrogen availability.
Methods of measuring biomass orproperties of ecosystem that are surrogates of biomass• Aboveground biomass– Clip harvest– Dimension analysis• Belowground biomass– Soil cores– In situ root washing– Root ingrowth bags– Mini-rhizotrons (root length, root production, death)• Leaf area index (LAI)– Point frame– LAI-2000• Remote sensing vegetation indices– Normalized difference vegetation index (NDVI)
Net primary productivity (NPP)NPP = (W t+1 -W t )+D+H(W t+1 - W t ) = difference in biomass between twoharvestsD = biomass lost to decompositionH = is the biomass lost to herbivory
Clip Harvest• Normally, several small representative areas (e.g. 0.1 m 2 forgraminoid communities) are clipped.• Normally it is desirable to provide detail on plant functionaltypes or species so the sample is sorted into componentparts.• Sorting of the harvest can be by any of several criteria, orcombination thereof, for example:1. Species2. Growth forms3. Live vs. dead4. Foliar vs. woody (useful for determining green biomass)5. Plant parts (flowers, stems, leaves, seeds, etc.).• Once sorted, the components are oven dried (105° C) andweighed, and biomass expressed as mass/unit area
<strong>Alaska</strong> Biomass SortingForbs Graminoids Dwarf Shrubs Horsetails Mosses LichensLive Dead Live Dead Live DeadEvergreen DeciduousWoody Foliar Woody FoliarLive DeadLive Dead
Dimension analysis: Harvest and RegressionMethod for TreesBiomassmassdbhdbh• In forests, it is difficult to clip representativeareas, so it is necessary to use a statisticalapproach of relating tree diameter to treemass.• This is done by harvesting a few trees andthen developing a regression of mass vs.diameter at breast heigtht for each speciesdbh• Biomass of a stand can then be calculatedby measuring the diameters of all trees andthen determining the biomass from theregressions.• Separate regressions must be developed foreach tree species.
Belowground biomass• Below ground harvest– Much more difficult to obtain.– In herbaceous vegetation several cores are take by taken by pressinga coring tube (e.g., 10-cm diameter) into the soil and extracting soilcontaining roots.– The cores are washed to remove the soil.– Live from dead roots can sometimes be determined by color of theroots, or application of tetrazolium salts.– Woody root systems may require excavation and exposure of the rootsystem in situ.• Root ingrowth bags to determine root productivity– Numerous small nylon mesh bags of known diameter and volume arefilled with soil and inserted into the ground.– These are retrieved at intervals, and the ingrown roots are removedand weighed.• Minirhizotrons– Photos taken at regular intervals along a tube inserted into theground. Patterns of fine roots are photographed at several timesduring the summer, and root growth is recorded on video.– Growth is obtained by taking periodic photos.
Minirhizotronapparatus of Roger Ruess
Photo of roots through the minirhizotron apparatus
Four litter trap designsLitter traps are used for capturing detritus that would otherwise fall to the ground andbe difficult to separate from previous years/ litter.
Litterfall for major ecosystems• Litterfall inTropicalRainforests isabout 5-10 timesthat of tiagaforests, and about20 times that oftundra.
Leaf Area Index (LAI)• LAI is a nondestructive, relatively fast method of obtaining anestimate of biomass.• An index of the ratio of the area of leaves and green vegetation inthe plant canopy per unit area of ground surface• The only way to get true leaf area is to strip all the leaves off theplants and measure their area. All other methods provide an“index” of this value (e.g. inclined point frame, LICOR-2000).• Regression methods are used to relate biomass to leaf area.
Relationship between leaf area duration and gross productivity• Total production is afunction of the leaf areaand the length of time thatthe leaves remain on thetrees.• Leaf area duration (LAD)is the LAI times the lengthof the growing season inmonths. So a combinationof high LAI and longgrowing season will resultin the highestproductivity.Filled circles: broad leaf treesOpen circles: needle-leavedtreesFrom Kira (1975)
Inclined Point Frame for measuring LAIWarren Wilson, J. 1959. Analysis of the distribution of foliage area ingrassland. In: J. D. Ivins (Ed.), The measurement of grasslandproductivity. Butterworths Scientific Publications, London, pp. 51-61.Needles tilted at32.5˚ from vertical• Needles are loweredthrough the plantcanopy and the speciesof each ‘hit’ isrecorded.• This design shows 10needles spaced at 10-cm intervals.• After lowering the 10needles, the frame ismoved10cmandtheneedles are againlowered. This isrepeated so that atotal of 100 needlesare lowered throughthe canopy within a 1m 2 area. The leaf areaof each species is thetotal number of its hitsdivided by 100.• The needles are tiltedat 32.5˚ as theopitmum angle forsampling botherectophillic andplanophillic leaves.
• Very rapid methodof obtaining fieldLAI.• Provides only totalLAI, and cannotdistinguishcomponents ofindividual species norof woody vs. foliarfraction.• Not useful for verylow growingvegetation (moss andlichen mats) becausethe height of thesensor is above mostmoss and lichens(about 2.5 cm).LAI-2000 Plant Canopy Analyzer
LAI-2000 optical sensor
• Reference reading istaken above theplant canopy.• Below the canopymeasurement is thentaken and theinstrument recordsthe difference in thetwo readings of lightas the LAI.
Correlation between actual leaf area and LAI-2000
Remote-sensing different wavelengths of energyFrom Lillisand and Kiefer 1987
Satellites measure reflectance in discreet bands or channelsChannels for the major Landsat satellites:• Instead of measuring the entire spectrum, most satellites average the reflectanceacross regions (bands or channels) of the spectrum.• The Landsat satellites were designed to monitor the earth s surface, particularlythe vegetation component. So two of the four bands are in regions of thespectrum that are sensitive to differences in the amount of chlorophyll, the red andnear infrared regions.
• The Multispectralscanner detects thespectral reflectance of thesurface in severaldiscreet bands of thespectrum.• This is done forindividual pictureelements (pixels),whereby the reflectancein each band is recordedfor an square area (in thiscase a 79 m x 79 m area).• The scanner has mirrorthat rapidly moves backand forth along scanninglines consisting of manypixels. In this case eachscanning line consists of3240 pixels and there are2340 scan lines perLandsat image.Landsat Multi-spectral sensor(MSS)From Lillisand and Kiefer 1987
1. Water is a very good absorber innearly all portions of thespectrum, and very little energyis reflected from water surfaces.Reflectance spectra for typicalcomponents of the Earth s surface2. Soil has a reflectance spectrumthat is nearly linear through theUV, visible, and near infraredportions of the spectrum.3. Vegetation however, absorbsstrongly in the red portion of thespectrum, which is the principlelight region that plants use forphotosynthesis. Vegetationreflects in the green portion andmost strongly in the near infraredportion of the spectrum, a portionthat is invisible to the human eye,but which can be detected withsensors that sense the NIRportion of the spectrum.2 31From Lillisand and Kiefer 1987
Different vegetation types have different reflectance spectraThe greater thedifferencebetween thereflectance in theR and NIRportions of thespectrum themore chlorophyllis in thevegetationcanopy.
Thematic Mapper (TM) Sensor bands on Landsat 4 and 5 satellites• Thematic Mappersatellites havemore channels inthe infraredregion,corresponding towater absorptionbands.• Useful formonitoringvegetation and soilmoisture statusand for separatingclouds from snowand ice on images.
Vegetation indices• Vegetation indices are based on the principle that red, R, wavelengths(near 0.6μm) are absorbed by chloroplasts and mesophyll, while nearinfrared, NIR, wavelengths (0.7-0.9μm) are reflected.• If the NIR reflectance is much larger than the red reflectance, thenpresumably there is a considerable amount of green vegetation present.• Satellites measure spectral reflectance in discrete bands for each pictureelement (pixel) in the image. For satellites monitoring the visible and NIRportions of the spectrum. vegetation indices can be calculated for eachpixel.• In general, for many ecosystems, the vegetation indices are proportionalto IPAR (intercepted phytosynthetically active radiation) and to LAI andbiomass.
Normalized Difference Vegetation Index: an index ofgreennessNDVI = (NIR-R)/(NIR+R)NIR = spectral reflectance in the near-infrared band (0.725 - 1.1μm),where light scattering from the canopy dominates,R = reflectance in the red, chlorophyll-absorbing portion of thespectrum (0.58 to 0.68μm).
• There are severalbrands of hand-heldradiometers thatmimic the sensors insatellites.• Many have foursensors that can beset to sense the sameband widths ascommon satellitesensors.Hand-held radiometer for ground-levelmeasurement of spectral reflectance
Application to northern<strong>Alaska</strong>:Biomass and LAI vs.total summer warmthindex12001000800600Biomassy = 85.625e 0.0703xR 2 = 0.9131OumalikIvotukMATMNT400200BarrowAtqasukOumalikIvotuk00 10 20 30 40Total Summer Warmth( o C )Leaf Area Index vs. Total Summer WarmthLeaf Area Index (LAI)32.52y = 0.4763e 0.0463xR 2 = 0.933IvotukMATMNT1.5OumalikTotal summer warmth = sum ofmonthly mean temperatures > 0 ˚C10.50BarrowAtqasukIvotukOumalik0 10 20 30 40Total Summer Warmth( o C )
NDVI vs. total aboveground biomass0.60.550.5y = 0.0005x + 0.1471R 2 = 0.98<strong>27</strong>OumalikIvotuk0.450.4Barrow0.35Atqasuk0.3200 300 400 500 600 700 800TotalBiomass (g/m 2 )
Extrapolation of NDVI to the full range of zonalphytomass in the Arctic2500Phytomass vs. MaxNDVI• Exponential response ofphytomass to NDVIPhytomass (g m- 2)200015001000y = 24.907e 7.1665xR 2 = 0.8941• Due to saturation ofsensors at high NDVI• Curve was used toestimate phytomass forthe circumpolar Arctic.500Data from this studyData from other sources00 0.1 0.2 0.3 0.4 0.5 0.6 0.7MaxNDVI (AVHRR)
Advanced Very High Resolution Radiometer(AVHRR) false-CIR mosaic• This cloud-free andsnow free image wasmade from biweeklycomposites of AVHRRimages in 1993 and1995, two relativelywarm years in theArctic when snow coverwas at a minimum. Foreach pixel the spectralinformation from thedate with the highestNDVI value is displayed.• The image is clipped attree line.
MaxNDVI map of the circumpolar ArcticMaxNDVI0.62• The strong gradient inbiomass across the ArcticSlope of <strong>Alaska</strong> thatcorresponds with the patternsobserved on the Landsatderivedland-cover map. Thisarea and the Taimyr Peninsulaare perhaps the best places inthe Low Arctic to study suchtransitions.• In Canada NDVI values areassociated with summertemperatures, and substrate(areas of glaciation andlimestone bedrock.• The important role ofprecipitation can be seen bycontrasting the situation eastand west of the Polar Urals inEuropean Russia. The areawest of the Polar Uralsreceives abundant moisturefrom the Barents Sea and hassome of the best-developedshrub tundras in the Arctic.East of the Urals on the YamalPeninsula, conditions arerelatively dry, and shrubtundra is replaced by lichenandgraminoid-dominatedtundras.
PhytomassDensity in theArctic derived fromNDVI/biomasscorrelation
Biomass map of the Toolik Lake region derivedfrom SPOT NDVI values (Shippert 1995)• If the relationshipbetween NDVI andbiomass is strong, it ispossible to developbiomass maps basedon satellite images.• It is also possible todevelop maps thatportray otherbiophysical propertiesof ecosystems (e.g.PAR, LAI, CO 2 flux,NH 4 flux).
Summary• Basic definitions (phytomass, primary production, GPP, NPP)• Response of NPP to environmental factors (temperature,precipitation, ET, soil nutrients)– Transient maxima hypothesis (Seastedt and Knapp 1993)• Successional patterns of production in forests: declining with ageand factors contributing to this pattern (lower photosyntheticefficiency, wood production, limitations imposed by canopy form,binding of nutrients in wood)• Global productivity patterns (Lashof 1989)• Recent and long-term changes in atmospheric CO 2concentrations• Global productivity models predict an increase in NPP with doubleCO 2and warmer climate– Terrestrial Ecosystem Model (TEM, Mellilo et al. 1993)• Methods of measuring aboveground biomass (clip harvest,dimension analysis for forests) and belowground biomass (soilcores, in situ washing, root ingrowth bags, mini-rhizotrons)• Leaf area index (LAI) (point frame, LAI-2000)• Vegetation indices (NDVI from satellite and hand-held sensors)– <strong>Production</strong> of biomass maps from NDVI (Shippert et al. 1995)
Literature citedNUTRIENT CYCLING:Chapin, F. S., III. 1991. Effects of multiple environmental stresses on nutrientavailability and use. Response of plants to multiple stresses. H. A. Mooney,W. E. Winner and E. J. Pell. San Diego, Academic Press: 67-88.Chapin, F. S., III, N. Fetcher, et al. 1988. Productivity and nutrient cycling of<strong>Alaska</strong>n tundra: enhancement by flowing soil water. Ecology 69: 693-702.Chapin, F. S., III, P. M. Vitousek, et al. 1986. “The nature of nutrient limitation inplant communities.” The American Naturalist 1<strong>27</strong>: 48-58.Likens, G.E., F.H. Bormann, N.M. Johnson, W.D. fisher, and R.S. Pierce. 1970.Effects of forest cutting and herbicide treatment on nutrient budgets in theHubbard-Brook watershed-ecosystem. Ecological Monograph, 40: 23-47.McGuire, A.D., J.M. Melillo, and L.A. Joyce. 1995. The role of nitrogen in theresponse of forest net primary production to elevated atmospheric carbondioxide. Annual Review of Ecology and Systematics, 26: 437-503.Seastedt, T.R. 1988. Mass, nitrogen, and phosphorus dynamics in foliage androot detritus of tallgrass prairie. Ecology, 69: 59-65.PRODUCTIVITY:Melillo, J.M., A.D. McGuire, D.W. Kicklighter, B. Moore III, C.J. Vorosmarty, andA.L.Schloss. 1993. Global climate change and terrestrial net primaryproduction. Nature 363: 234-240.Seastedt, T.R. and A.K. Knapp. 1993. Consequences of nonequilibriumresource availability across multiple time scale: the transient maximahypothesis. The American Naturalist, 141: 621-633.Shippert, M.M., D.A. Walker, N.A. Auerbach, and B.E. Lewis. 1995. Biomassand leaf area index maps derived from SPOT images for the Toolik Lake andImnavait Creek Area, <strong>Alaska</strong>. Polar Record, 31:147.