Lesson 32 Mineral Cycling - Alaska Geobotany Center
Lesson 32 Mineral Cycling - Alaska Geobotany Center
Lesson 32 Mineral Cycling - Alaska Geobotany Center

Create successful ePaper yourself
Turn your PDF publications into a flip-book with our unique Google optimized e-Paper software.
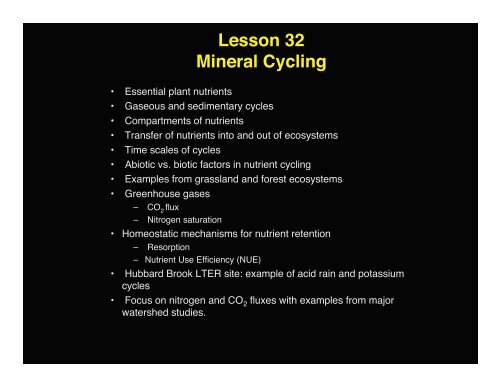
<strong>Lesson</strong> <strong>32</strong><br />
<strong>Mineral</strong> <strong>Cycling</strong><br />
• Essential plant nutrients<br />
• Gaseous and sedimentary cycles<br />
• Compartments of nutrients<br />
• Transfer of nutrients into and out of ecosystems<br />
• Time scales of cycles<br />
• Abiotic vs. biotic factors in nutrient cycling<br />
• Examples from grassland and forest ecosystems<br />
• Greenhouse gases<br />
– CO 2<br />
flux<br />
– Nitrogen saturation<br />
• Homeostatic mechanisms for nutrient retention<br />
– Resorption<br />
– Nutrient Use Efficiency (NUE)<br />
• Hubbard Brook LTER site: example of acid rain and potassium<br />
cycles<br />
• Focus on nitrogen and CO 2 fluxes with examples from major<br />
watershed studies.
Essential plant nutrients<br />
• Nutrients can be<br />
deficient,<br />
adequate, or<br />
toxic.<br />
Micronutrients
Micronutrients
Biogeochemistry<br />
• Refers to the transfer or flux of materials back and forth between living<br />
and nonliving components of the biosphere.<br />
• Nutrient <strong>Cycling</strong> is the movement of the materials that are essential<br />
to organisms.<br />
• <strong>Cycling</strong> within the system is often an order of magnitude faster than<br />
movement into or out of the system.<br />
• Others (P, K, Ca, Mg, Fe, micronutrients) move in sedimentary<br />
cycles.<br />
• Gaseous materials (N, O, C, H) are involved in gaseous cycles.<br />
Some, such as S, have both sedimentary and gaseous cycles.<br />
• Much of the current focus in plant ecology is on the nitrogen cycle<br />
and flux of greenhouse gases to the atmosphere.
A sedimentary cycle: the phosphorus cycle<br />
• Marine sediments and<br />
volcanic apatite are the<br />
source of P in phosphate<br />
rocks and soils.<br />
• P is taken up by plants as<br />
H 2 PO - 4 or HPO -2 4 , where it<br />
becomes a component of<br />
energy-carrying phosphate<br />
compounds (ATP and ADP),<br />
nucleic acids, several<br />
essential coenzymes, and<br />
phospholipids.<br />
http://arnica.csustan.edu/carosella<br />
/Biol4050W03/figures/phosphoru<br />
s_cycle.htm<br />
• Chemical erosion has<br />
reduced P 2 O 5 content of<br />
midwest soils by 36% in the<br />
last 50 y.<br />
Odum and Odum 1959
Ecosystem pools and fluxes of potassium at<br />
Hubbard Brook<br />
• In the 1960s and 1970s Bormann and<br />
Likens worked out the biogeochemistry<br />
of potassium, a very easily leached<br />
element in forests at Hubbard Brook.<br />
• K is the most abundant cation in<br />
throughfall at HBEF, representing 33%<br />
of the total during the growing season.<br />
• K is added to the system through wet<br />
and dry deposition, where it enters the<br />
available pool directly or is washed into<br />
the soils through the forest canopy.<br />
Weathering is another important input.<br />
• K is moved within the system<br />
(intrasystem cycling) by throughfall,<br />
stemflow, nutrient uptake, plant<br />
assimilariotn and use, resorption and<br />
biological decomposition.<br />
• K departs the system through the<br />
dissolved fraction and particulate<br />
fraction in streams.<br />
• The ecosystem is thus connected to<br />
the larger biogeochemical cycles by<br />
meteorologic, geologic, and biologic<br />
vectors that move nutrients across<br />
ecosystem boundaries.<br />
Modified from Likens et al. 1977. Biogeochemistry of a Forested Ecosystem.
Hubbard Brook LTER site: whole<br />
watershed manipulations<br />
Watershed 2 (lower photo, foreground) was clear<br />
felled (no vegetation was removed) and treated<br />
with herbicide. This first watershed manipulation<br />
at Hubbard Brook was undertaken to evaluate<br />
the role of forest vegetation in regulating the<br />
hydrologic and element output of a northern<br />
hardwood forest.<br />
Watershed 4 (lower photo, background) was<br />
harvested in three successive 25m strips from<br />
1970 to 1974 to assess the effects of strip<br />
cutting on water yield and nutrient input-output<br />
budgets.<br />
Watershed 5 (right photo) was whole-tree clear-cut<br />
during the autumn of 1983 through the spring of<br />
1984. This watershed manipulation was<br />
designed to assess the effects of a commercial<br />
whole-tree harvest on nutrient cycles.<br />
Courtesy of LTER web site: http://lternet-183.lternet.edu/
Monitoring stream flow at Hubbard Brook<br />
Stream discharge is monitored at nine<br />
watersheds throughout the the Hubbard<br />
Brook Valley. At the bottom of each<br />
watershed, the stream flows into a<br />
concrete stilling basin and over a V-notch<br />
weir, where the stage height is measured<br />
continuously. This is the weir at<br />
Watershed 1.
Atmospheric inputs of nutrients and<br />
pollutants<br />
Rain gauge and dry and wet deposition collectors<br />
at Hubbard Brook LTER site.<br />
Courtesy of Hubbard Brook web site: www.hubbardbrook.org/yale/,<br />
• Cloud chemistry of various sites.<br />
• Sites in the East show elevated<br />
concentrations of hydrogen ion,<br />
nitrate, sulfate.<br />
From Gilliam, F.S. 1989. Enviornment in Appalachia<br />
Proceedings, 4th Annual Conference on Appalachia
Acid rain at<br />
Hubbard Brook<br />
• Precipitation chemistry has been monitored<br />
since the late 1960s, when scientists noticed the<br />
unusually low pH, between 4.0 and 4.2 (5.6 is<br />
normal for rain).<br />
• Since 1965 rain water has been collected in<br />
containers which are located throughout the<br />
watersheds. The samples are collected weekly<br />
and brought back to the lab where pH values<br />
are measured and then entered into the longterm<br />
database.<br />
• Although pH has been rising steadily since the<br />
Clean Air Act was passed in 1970, the<br />
precipitation is still quite acid, and has effects on<br />
other components of the ecosystem, such as<br />
calcium levels.<br />
Courtesy of Hubbard Brook web page: www.hubbardbrook.org/education/SubjectPages/AcidRainPage.htm
Calcium addition experiment<br />
at Hubbard Brook<br />
• In October 1999, calcium silicate - in a<br />
mineral form known as "wollastonite" was<br />
applied to all of Watershed 1 in an<br />
experiment designed to replace the<br />
calcium that has been washed out of the<br />
soil by acid rain.<br />
• A helicopter was used to apply forty-five<br />
tons of wollastonite to the watershed,<br />
increasing the levels of soil calcium to<br />
those believed to exist before acid<br />
precipitation began falling on the forest.<br />
• Over the next 50 years (this is a VERY<br />
long experiment!) scientists will<br />
investigate the response of major<br />
ecosystem processes, including stream,<br />
soil, and soil water chemistry; forest floor<br />
mass and chemistry; composition and<br />
structure of the forest, aquatic ecology;<br />
leaf chemistry; soil microorganism activity,<br />
and ultimately tree growth<br />
Courtesy of Hubbard Brook web page: www.hubbardbrook.org/education/SubjectPages/AcidRainPage.htm
Adding ground<br />
glacial rocks to<br />
remineralize soils<br />
• John Hamaker, a farmer in Michigan,<br />
started a movement to remineralize<br />
the Earth by spreading glacial dust<br />
over declining forests and croplands.<br />
What started as a “fringe”<br />
movement has gained scientific<br />
support through large programs in<br />
Europe to spray ground rock over<br />
forests declining from acid rain.<br />
http://www.remineralize.org/about/context.html
Soil lysimeter to collect water for chemical<br />
analysis<br />
• Open pit containing partially installed<br />
zero-tension lysimeters.<br />
• Researchers dig a large whole in the<br />
ground and install lysimeter cups into the<br />
uphill side of the pit, as shown here.<br />
Eventually, all the tubing is connected<br />
and the pit is filled back in.<br />
• When it rains, water filters through the<br />
soil (uphill of the pit), enters the cup, and<br />
travels through a tube (dotted line) to a<br />
buried (barely visible) "reservoir," which<br />
collects the sample.<br />
• Approximately once a month technicians<br />
visit these sites and, using a hand pump,<br />
empty the reservoirs using the "sampling<br />
tube." The end of the sampling tube is<br />
the only part of the lysimeter that is<br />
above ground.<br />
Courtesy of Hubbard Brook web page: www.hubbardbrook.org/education/SubjectPages/AcidRainPage.htm
Trends in aboveground nutrient pools and biomass following<br />
disturbance at HBEF<br />
Watershed 2*<br />
recovery following<br />
treatment<br />
* clearcut and herbicide treatment<br />
** control 55-yr old<br />
W.A. Reiners. 1992. Ecol. Monogr. 62: 503-523<br />
Percent compared to<br />
Watershed 6**<br />
• Once suppression of vegetation with<br />
herbicideds ceased, W2 displayed<br />
vigorous recovery.<br />
• Ca, N, S, K, Mg, and P all increased<br />
along with biomass.<br />
• Ca increased linearly, and had the<br />
greatest absolute increase in any element.<br />
This reflects the structural nature of Ca in<br />
plants.<br />
• Rates of N and K increase declined over<br />
time.<br />
• S, P, Mg showed slow asymptotic growth.<br />
• Comparison with Watershed 6 (control),<br />
shows that K, P, and Mg have much<br />
higher relative rates of accumulation,<br />
probably because they are needed first in<br />
regenerating canopies, while S, Ca, and<br />
N are more important for the woody<br />
trunks and branches and will likely play a<br />
larger role later in the succession.
Essential plant nutrients<br />
• Nutrients can be<br />
deficient,<br />
adequate, or<br />
toxic.<br />
Micronutrients
Trends in potassium storage in plants and<br />
resorption of K over time at Hubbard Brook<br />
Rate of storage of K in living and dead biomass<br />
(mol ha -1 yr -1 ) and net soil release of K in<br />
Watershed 6 (control watershed at HBEF)<br />
Estimate of resorption of K in Watershed 6.<br />
• Potassium is a very mobile ion that is<br />
lost from the system through leaching<br />
if it is not captured by biomass.<br />
• Net soil release of K and storage of K<br />
in biomass declined markedly over 27<br />
years in Watershed 6 (control). In<br />
1987-1992 biomass assimilation of K<br />
was less than 17% of that in 1965-<br />
1977.<br />
• Concomitant with decline in rates of<br />
biomass assimilation, K in throughfall<br />
and biomass storage of K declined.<br />
• More of the available K was resorbed<br />
from leaves before they senesced and<br />
leaching of K declined.<br />
Likens, et al. 1994. Biogeochemisty 25: 61-125. Kluwer Academic Publishers
Nutrient supply in a coastal dune community<br />
Bulk deposition and rainfall<br />
• Primary nutrient source is from salt spray (8 times the<br />
mineral ions of rain water.) Note the differences in the<br />
salt-spray input of the fore dunes vs. lee side (e.g., for Ca,<br />
80 vs 19 kg ha -1 yr -1 ).<br />
• Calcium input is 35 kg ha -1 yr -1 , compared to 10.5 kg ha -1<br />
yr -1 for an inland forested site.<br />
• Much more Ca is retained in the more dense vegetation<br />
on the lee side of the dune.<br />
• In the sandy soils of the dunes, much of the calcium is<br />
quickly leached away. (Note: more calcium is leached out<br />
than arrived in the salt spray, indicating that CaCO 3<br />
is<br />
leaching from the sea-shell fragments in the dune.<br />
• Turnover times are very short, 11-37 days for K, Na, and<br />
Mg, and <strong>32</strong>-206 days for Ca, reflecting the input from the<br />
dissolved shells.<br />
• There is no storage of nutrients in the sandy soils of the<br />
dunes.
The carbon cycle: example of a gaseous cycle<br />
Drawing by Terry Chapin<br />
• 100% of carbon comes<br />
from the atmosphere.<br />
• Enters the system<br />
through carbon fixation<br />
in autotrophs (plants,<br />
algae, cyanobacteria,<br />
green and purple<br />
photosynthetic bacteria).<br />
• Portion of Gross Primary<br />
Production (GPP) is<br />
converted back to the<br />
atmosphere through<br />
respiration leaving Net<br />
Primary Production<br />
(NPP).<br />
• Part of organic carbon<br />
that is not respired is<br />
available to heterotrophic<br />
consumers.<br />
• Part becomes<br />
incorporated in the soil.
Soil respiration for mixed hardwood forest at<br />
Harvard Forest, MA<br />
Soil carbon flux rate, g m -2 yr -1 (%)<br />
• Soil respiration<br />
accounts for most<br />
of the CO 2<br />
released to the<br />
atmosphere.<br />
• Respiration is<br />
from living roots,<br />
and<br />
decomposition of<br />
aboveground and<br />
belowground litter.<br />
• The total<br />
respiration for the<br />
forest is 371 gm -2<br />
yr -1 . Nearly two<br />
thirds of this is<br />
from root activity<br />
(belowground<br />
litter and root<br />
respiration).<br />
From Bowden et al. (1993)
Recalcitrant organic substances: Two-phase<br />
decomposition model of John Aber et al.<br />
(1990)<br />
Mass<br />
N-concentration<br />
• Decomposition of organic material involves easily decomposed nitrogen-rich<br />
materials (Phase 1) and recalcitrant lignin-rich material (Phase 2). Phase 1<br />
includes about 80% of the total mass.<br />
• Data above are from a paper birch foliage decomposing in a hardwood forest at the<br />
Harvard forest LTER site.<br />
J. Aber, 1990.
Decomposition of litter material by soil invertebrates and<br />
evolution of forest mull soils<br />
Brauns 1968. Cited in Walter, H. and Breckle, S.W. 1986. Ecological Systems of the Geobiosphere. Springer-Verlag.
Reasons for focus on greenhouse gases<br />
Courtesy EPA website<br />
• CO 2 ,CH 4 ,andN 2 O are all greenhouse<br />
gases that trap long-wave radiation (heat)<br />
emitted from the surface of the Earth. This<br />
energy would otherwise be radiated to<br />
space. The added heat affects the global<br />
energy budget, and global climate.<br />
• Anthropogenic influence has increased<br />
both N and C to the level of atmospheric<br />
pollutants.<br />
• Nitrogen is the primary growth limiting<br />
nutrient in many if not most plant<br />
communities. It also limits recovery<br />
following disturbance. It is, therefore,<br />
important to study N in conjunction with C<br />
(see slide of Terrestrial Ecosytem Model).<br />
• Nitrogen-saturated ecosystems can<br />
become sources (not sinks) of nitrogen,<br />
causing:<br />
– Nitrous oxide (a greenhouse gas) flux to<br />
the atmosphere and<br />
– Nitrate eutrophication of streams.
Greenhouse Gases<br />
Total Greenhouse Gas<br />
Emissions (ppm) in 1995<br />
Courtesy EPA website<br />
• CO 2 in the atmosphere is increasing at<br />
rate of 1.78 ppm per year. Preindustrial<br />
CO 2 concentrations were 276 ppm and<br />
are now 360 ppm.<br />
• Methane (CH 4 ) is increasing at an<br />
annual rate of 0.9%, and has nearly<br />
doubled in the past century from 0.9 to<br />
1.72 ppm. CH 4 traps 21 times more<br />
heat per molecule than CO 2 .<br />
• Nitrous oxide (N 2 O) also participates in<br />
the destruction of stratospheric ozone,<br />
which is affecting the increase in UV<br />
radiation. NO 2 is increasing at the rate<br />
of 2.5% per year. NO 2 traps 270 times<br />
more heat per molecule than CO 2 .<br />
• Potential benefits of rising CO 2<br />
concentrations include stimulation of<br />
photosynthesis, crop growth and water<br />
use efficiency.<br />
• Improved biomass production may not<br />
be experienced by all natural<br />
ecosystems. Limitations of soil nitrogen<br />
and increases in soil respiration may<br />
offset or restrict biomass gains<br />
stimulated by additional carbon dioxide<br />
(see earlier slide).
Estimated current and future carbon fluxes<br />
in the terrestrial biosphere<br />
Sampson et al. (1993)<br />
• Tundra and boreal forests appear to be a<br />
net sink of carbon to the atmosphere<br />
(absorbing carbon in biomass and peat<br />
formation).<br />
• Tropical forests are strong source<br />
(releasing C in respiration and forest<br />
burning).<br />
• Currently, it is unclear whether the<br />
terrestrial biosphere is a net sink or<br />
source of carbon to the atmosphere.<br />
• Doubling of CO 2 will most likely result in<br />
the biosphere being a larger net source.<br />
• The Kyoto accord and other international<br />
efforts are aiming at reducing the flux of<br />
carbon to the atmosphere, partly through<br />
vegetation management or vegetation and<br />
energy management (Columns C and D).
Monitoring Greenhouse Gas Fluxes: First ISLSCP (International Satellite Land<br />
Surface Climatology Project) Field Experiment (FIFE): Konza Prairie LTER site<br />
The Konza tall-grass prairie site near Manhatten, Kansas.<br />
• The FIFE project was a large-scale climatology project conducted<br />
from 1987 through 1989 at the Konza Prairie LTER site to<br />
understand the biophysical processes controlling the fluxes of<br />
radiation, moisture, and carbon dioxide between the land surface<br />
and the atmosphere and to develop remote-sensing<br />
methodologies for observing these processes.<br />
• The remote-sensing data were used to determine surface energy<br />
budgets, soil moisture and vegetation parameters, surfaceatmosphere<br />
fluxes, and atmosphere properties. Surfaceatmosphere<br />
exchanges and atmospheric boundary layer models<br />
were used to more completely understand the dynamics<br />
measured in the FIFE study.<br />
• Numerous flux experiments have followed FIFE including several<br />
in <strong>Alaska</strong> (e.g., FLUX and ATLAS in the Arctic)<br />
• The scaling up of measurement involves measuring fluxes with<br />
small chambers, eddy correlation flux towers, and aircraft.<br />
Measurements of the spectral properties of the earth surface are<br />
made with hand-held, aircraft-mounted, and satellite-mounted<br />
spectrometers.
• Carbon balance models, despite<br />
their flaws, provide us with the<br />
capacity to interpolate and<br />
extrapolate measurements in time<br />
and space. Hence, they are and<br />
will be a key tool for making<br />
regional and global assessments of<br />
the carbon balance.<br />
• Most data for testing ecosystem,<br />
regional and global carbon models<br />
stems from long term monitoring of<br />
carbon dioxide concentrations and<br />
biomass .<br />
• The Ameriflux network was<br />
established in 1996 to provide<br />
continuous observations of<br />
ecosystem level exchanges of CO 2 ,<br />
water, and energy, spanning diurnal,<br />
synopitc seasonal and intrannual<br />
time scales.Continuous monitoring<br />
of large areas with towers is the<br />
primary method. Chambers are<br />
used for detailed studies of small<br />
patches.<br />
• At present, 40 to 60% of the<br />
anthropogenically-released CO 2<br />
remains in the atmosphere. We do<br />
not know, with confidence, whether<br />
the missing half of emitted CO 2 is<br />
being sequestered in the deep<br />
oceans, in soils or in plant biomass.
AmeriFlux Objectives<br />
Generally:<br />
• Establish an infrastructure for guiding, collecting,<br />
synthesizing, and disseminating long-term<br />
measurements of CO 2 , water, and energy exchange<br />
from a variety of ecosystems.<br />
• Collect critical new information to help define the<br />
current global CO 2 budget<br />
• Enable improved predictions of future<br />
concentrations of atmospheric CO 2<br />
• Enhance understanding of carbon fluxes, Net<br />
Ecosystem Production (NEP), and carbon<br />
sequestration in the terrestrial biosphere.<br />
Specifically:<br />
• Share data and the science plan.<br />
• Quantify magnitude of net annual CO 2 exchange in<br />
major ecosystem/biome types (natural and<br />
managed)<br />
• Determine response of CO 2 fluxes to changes in<br />
environmental factors and climate changes<br />
• Provide information on processes controlling CO 2<br />
flux and net ecosystem productivity<br />
• Provide site-specific calibration and verification data<br />
for process-based CO 2 flux models.<br />
• Address scaling issues (spatial and temporal).<br />
• Quality control and quality assure data collection.
Flux towers used by Walt Oechel at Barrow<br />
and La Paz<br />
Photos courtesy of Walt Oechel
FLUXNET: Integrating worldwide<br />
CO 2 measurements<br />
FLUXNET builds on regional networks of<br />
tower sites:<br />
• South and North America (AmeriFlux);<br />
• Europe (CarboEurope);<br />
• Asia (AsiaFlux);<br />
• Australia and New Zealand (OzFlux);<br />
• Korea and Thailand (KoFLux);<br />
• Canada (Fluxnet-Canada);<br />
• Independent tower sites.
Another gaseous cycle: the nitrogen cycle<br />
5<br />
N 2<br />
1<br />
4<br />
7<br />
6<br />
Nitrogen<br />
fixation<br />
3<br />
2<br />
1. Nitrogen is taken up from the soil by plants in<br />
theformofNH 4 + or NO 3 - , where it is used to<br />
form organic compounds (amino acids,<br />
proteins, nucleic acids).<br />
2. It returns to the soil via litter, which is<br />
decomposed to form ammonia. This process<br />
of decomposition is also called nitrogen<br />
mineralization.<br />
3,4. The ammonia is oxidized in a two step<br />
nitrification process to form nitrates<br />
(NO 3 - ),which are an available form of N for<br />
plant uptake.<br />
5. NO 3 - -N can also be converted back to the<br />
gaseous NO, N 2 O, and N 2 , through the<br />
process of denitrification. The atmospheric<br />
store of N is about 1 million times larger than<br />
the total N in living organisms.<br />
6. Nitrogen-fixation transforms atmospheric<br />
N 2 into ammonia (NH 3 ) , which is also an<br />
available form of N for plant uptake.<br />
7. NO 3 - is also easily leached from the soil.<br />
Courtesy of Michael Pidwirny and Jim Deacon web sites<br />
http://helios.bto.ed.ac.uk/bto/microbes/nitrogen.htm<br />
http://www.physicalgeography.net/fundamentals/9s.html
Carbon and nitrogen cycling in terrestrial ecosystems are<br />
tightly linked: Terrestrial Ecosystem Model<br />
From McGuire, Melilllo, and Joyce 1995<br />
Carbon<br />
• C enters the vegetation pool (C v ). as<br />
gross primary production (GPP).<br />
• Transfers either to the atmosphere as<br />
autotrophic plant respiration (R A )orto<br />
the soil pool ( C S ) as litter (L C ).<br />
• Leaves the soil pool as soil<br />
heterotrophic respiration (R H ).<br />
Nitrogen<br />
• N enters the vegetation pool (N V )from<br />
the inorganic N pool of the soil (N AV )as<br />
NUPTAKE.<br />
• Transfers from the vegetation to the<br />
organic soil pool (N S ) in litter production<br />
as the flux (L N ).<br />
• Net nitrogen mineralization (NETNMIN)<br />
accounts for nitrogen exchanged<br />
between the organic and inorganic<br />
nitrogen pool of the soil through<br />
decomposition.<br />
• NINPUT and NLOST are the inputs<br />
and outputs of N to and from the<br />
system.<br />
Other nutrients are linked to this cycle as<br />
they become needed for<br />
photosynthesis, metabolism, or<br />
structural plant tissues.
Relationship between production and N<br />
uptake in temperate and boreal forests<br />
• Strong linear relationship<br />
between N-uptake and total<br />
production.<br />
From Cole and Rapp (1981)
Litter bags and dowels for measuring decomposition rates<br />
Litter bag data containing Andropogon gerardii from Konza Prairie, (Seastedt 1988).<br />
Litter bags as part of the LIDET experiment.<br />
• Litter bags are mesh bags that allow entry of decomposers. The bags contain a known weight<br />
of a plant.<br />
• The LIDET (Long-term Intersite Decomposition Experiment Team) is examining long-term<br />
Carbon and Nitrogen, and Phosphorus Dynamics of Leaf and Fine Root Litter in North<br />
American ecosystems.<br />
• The experiment involves 28 sites, 10 types of standard litter (leaves, stems, roots), 10<br />
replicates each, and wide array of biomes, and will last 10 years.<br />
• Data above from Konza Prairie shows rapid loss of mass during first 203 days, leaving the<br />
more recalcitrant material. The apparent increase in N is due to microbial and fungal<br />
additions.<br />
Litterbags<br />
Wooden dowels placed as part of the LIDET<br />
experiment. Photos courtesy of<br />
http://www.fsl.orst.edu/lter/research/intersite/lidet/lidet_met<br />
h/lidet.htm<br />
Litter bags in High Arctic on Banks Island.<br />
Photo courtesy of G. Gonzalez
Global budget of N 2 O–N (Tg)<br />
• Estimated annual increase in<br />
nitrous oxide (N 2<br />
O) is about 3.5 x<br />
10 12 g (3.5 Tg).<br />
• Note the discrepancy between total<br />
sources and total sinks and<br />
accumulation, which is due mostly<br />
to the large uncertainty factors.<br />
• Major causes of increased N 2<br />
O are<br />
tropical forest clear-cutting.<br />
• Tropical forests circulate more<br />
nitrogen at higher concentrations<br />
than do most boreal or temperature<br />
forests and exhibit high N 2<br />
O fluxes.<br />
• Deforestation in the Amazon basin<br />
has cleared at least 230,000 km 2 of<br />
tropical forest by 1990.<br />
Matson and Vitousek 1990
Summary of effects of nitrogen saturation in<br />
forested ecosystems<br />
• Even though Clean Air Bill intended to<br />
improve air quality, total N deposited in NE<br />
US will remain high for many years,<br />
exceeding forest outputs, resulting in N<br />
saturation, i.e. a net export of N from the<br />
system into streams and the atmosphere.<br />
• Diagram is a summary of forest nitrogen<br />
biogeochemistry trends along a gradient of<br />
increasing N saturation.<br />
• Foliar N content increases across the full<br />
gradient.<br />
• N-mineralization and NPP increase and then<br />
decline.<br />
• Ca:Al and Mg:N ratios decline along the full<br />
gradient.<br />
Increasing N saturation<br />
HFHW: Harvard forest hardwood<br />
HFP: Harvard forest pine<br />
BBW: Bear Brook stand<br />
Ascutney: Mount Ascutney transect<br />
Transect: 161 spruce-fir stands across NE US.<br />
• Nitrification and N-leaching increase from 0<br />
to high values along the gradient.<br />
• Consequences include increased emission<br />
of N 2 O, stream eutrophication, declining tree<br />
vigor, and potential loss of frost hardiness in<br />
conifers.
Summary<br />
Aspects of nutrient cycling<br />
– Gaseous (e.g., Carbon and Nitrogen cycles) and sedimentary cycles (e.g., Potassium<br />
cycle).<br />
– Nutrients are compartmentalized into (a) rocks and soils, (b) soil solution, ( c) the<br />
atmosphere, and (d) biomass.<br />
– Transfer into or out of the system can be via meteorologic, geologic, or biologic<br />
events.<br />
– Time scales of cycles can require minutes, decades, or millennia to revolve. Biological<br />
cycling within systems is much more rapid than abiotic cycling.<br />
– Abiotic factors include fire, earth movement, and aspects of the hydrologic cycle<br />
(deposition, leaching, evapotranspiration, runoff, infiltration).<br />
– Biotic factors include litter production, organic matter accumulation, decomposition,<br />
ingestion and digestion, gas flux, root exudation, and retrieval of nutrients from deep<br />
soil layers through roots.<br />
– Stability of systems often depend on a variety of homeostatic mechanisms to retain<br />
nutrients in the sytem, including resorption (ability to withdraw nutrients from plant<br />
parts that senesce to avoid loss of nutrients in litterfall), high nutrient use efficiency<br />
(high rate of production per unit of nutrient), large storage pools within the system<br />
(such as large standing crop of trees), and immobilization of nutrients (e.g., in<br />
decomposer microorganisms, and plants to prevent leaching.<br />
– The carbon and nitrogen cycles are tightly linked because plant tissues have high<br />
demand for nitrogen. Production is often limited by the availability of nitrogen.<br />
– Acid rain affects mineral cycles through lower soil water pH, which leaches nutrients<br />
from the soil. Nitrogen saturation occurs from enhanced inputs of N in rain water and<br />
dry deposition and leads to stream eutrophication.<br />
– Increases in greenhouses gases including CO 2<br />
, NH 4<br />
,N 2<br />
O, and water vapor are of<br />
major concern because of possible effects on global climate.
Summary (cont )<br />
Measurement of nutrient pools and fluxes<br />
– Measurement of nutrient pools and fluxes requires a great variety of tools including<br />
wiers to measure quantity and chemistry of stream waters, dry and wet deposition<br />
collectors to measure atmospheric inputs, lysimeters to measure chemistry of soil<br />
water, litter collectors to measure quantity of litter, litter bags and buried wooden<br />
dowels to measure decomposition rates, and harvest and mineral analysis of<br />
biomass to determine the nutrients in the vegetation.<br />
– Measurement of CO 2<br />
, NH 4<br />
, and N 2<br />
O fluxes requires large coordinated efforts to<br />
simultaneously study climate, fluxes of trace gases at multiple scales, and monitor<br />
ground-surface changes through remote sensing studies.<br />
– The Hubbard Brook studies are an excellent example that has fully studied the biotic<br />
and abiotic aspects of nutrient cycling, focusing on potassium, calcium, and nitrogen<br />
cycles.<br />
– AmeriFlux and FIFE are examples of the large interdisciplinary efforts to study<br />
greenhouse gases.