Burt, Dave - The Roslin Institute - University of Edinburgh
Burt, Dave - The Roslin Institute - University of Edinburgh
Burt, Dave - The Roslin Institute - University of Edinburgh
- No tags were found...
You also want an ePaper? Increase the reach of your titles
YUMPU automatically turns print PDFs into web optimized ePapers that Google loves.
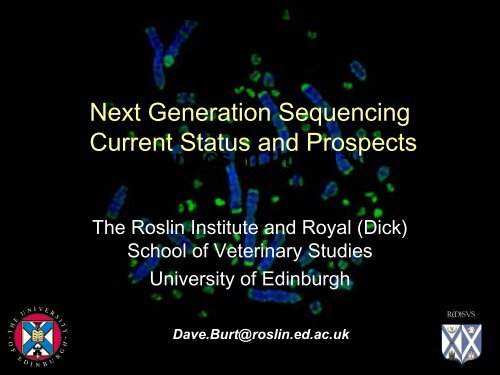
Next Generation SequencingCurrent Status and ProspectsAvian Genomics in the 21 st Century<strong>The</strong> <strong>Roslin</strong> <strong>Institute</strong> and Royal (Dick)School <strong>of</strong> Veterinary Studies<strong>University</strong> <strong>of</strong> <strong>Edinburgh</strong><strong>Dave</strong>.<strong>Burt</strong>@roslin.ed.ac.uk
Sequencing TechnologiesNGS technologySequencing principleRead length(bases)Raw readAccuracy (%)Readsper runGbases1st generationSanger Dideoxy sequencing ~1,000 ≥99.999 96 0.00032nd generationRoche/454 Pyrosequencing 350-450 ≥99 8.00E+05 0.4Illumina/Solexa Reversible terminator chemistry 36–100 ≥98–99 6.00E+09 600ABI/SOLiD Sequencing by ligation 35-60 ≥99.99 1.00E+08 50–1203rd generationPacBio Single-molecule sequencing 1000-4500 ≥80 4.80E+04 0.05Helicos Single-molecule sequencing 25–55 ≥97 6.00E+08 21–352
First Generation SequencingFrederick SangerIn 1958 awarded Nobel prize inchemistry "for his work on thestructure <strong>of</strong> proteins”. In 1980, Gilbertand Sanger shared the chemistryprize "for their contributionsconcerning the determination <strong>of</strong> basesequences in nucleic acids".3
First Generation Sequencing4
Genetic Maps• Genetic markers (e.g. Microsatellites)• Mapping populations (e.g. East Lansing)• Comparative maps (e.g. Chicken/Human)• Resource populations (e.g. B X L cross)• QTL mapping• Marker-Assisted-Selection5
QTL Mapping6
QTL Mapping• QTL not mapped precisely• Confidence intervals for QTL large• Markers account for limited geneticvariation (~4%)7
Genomic Tools• Expressed sequence tags (ESTs)• Chicken genome sequence• Gene expression chips– Affymetrix/Chicken Genome Consortium• 3M SNPs between RJF, Broiler,Layer and Silkie lines• 3, 20, 42, 60K SNP panels• ARK-Genomics facility• Genome Browsers– Ensembl and NCBI8
Genomic Tools• Expressed sequence tags (ESTs)• Chicken genome sequence• Gene expression chips– Affymetrix/Chicken Genome Consortium• 3M SNPs between RJF, Broiler,Layer and Silkie lines• 3, 20, 42, 60K SNP panels• ARK-Genomics facility• Genome Browsers– Ensembl and NCBI9
Genomic Tools• Expressed sequence tags (ESTs)• Chicken genome sequence• Gene expression chips– Affymetrix/Chicken Genome Consortium• 3M SNPs between RJF, Broiler,Layer and Silkie lines• 3, 20, 42, 60K SNP panels• ARK-Genomics facility• Genome Browsers– Ensembl and NCBI10
Genomic Tools• Expressed sequence tags (ESTs)• Chicken genome sequence• Gene expression chips– Affymetrix/Chicken Genome Consortium• 3M SNPs between RJF, Broiler,Layer and Silkie lines• 3, 20, 42, 60K SNP panels• ARK-Genomics facility• Genome Browsers– Ensembl and NCBIwww. ark-genomics.org11
Further BBSRC support 2011-2014 (Gallus 4, RNAseq, SNPs...)12
Sequencing TechnologiesNGS technologySequencing principleRead length(bases)Raw readAccuracy (%)Readsper runGbases1st generationSanger Dideoxy sequencing ~1,000 ≥99.999 96 0.00032nd generationRoche/454 Pyrosequencing 350-450 ≥99 8.00E+05 0.4Illumina/Solexa Reversible terminator chemistry 36–100 ≥98–99 6.00E+09 600ABI/SOLiD Sequencing by ligation 35-60 ≥99.99 1.00E+08 50–1203rd generationPacBio Single-molecule sequencing 1000-4500 ≥80 4.80E+04 0.05Helicos Single-molecule sequencing 25–55 ≥97 6.00E+08 21–3513
NGS: Illumina/Solexa14
Clonal Single Molecule ArraysAttach single molecules to surfaceAmplify to form clustersRandom array <strong>of</strong> clusters15
Sequencing By Synthesis3’ 5’Cycle 1: Add sequencing reagentsFirst base incorporatedRemove unincorporated basesATCAGTCTGCTACGADetect signalDeblock and defluorPPP Base FluorGTCAGTACCCGATCGACycle 2-n: Add sequencing reagents and repeat• All four labeled nucleotides in one reaction• High accuracy• Base-by-base sequencingT5’16
Base Calling from Raw DataT G C T A C G A T …1 2 3 7 8 94 5 6T T T T T T T G T …Identity <strong>of</strong> each base <strong>of</strong> a cluster is read <strong>of</strong>f from sequential images17
ApplicationsMinou N. 2010 Eukaryotic Cell 9:1300-131018
Applications19
Avian GenomesNing Li, Yao Feng Zhao, China Agricultural <strong>University</strong>, Beijing, ChinaWubin Qian, Ju Wang, Beijing Genome <strong>Institute</strong>, Shenzhen, ChinaDavid W <strong>Burt</strong>, Jacqueline Smith, Yinhua Huang, <strong>University</strong> <strong>of</strong> <strong>Edinburgh</strong>, UK20
Avian GenomesFlightSmall genomeUnique karyotypeImmune systemLearningMigrationLifespan …21
Phylogenomics• Clade and species-specific biology• Gene diversification– Gene innovation, duplication and expansion– Gene deletion, contraction and extinction– Selection constraints on protein codingsequences (negative, neutral, positive)22
Computational Pipeline forEnsembl/Compara ProcessWUBlastp + SmithWatermanhcluster_sg1multiple alignersconsensified by M-C<strong>of</strong>feeTreeBeSTJavier Herrero, Leo Gordon,Steve Searle, EuropeanBioinformatics <strong>Institute</strong>, UK23
Gene Family Expansion andContraction <strong>of</strong> Adaptive Significance?• CAFE “Computational Analysis <strong>of</strong> gene FamilyEvolution” (Hahn et al, 2007) was used to predict genefamily expansions and contractions <strong>of</strong> putative adaptivevalue• CAFE models gene expansion/contraction as a“birth/death” process with a specific probability• This value may be the same for all lineages or may varyin two or more lineages• <strong>The</strong> likelihood can be calculated and compare differentmodels24
Changes in gene family size along each branchAverage expansion = (total genes gained – total genes lost)/n-0.005+0.011+0.001-0.046+0.081+0.046+0.066-0.035-0.068+0.102+0.084+0.051-0.126-0.022+0.014-0.196-0.074-0.091-0.160-0.020-0.025-0.052+0.010-0.099-0.060+0.027MRCA-0.336-0.109+0.073-0.201+0.001+0.202Million year before present25
Accelerated Evolution <strong>of</strong> GenesSelection constraints on proteincoding sequences (negative,neutral, positive)ω= dN/dSHeebal Kim, Taehun Kim,Seoul National <strong>University</strong>.Korea and Rasmus Nielsen,<strong>University</strong> <strong>of</strong> California-Berkeley, USABirds vs. MammalsAdaptive evolution or relaxed selective constraint,during last ~100 million years?26
Compare Rates <strong>of</strong> EvolutionSelection constraints on proteincoding sequences (negative,neutral, positive)ω= dN/dSBirds vs. Mammals4,224 orthologs between eight species, 766 showedaccelerated evolution in birds and 762 in mammals27
Rates Birds > Mammalsproliferation <strong>of</strong> B cellsactivation and migration <strong>of</strong> leukocytesand T-cellscardiovascular system(metabolic demands <strong>of</strong> flight, running,swimming and diving)Beak shape and sizenervous system and behavior(birds have around three times thevisual acuity <strong>of</strong> humans)hepatic function (migratory birds)2828
Rates Mammals > Birdsmovement <strong>of</strong> B cellslymphoid tissue structure anddevelopment(no lymph nodes in birds)Reproductionendocrine systemdevelopmentembryonic developmentvisual system29
SpeciesLatin NamesSequenceDepthNumberGenesSpeciesLatin NamesSequenceDepthNumberGenesAdelie penguin Pygoscelis adeliae 60X 15,300 Hoatzin Ophisthocomus hoazin 100X 14,937American Crow Corvus brachyrhynchos 90X 16,742 Houbara Bustard Chlamydotis undulata 27X 14,090Angola turaco Tauraco erythrolophus 30X 14,667 Javan rhinoceros hornbill Buceros rhinoceros silvestris 35X 13,835Anna's hummingbird Calypte anna 110X 16,750 Kea Nestor notabilis 32X 14,736Barn owl Tyto alba 27X 14,048 Killdeer Charadrius vociferus 100X 16,146Bar-tailed trogon Apaloderma vittatum 28X 14,917 Little egret Egretta garzetta 74X 15,814Brown mesite Mesitornis unicolor 29X 15,275 Medium ground finch Geospiza fortis 115X 16,780Budgerigar Melopsittacus undulatus 30X 16,368 Nightjar Caprimugus Carolinensis 30X 14,502Caribbean flamingo Phoenicopterus ruber 33X 13,811 Northern Carmine bee-eater Merops nubicus 37X 14,019Chicken Gallus gallus 7x Sanger 16,516 Northern Fulmar Fulmarus glacialis 33X 14,186Chimney swift Chaetura pelagica 106X 15,608 Ostrich Struthio camelus 85X 15,417Common Cuckoo Cuculus canorus 100X 15,681 Peking duck Anas platyrhynchos domestica 50X 19,144Crested Ibis Nipponia nippon 105X 16,434 Peregrine falcon Falco peregrinus 105X 16,262Crowned crane Balearica regulorum gibbericeps 33X 14,821 Red throated loon Gavia stellata 33X 13,933Cuckoo roller Leptosomus discolor 32X 14,719 Red-legged seriema Cariama cristata 24X 15,329Dalmatian pelican Pelecanus crispus 34X 14,353 Rifleman Acanthisitta chloris 29X 16,034domestic pigeon Columba livia 64X 17,300 Speckled mousebird Colius striatus 27X 14,807Downy Woodpecker Picoides pubescens 105X 16,396 Sunbittern Eurypyga helias 33X 13,582Emperor penguin Aptenodytes forsteri 60X 16,470 Turkey Meleagris gallopavo 30C 14,108Golden-collared Manakin Manacus vitellinus 110X 16,103 Turkey vulture Cathartes aura 25X 13,600Great black cormorant Phalacrocorax carbo 24X 13,909 white-tail eagle Haliaeetus albicilla 26X 13,793Great tinamou Tinamus major 100X 15,504 White-tailed tropicbird Phaethon lepturus 39X 14,667Great-crested grebe Podiceps cristatus 30X 13,957 Yellow-thoated Sandgrouse Pterocles guturalis 25X 14,897Zebra finch Taeniopygia guttata 6X Sanger 17,471Avian Phylogenomics Group: BGI, Duke, Univ Copenhagen, Am Museum Nat His, Bowdoin, Cal AcademySci, Cardiff, CNPq Brazil, Copenhagen Zoo, Florida, Griffith, Harvard, Heidelberg <strong>Institute</strong> <strong>The</strong>oreticalPhysics, Mississippi Sate Univ, Montellier Univ, Murdoch Univ, New Mex State Univ, NIEHS, NIH, OHSU,San Diego Zoo, Smithsonian, U Texas Austin, UCSC, Univ DelawareUniv Maryland, Univ Minnesota, UnivSydney, Utah, Wash Univ,, <strong>Roslin</strong>/Univ <strong>Edinburgh</strong>30
Applications31
QTL Mapping• QTL not mapped precisely• Confidence intervals for QTL large• Markers account for limited geneticvariation (~4%)32
Genome Wide Selection• Genotype 1000’s <strong>of</strong> markers topredict breeding values• High density SNP panel forwhole genome (e.g. 600K)• QTL close to one or moremarkers• Allows SNP with smallereffects to be used effectively• GWS will account for all QTLand all genetic variation33
SNP Discovery for ArrayIllumina ultra highthroughputsequencingSequence alignment toreference genomeSNP detection: 78MSNPs (segregating inone or more lines)SNP selection(stage1): 24MSNP selection(stage2): 10MSNP selection(stage3): 2MSNP selection(stage4): 650K243 chickens from 24 lines, samplesin pools <strong>of</strong> 10-15 individuals;Av. coverage 7-17X per lineUsed new GGA genome assembly(still unpublished)Criteria: Samtools Phred score ≥ 20,MAF ≥ 5, coverage ≥ 5, variantpresent in at least 5% <strong>of</strong> the readsCriteria: Phred quality score ≥ 60Criteria: No other SNPs within 10bpat least on one side, uniformly pacedout according to genetic distanceCriteria: Predicted reproducibility inarray, 50:50 broiler and layer SNPsCriteria: True reproducibility,Mendelian inheritance, HWE, LD34
% <strong>of</strong> SNPsNumber <strong>of</strong> SNPs/cMNumber <strong>of</strong> SNP/KbDistribution <strong>of</strong> SNPs201510501 2 3 4 5 6 7 8 9 10 11 12 13 14 15 16 17 18 19 20 21 22 23 24 25 26 27 28 ZChromosome78M 24M 10M 2M2001501005001 2 3 4 5 6 7 8 9 10 11 12 13 14 15 16 17 18 19 20 21 22 23 24 25 26 27 28 ZChromosome78M 24M 10M 2M4000030000200001000001 2 3 4 5 6 7 8 9 10 11 12 13 14 15 17 18 19 20 21 22 23 24 25 26 27 28 ZChromosome78M 24M 10M 2M35
% <strong>of</strong> SNPsDistribution <strong>of</strong> Minor Allele Frequency504030201000-0.05 0.05-0.1 0.1-0.15 0.15-0.2 0.2-0.25 0.25-0.3 0.3-0.35 0.35-0.4 0.4-0.45 0.45-0.5 0.5-0.55MAF78M 24M 10M 2M36
Annotation <strong>of</strong> SNPs%50454035302520151050Synonymous48%Stop gain/loss1%Non-synonymous51%Intergenic Intronic Exonic Upstream Downstream37
SNP Genotyping Panels• 3K• 6K• 20K• 42K• 60K• 600K192 samples/run125 million genotypes/run38
Final Panel Selection• 600K panel to be selected based on– Call rate <strong>of</strong> markers– Mendelian inheritance (MI)– Minimum allele frequency (MAF)– Linkage disequilibrium (LD)– Prediction <strong>of</strong> SNP effects on coding sequence39
Criteria for Passing SNPs• Polymorphic, with atleast 3 examples <strong>of</strong>the minor allele• Robust assay:– Genotype call rate(≥98%)– Cluster separation– Reproducibility40
Applications <strong>of</strong> SNP Panel• Genomic selection: broilers and layers• Genome wide association studies• High resolution genetic mapping• Selection signature analysis• SNP annotations, phenotypic effects andfunctional studies41
Structural Variants42
AcknowledgementsFundingBBSRC/Defra LINK; Aviagen Ltd, Affymetrix Ltd;German Federal Ministry <strong>of</strong> Education and Research<strong>Roslin</strong> <strong>Institute</strong>David <strong>Burt</strong>John A. WoolliamsChris HaleyAlmas GheyasClarissa BoschieroAndy LawLe YuPeter KaiserPaul HockingAviagenKellie A. WatsonAndreas KranisHylineJanet E. FultonARK genomicsRichard TalbotFrances TurnerSarah SmithAlison DowningMark FellAffymerixFiona BrewLucy RaynoldAli PiraniSynbreedHenner SimianerRuedi FriesRudolf PreisingerSteffen WeigendKlaus MeyerGeorge HabererSaber Qanbari43
Applications44
RNA-Seq45
Gene Models: CRY146
Gene Models: TEF47
Infectious Bursal Disease• Also known as Gumboro disease• Caused by a Birnavirus (ds RNA)• Usually diagnosed at 3-6 weeks old• Spread through contaminated feed and water• Infects B-cells• Mortality can be up to 90% (usually around 20%)• Symptoms: anorexia, depression, diahorrea, ruffledfeathers, bursal lesions, immuno-suppression• Vaccination program (but different serotypes)48
Experimental Design• 3 spleen samples from control birds (lineBrL)• 3 spleen samples from IBDV-infected birds(4dpi) (line BrL)• Compared Affymetrix whole genomeexpression arrays with RNA-Seq49
RNA-Seq BioinformaticsFastqcfastxSoap2Our owndatabaseCounts <strong>of</strong> RNA-Seqtags for each geneedgeR50
Differential Gene ExpressionGene Symbol Gene Description adjPVal FCART1 ADP-ribosyltransferase 1 [Gallus gallus] 2.13E-235 166IL28B Interferon lambda, Interleukin 28 ; [Gallus gallus] 5.60E-09 159PTX3 pentraxin-related gene, rapidly induced by IL-1 beta [Gallus gallus] 1.63E-17 89IFNB1 Interferon type B Precursor [Gallus gallus] 4.69E-07 71VEPH1 ventricular zone expressed PH domain homolog 1 (zebrafish) [Gallus gallus] 2.70E-17 57MX2 myxovirus (influenza virus) resistance 2 (mouse) [Gallus gallus] 1.21E-66 52RSAD2 radical S-adenosyl methionine domain containing 2 [Gallus gallus] 5.22E-61 48IFIT5 interferon-induced protein with tetratricopeptide repeats 5 [Gallus gallus] 4.62E-15 42TMPRSS2 transmembrane protease, serine 2 [Gallus gallus] 9.01E-26 42LYG1 lysozyme G-like 1 [Gallus gallus] 2.58E-48 41LOC768689 hypothetical protein LOC768689 [Gallus gallus] 1.72E-10 -15TNFRSF13C tumor necrosis factor receptor superfamily, member 13C [Gallus gallus] 1.18E-10 -15DAAM1L dishevelled-associated activator <strong>of</strong> morphogenesis 1-like [Gallus gallus] 2.89E-13 -16LOC424146 hypothetical LOC424146 [Gallus gallus] 6.77E-20 -16FAM5B family with sequence similarity 5, member B [Gallus gallus] 2.32E-45 -17PTPN5 protein tyrosine phosphatase, non-receptor type 5 (striatum-enriched) [Gallus gallus] 3.45E-38 -17DCLK1 doublecortin-like kinase 1 [Gallus gallus] 1.05E-15 -23PROKR2 Prokineticin receptor 2 [Gallus gallus] 2.55E-18 -37AMY1C amylase, alpha 1C (salivary) [Gallus gallus] 9.82E-09 -40CLRN3 clarin 3 [Gallus gallus] 3.60E-106 -4951
Annotated Genes• Microarrays– 693 / 828 (84%) annotated Affymetrix probes• RNA-Seq– 1509 /1867 (81%) annotated RNA tags– 1082 (72%) unique to RNA-Seq52
Enrichment Analysis: MicroarrayMicroarrays: Genes up: 330 Genes down: 223GO enrichment:Up-regulated genesImmune response; cytokineactivity; chemokine activity;regulation <strong>of</strong> IL-6 etc.Down-regulated genesProtein bindingEnriched locations: NoneTFBS enrichment:Up-regulated genesISRE, IRF7, OvoDown-regulated genesNone53
Enrichment Analysis: RNA-SeqRNA-Seq: Genes up: 733 Genes down: 822GO enrichment:Up-regulated genesAs for array dataDown-regulated genesCarbohydrate binding; structure <strong>of</strong>ribosome; biological adhesion;multicellular organismal developmentEnriched locations:Up-regulated geneschr1, chr20TFBS enrichment:Up-regulated genesISRE, IRF7, ZNF42Down-regulated geneschrZ, chr4Down-regulated genesCdxA, Nkx6_2, RSRFC4,Prrx2, FOXP154
Advantages <strong>of</strong> RNA-Seq55
Alternate Transcripts56
AcknowledgementsFundingBiotechnology and BiologicalSciences Research Council<strong>Institute</strong> for Animal HealthPete KaiserJean-Remy Sadeyen<strong>Roslin</strong> <strong>Institute</strong><strong>Dave</strong> <strong>Burt</strong>Bob PatonArk-GenomicsLe YuCentre for Genomic Regulation(Barcelona)Darek KedraCedric Notredam57
Avian RNA-Seq Consortium• 37+ labs world-wide,agreed to pool RNA-Seqdata• Multiple tissues,treatments, embryo andadults• Build gene models withinEnsembl• Return for data analysis<strong>of</strong> gene expression58
Applications59
DNA Methylation61
MeDIP-Seq: NPAS462
Data Integration63
Sequencing TechnologiesNGS technologySequencing principleRead length(bases)Raw readAccuracy (%)Readsper runGbases1st generationSanger Dideoxy sequencing ~1,000 ≥99.999 96 0.00032nd generationRoche/454 Pyrosequencing 350-450 ≥99 8.00E+05 0.4Illumina/Solexa Reversible terminator chemistry 36–100 ≥98–99 6.00E+09 600ABI/SOLiD Sequencing by ligation 35-60 ≥99.99 1.00E+08 50–1203rd generationPacBio Single-molecule sequencing 1000-4500 ≥80 4.80E+04 0.05Helicos Single-molecule sequencing 25–55 ≥97 6.00E+08 21–3564
PacBio Real-Time Sequencing65
Sequencing TechnologiesNGS technologySequencing principleRead length(bases)Raw readAccuracy (%)Readsper runGbases1st generationSanger Dideoxy sequencing ~1,000 ≥99.999 96 0.00032nd generationRoche/454 Pyrosequencing 350-450 ≥99 8.00E+05 0.4Illumina/Solexa Reversible terminator chemistry 36–100 ≥98–99 6.00E+09 600ABI/SOLiD Sequencing by ligation 35-60 ≥99.99 1.00E+08 50–1203rd generationPacBio Single-molecule sequencing 1000-4500 ≥80 4.80E+04 0.05Helicos Single-molecule sequencing 25–55 ≥97 6.00E+08 21–3566


