Malaysia - Investment Performance 2011 - Malaysian Industrial ...
Malaysia - Investment Performance 2011 - Malaysian Industrial ...
Malaysia - Investment Performance 2011 - Malaysian Industrial ...

Create successful ePaper yourself
Turn your PDF publications into a flip-book with our unique Google optimized e-Paper software.
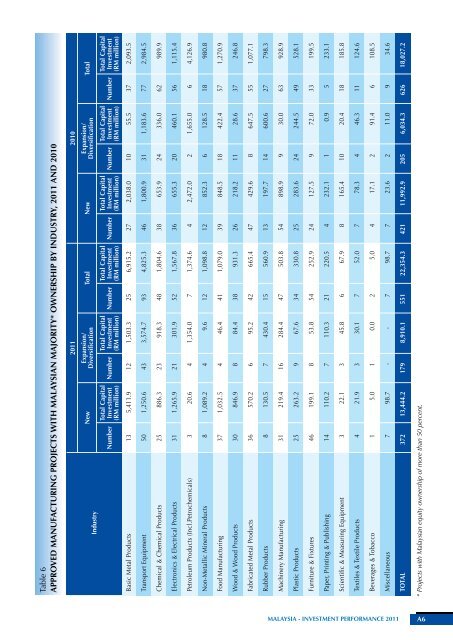
Table 6<br />
APPROVEd MANuFACTuRING PROJECTS WITH MALAYSIAN MAJORITY* OWNERSHIP BY INduSTRY, <strong>2011</strong> ANd 2010<br />
2010<br />
<strong>2011</strong><br />
New<br />
Total<br />
New<br />
Total<br />
Industry<br />
Total Capital<br />
Total Capital<br />
Total Capital<br />
Total Capital<br />
Total Capital<br />
Total Capital<br />
Number <strong>Investment</strong> Number <strong>Investment</strong> Number <strong>Investment</strong> Number <strong>Investment</strong> Number <strong>Investment</strong> Number <strong>Investment</strong><br />
(RM million)<br />
(RM million)<br />
(RM million)<br />
(RM million)<br />
(RM million)<br />
(RM million)<br />
Basic Metal Products 13 5,411.9 12 1,503.3 25 6,915.2 27 2,038.0 10 55.5 37 2,093.5<br />
Expansion/<br />
diversification<br />
Expansion/<br />
diversification<br />
Transport Equipment 50 1,250.6 43 3,574.7 93 4,825.3 46 1,800.9 31 1,183.6 77 2,984.5<br />
Chemical & Chemical Products 25 886.3 23 918.3 48 1,804.6 38 653.9 24 336.0 62 989.9<br />
Electronics & Electrical Products 31 1,265.9 21 301.9 52 1,567.8 36 655.3 20 460.1 56 1,115.4<br />
Petroleum Products (Incl.Petrochemicals) 3 20.6 4 1,354.0 7 1,374.6 4 2,472.0 2 1,655.0 6 4,126.9<br />
Non-Metallic Mineral Products 8 1,089.2 4 9.6 12 1,098.8 12 852.3 6 128.5 18 980.8<br />
Food Manufacturing 37 1,032.5 4 46.4 41 1,079.0 39 848.5 18 422.4 57 1,270.9<br />
Wood & Wood Products 30 846.9 8 84.4 38 931.3 26 218.2 11 28.6 37 246.8<br />
Fabricated Metal Products 36 570.2 6 95.2 42 665.4 47 429.6 8 647.5 55 1,077.1<br />
Rubber Products 8 130.5 7 430.4 15 560.9 13 197.7 14 600.6 27 798.3<br />
Machinery Manufacturing 31 219.4 16 284.4 47 503.8 54 898.9 9 30.0 63 928.9<br />
Plastic Products 25 263.2 9 67.6 34 330.8 25 283.6 24 244.5 49 528.1<br />
Furniture & Fixtures 46 199.1 8 53.8 54 252.9 24 127.5 9 72.0 33 199.5<br />
Paper, Printing & Publishing 14 110.2 7 110.3 21 220.5 4 232.1 1 0.9 5 233.1<br />
Scientific & Measuring Equipment 3 22.1 3 45.8 6 67.9 8 165.4 10 20.4 18 185.8<br />
Textiles & Textile Products 4 21.9 3 30.1 7 52.0 7 78.3 4 46.3 11 124.6<br />
Beverages & Tobacco 1 5.0 1 0.0 2 5.0 4 17.1 2 91.4 6 108.5<br />
Miscellaneous 7 98.7 - - 7 98.7 7 23.6 2 11.0 9 34.6<br />
TOTAL 372 13,444.2 179 8,910.1 551 22,354.3 421 11,992.9 205 6,034.3 626 18,027.2<br />
* Projects with <strong>Malaysia</strong>n equity ownership of more than 50 percent.<br />
<strong>Malaysia</strong> - investMent PerforMance <strong>2011</strong> A6