full text - Akademia Wychowania Fizycznego w Krakowie
full text - Akademia Wychowania Fizycznego w Krakowie
full text - Akademia Wychowania Fizycznego w Krakowie

You also want an ePaper? Increase the reach of your titles
YUMPU automatically turns print PDFs into web optimized ePapers that Google loves.
The influence of plyometrics training on the maximal power of the lower limbs in basketball players aged 16–18<br />
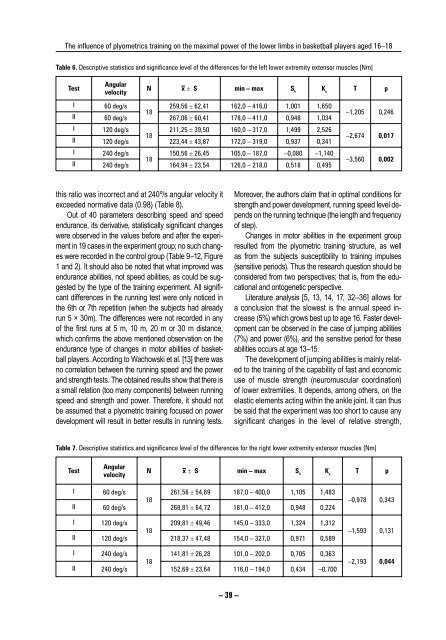
Table 6. Descriptive statistics and significance level of the differences for the left lower extremity extensor muscles [Nm]<br />
Test<br />
Angular<br />
velocity<br />
N x ± S min – max Sk Ku T p<br />
I<br />
II<br />
60 deg/s<br />
60 deg/s<br />
18<br />
259,56 ± 62,41<br />
267,06 ± 60,41<br />
162,0 – 416,0<br />
178,0 – 411,0<br />
1,001<br />
0,948<br />
1,650<br />
1,034<br />
–1,205 0,246<br />
I<br />
II<br />
120 deg/s<br />
120 deg/s<br />
18<br />
211,25 ± 39,50<br />
223,44 ± 43,87<br />
160,0 – 317,0<br />
172,0 – 319,0<br />
1,499<br />
0,937<br />
2,526<br />
0,341<br />
–2,674 0,017<br />
I<br />
II<br />
240 deg/s<br />
240 deg/s<br />
18<br />
150,56 ± 26,45<br />
164,94 ± 23,54<br />
105,0 – 187,0<br />
126,0 – 218,0<br />
–0,080<br />
0,518<br />
–1,140<br />
0,495<br />
–3,560 0,002<br />
this ratio was incorrect and at 240º/s angular velocity it<br />
exceeded normative data (0.98) (Table 8).<br />
Out of 40 parameters describing speed and speed<br />
endurance, its derivative, statistically signifi cant changes<br />
were observed in the values before and after the experiment<br />
in 19 cases in the experiment group; no such changes<br />
were recorded in the control group (Table 9–12, Figure<br />
1 and 2). It should also be noted that what improved was<br />
endurance abilities, not speed abilities, as could be suggested<br />
by the type of the training experiment. All signifi -<br />
cant differences in the running test were only noticed in<br />
the 6th or 7th repetition (when the subjects had already<br />
run 5 × 30m). The differences were not recorded in any<br />
of the fi rst runs at 5 m, 10 m, 20 m or 30 m distance,<br />
which confi rms the above mentioned observation on the<br />
endurance type of changes in motor abilities of basketball<br />
players. According to Wachowski et al. [13] there was<br />
no correlation between the running speed and the power<br />
and strength tests. The obtained results show that there is<br />
a small relation (too many components) between running<br />
speed and strength and power. Therefore, it should not<br />
be assumed that a plyometric training focused on power<br />
development will result in better results in running tests.<br />
– 39 –<br />
Moreover, the authors claim that in optimal conditions for<br />
strength and power development, running speed level depends<br />
on the running technique (the length and frequency<br />
of step).<br />
Changes in motor abilities in the experiment group<br />
resulted from the plyometric training structure, as well<br />
as from the subjects susceptibility to training impulses<br />
(sensitive periods). Thus the research question should be<br />
considered from two perspectives; that is, from the educational<br />
and ontogenetic perspective.<br />
Literature analysis [5, 13, 14, 17, 32–36] allows for<br />
a conclusion that the slowest is the annual speed increase<br />
(5%) which grows best up to age 16. Faster development<br />
can be observed in the case of jumping abilities<br />
(7%) and power (6%), and the sensitive period for these<br />
abilities occurs at age 13–15.<br />
The development of jumping abilities is mainly related<br />
to the training of the capability of fast and economic<br />
use of muscle strength (neuromuscular coordination)<br />
of lower extremities. It depends, among others, on the<br />
elastic elements acting within the ankle joint. It can thus<br />
be said that the experiment was too short to cause any<br />
signifi cant changes in the level of relative strength,<br />
Table 7. Descriptive statistics and significance level of the differences for the right lower extremity extensor muscles [Nm]<br />
Test<br />
Angular<br />
velocity<br />
N x ± S min – max S k K u T p<br />
I 60 deg/s<br />
261,56 ± 54,69 187,0 – 400,0 1,105 1,483<br />
18<br />
II 60 deg/s 268,81 ± 64,72 181,0 – 412,0 0,948 0,224<br />
I 120 deg/s<br />
209,81 ± 49,46 145,0 – 333,0 1,324 1,312<br />
18<br />
II 120 deg/s 218,37 ± 47,48 154,0 – 327,0 0,971 0,589<br />
I 240 deg/s<br />
141,81 ± 26,28 101,0 – 202,0 0,705 0,363<br />
18<br />
II 240 deg/s 152,69 ± 23,64 116,0 – 194,0 0,434 –0,700<br />
–0,978 0,343<br />
–1,593 0,131<br />
–2,193 0,044
![Antropomotoryka nr 57 [2012]. - Akademia Wychowania Fizycznego ...](https://img.yumpu.com/50213388/1/182x260/antropomotoryka-nr-57-2012-akademia-wychowania-fizycznego-.jpg?quality=85)