January - Early Edition - CI Investments
January - Early Edition - CI Investments
January - Early Edition - CI Investments
- No tags were found...

Create successful ePaper yourself
Turn your PDF publications into a flip-book with our unique Google optimized e-Paper software.
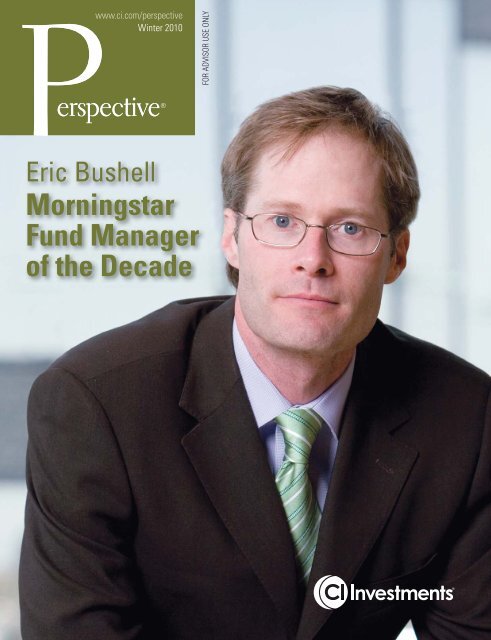
www.ci.com/perspectiveWinter 2010Eric BushellMorningstarFund Managerof the Decade
Funds In FocusScorecard December 31, 2010Portfolio SeriesLead ManagerY-T-D(%)1 MTH(%)6 MTH(%)1 YR(%)3 YR(%)5 YR(%)10 YR(%) Life (%)Portfolio Series Balanced <strong>CI</strong> <strong>Investments</strong> 8.7 2.8 12.3 8.7 1.0 2.5 3.8 7.0 (Nov.‘88)Portfolio Series Balanced Growth <strong>CI</strong> <strong>Investments</strong> 9.3 3.4 13.8 9.3 0.4 2.1 N/A 3.6 (Dec.’01)Portfolio Series Conservative <strong>CI</strong> <strong>Investments</strong> 8.9 2.0 10.0 8.9 2.6 3.1 4.6 4.9 (Dec.‘97)Portfolio Series Conservative Balanced <strong>CI</strong> <strong>Investments</strong> 8.6 2.4 10.9 8.6 1.8 2.6 N/A 4.2 (Dec.’01)Portfolio Series Growth <strong>CI</strong> <strong>Investments</strong> 9.5 3.8 15.0 9.5 -0.7 1.5 N/A 2.9 (Dec.’01)Portfolio Series Income <strong>CI</strong> <strong>Investments</strong> 8.8 1.0 7.8 8.8 4.9 4.1 5.1 5.0 (Dec.‘97)Portfolio Series Maximum Growth <strong>CI</strong> <strong>Investments</strong> 9.9 4.7 17.8 9.9 -2.2 0.9 N/A 2.1 (Dec.’01)Global Equity FundsCambridge Global Equity Alan Radlo 9.1 4.8 19.7 9.1 2.7 N/A N/A 2.7 (Dec.’07)<strong>CI</strong> Emerging Markets Pablo Salas 11.5 3.9 21.2 11.5 -2.8 7.5 6.9 7.7 (Sept.’91)<strong>CI</strong> Global Sterling / Gigliotti / Beckwitt 6.9 5.7 18.1 6.9 -6.5 -3.6 -4.0 5.0 (Feb.’86)<strong>CI</strong> Global High Dividend Advantage Priest / Sappenfield / Welhoelter 6.1 3.3 14.5 6.1 -4.5 N/A N/A -1.1 (Jan.’06)<strong>CI</strong> Global Value John Hock 5.4 4.8 14.3 5.4 -2.3 -2.0 -0.8 1.0 (June’96)<strong>CI</strong> International Value John Hock 4.1 5.4 15.1 4.1 -3.6 -1.1 -0.1 0.8 (June’96)Harbour Foreign Equity S. Jenkins / G. Coleman 8.7 6.0 16.3 8.7 -3.9 0.3 N/A 1.1 (Dec’01)Synergy Global D. Picton / M. Mahoney 8.0 5.1 17.8 8.0 -6.3 -1.6 -1.3 -1.3 (Mar’99)American Equity Funds<strong>CI</strong> American Managers ® Multiple Managers 6.3 3.2 15.0 6.3 -2.6 -1.5 -0.2 0.4 (Jul.’00)<strong>CI</strong> American Value W. Priest / D. Pearl 5.8 2.8 14.1 5.8 -3.9 -0.4 N/A 0.1 (Aug.’01)Canadian Equity FundsCambridge Canadian Equity Alan Radlo 12.5 5.0 18.7 12.5 2.1 N/A N/A 2.1 (Dec.’07)<strong>CI</strong> Canadian Investment Daniel Bubis 13.2 4.8 19.2 13.2 1.6 4.0 8.3 8.6 (Nov.‘32)Harbour G. Coleman / S. Jenkins 9.5 5.4 17.0 9.5 1.6 5.1 8.0 8.2 (June’97)Signature Select Canadian Eric Bushell 10.3 5.3 17.8 10.3 1.4 5.4 8.4 10.8 (May’98)Synergy Canadian David Picton 13.5 3.8 19.5 13.5 -1.8 3.4 5.4 9.6 (Dec.’97)Balanced FundsCambridge Cdn. Asset Allocation Alan Radlo 13.0 4.3 17.3 13.0 3.9 N/A N/A 3.9 (Dec.’07)Harbour Growth & Income G. Coleman / S. Jenkins 8.0 4.9 14.1 8.0 1.7 3.9 6.7 6.1 (June’97)Signature Global Income & Growth Eric Bushell 8.9 3.1 13.3 8.9 2.1 N/A N/A -0.6 (Feb.’07)Signature Income & Growth E. Bushell / J. Dutkiewicz 10.3 3.3 13.6 10.3 3.5 4.9 7.4 7.3 (Nov.’00)Industry-Specific FundsSignature Global Energy Scott Vali 11.8 7.0 25.0 11.8 2.0 4.8 12.9 14.0 (June’98)Signature Canadian Resource Scott Vali 15.4 6.8 28.4 15.4 4.8 11.9 18.1 12.3 (Apr.’97)Income FundsSignature Canadian Bond James Dutkiewicz 6.1 0.0 1.6 6.1 4.6 3.7 4.5 6.0 (Aug.’02)Signature Corporate Bond Dutkiewicz / Shaw / Marshall 9.3 0.5 5.3 9.3 6.6 4.8 N/A 4.3 (Jan.’02)Signature Diversified Yield D’Angelo / Fitzgerald / Marshall 10.1 1.3 10.9 10.1 N/A N/A N/A 9.4 (Nov.’09)Signature Dividend Eric Bushell 9.4 3.2 11.7 9.4 3.6 3.2 5.3 6.6 (Oct.’96)Signature High Income Eric Bushell 15.3 1.1 13.3 15.3 5.7 4.8 10.4 10.0 (Dec.’96)2 WINTER 2011 EARLY EDITION PERSPECTIVE AS AT DECEMBER 31, 2010
Winter 2011Dear Advisor,It is traditional at thistime of year to reflect onthe past and look aheadto the future. As weconsider 2010, we cansay that it turned out tobe a respectable year forfinancial markets. Aftera volatile first half, mostglobal equity marketsstaged a steady reboundto post positive returns for the 12 months. The fixed-incomemarkets also rewarded investors in 2010.As we enter a new year, the lingering effects of the globalcredit crisis are still affecting the investment climate, as wellas the broader economy. <strong>CI</strong>’s commitment for 2011 is toprovide you with the tools you require to meet the challengesof this uncertain environment. We continue to step upthe information, products and expertise we offer to you andyour clients.For portfolio management expertise, we have one of theindustry’s best lineups here at <strong>CI</strong>. Further recognition of thestrength of our teams came in December, with MorningstarCanada selecting Eric Bushell, Chief Investment Officerof Signature Global Advisors, as Fund Manager of theDecade. Morningstar cited him for the top-ranked long-termperformance by many Signature funds, his consistency andrisk management, and his accomplishments in building theSignature group into a global investment team. A profile ofEric has been reprinted on page 4 of this issue.We are also pleased to have added two other strong portfoliomanagement teams to the <strong>CI</strong> family – Black CreekInvestment Management, led by industry veterans Bill Kankoand Richard Jenkins, and Greystone Managed <strong>Investments</strong>.These managers will continue to be available through thenewly acquired Hartford <strong>Investments</strong> Canada, which we areoperating as a separate and distinct firm from <strong>CI</strong> <strong>Investments</strong>.The new name of this firm and other details will be announcedin the near future.Last year, we launched the Get Connected series of webcaststo keep you informed of our portfolio managers’ views and thepositioning of their funds. The webcasts have been so popularthat we have now increased the frequency to twice a month, aswell as adding manager podcasts. Please check the scheduleon the back cover and watch for your e-mail reminders.The webcasts and other commentaries from our portfoliomanagers are summarized on our website at www.ci.com.Go to “What’s New” and click on “<strong>CI</strong> Market Outlook.” Inaddition, we are providing the Get Connected Market Board,a weekly summary of economic developments that is beinge-mailed to advisors on Monday mornings.“ In May 2011, <strong>CI</strong> will be hosting its firstLeadership Forum – an exclusive event for500 advisors to be held in Las Vegas.”Finally, I would like to announce an important newdevelopment in our support for advisors. In May 2011, <strong>CI</strong>will be hosting its first Leadership Forum – an exclusive eventfor 500 advisors to be held in Las Vegas. The conferencewill feature great speakers and other top-notch and timelyeducational content, as well as opportunities to meet andsocialize with your peers and colleagues from <strong>CI</strong> – all againstthe glamorous backdrop of the Entertainment Capital of theWorld. We expect to announce further details soon.I thank you for your support in 2010 and we look forward toworking with you this year. If you need any assistance, pleasecontact your <strong>CI</strong> Sales Team.Sincerely,Derek J. GreenPresident<strong>CI</strong> <strong>Investments</strong>WINTER 2011 EARLY EDITION PERSPECTIVE AS AT DECEMBER 31, 2010 3
Investment Executive Article ReprintOff the beaten pathEric Bushell rejects traditional asset-management conventionsBy Dwarka LakhanEric Bushell’s approach to money management could be seen as a bit unorthodox – at least,when compared with his peers. But regardless of how you describe Bushell’s strategy, it haspaid big dividends.Bushell, winner of the 2010 Morningstar Fund Manager ofthe Decade award and vice president and chief investmentofficer with Signature Global Advisors, a division of Torontobased<strong>CI</strong> <strong>Investments</strong> Inc., leads a team that oversees almost$28 billion in mutual fund and institutional assets that haveproduced stellar returns over the past decade.For example, the $4-billion <strong>CI</strong> Signature Select CanadianFund posted an average annual return of 7.9% for the 10-yearperiod ended Sept. 30, 2010, compared with a gain of 4.1%for the S&P/TSX total return index.Bushell, 42, says his success can be attributed to hisdifferent management style and a distinctive team structure:“We have rejected the traditional asset-managementconventions in relation to investment style and otherconstraints, which restrict our flexibility. We have turned thewhole framework relating to style — such as ‘growth’ and‘value’ — upside down and believe in common sense andflexibility, which is a core dimension of our style.”Bushell argues that “narrow investment mandates, such assingle style, single sector and single country, end up hurtingclients.” He adds: “Flexibility is required within any strategyto manage valuation risks, liquidity risks and credit risks.”Bushell firmly believes “in interconnectivity of six mainmarkets — commodities, foreign exchange, interest rates,equities, property and credit” and that “developments in anyone market affect all the others.” This approach is differentfrom “most asset managers,” he says, “[who] are narrowlyfocused and have a ‘silo’ problem, presenting them withchallenges in a world that is increasingly interconnected.”Bushell also credits his team approach for his success:“Global sector specialists are responsible for all fundsacross all geographies.” Information is shared across allsectors to assist in decision-making and to provide“early warning” system.Bushell believes that the 2008 financial crisis marked“a shift in the centre of global economic power, which willultimately lead to a change in financial, political and militarypower.” This shift, he adds, will result in a “leadership changeas we move from a G7 to a G20 world; the G7 has becomean anachronism.”Bushell is optimistic about emerging markets and favourscompanies that can latch on to growth in these countries.Capital migration from the developed to the developingworld is growth-seeking; and corporations as well as portfolioinvestments are flowing into emerging economies — andwill continue to do so, he says, until growth constraints resultin inflationary challenges.Bushell favours equities that produce solid yields; corporatebonds, which he believes are becoming less risky; and realproperty, which is experiencing a price recovery due to lowinterest rates.Says David O’Leary, Morningstar Canada’s director of fundanalysis: “The [Fund Manager of the Decade] award is notonly based on solid, long-term performance but also onstewardship of unitholder capital and the ability to mitigaterisk and volatility in both up and down markets. Someportfolio managers have better absolute returns; but Bushellmanages billions of dollars for several mandates, to thebenefit of a large pool of unitholders.”Reprinted with permission from Investment Executive – 2011 Canadian Investment Guide.4 WINTER 2011 EARLY EDITION PERSPECTIVE AS AT DECEMBER 31, 2010
<strong>CI</strong> <strong>Investments</strong> congratulates Eric Bushell,Chief Investment Officer of SignatureGlobal Advisors, for being namedMorningstar Fund Manager of the Decadeat the 2010 Canadian Investment Awards.Morningstar chose Eric for his long-termoutperformance, consistency, ability tomanage risk and for “the architecture of astrong, credible team” in Signature Global Advisors. Signaturemanages over $25 billion in a broad range of global andCanadian income, balanced and equity mandates. Under Eric’sdirection, the team has developed significant expertise in allglobal sectors and asset classes.Over the past decade, Signature has won an exceptional13 Canadian Investment Awards, as well as five Lipper FundAwards in the last four years. Find out how you can benefitfrom the skill of the Fund Manager of the Decade andthe Signature team, at www.ci.com.
Spotlight James DutkiewiczAbout 43% of the fund is corporate credit, versus roughly26% for the benchmark. All of the credits in the mandateare investment grade. The fund is rounded out with 38% infederal government securities, 15% in provincial governmentbonds and the balance in cash.“In terms of the corporate credits, we own a fair amount ofU.S. financials,” Mr. Dutkiewicz points out. “We hold theU.S banks, J.P. Morgan, Wells Fargo, and Bank of AmericaMerrill Lynch. Also, recently, we’ve been buying a lot of thegrocery store chains, including Loblaw. We didn’t own any ofit two years ago.”Signature Corporate Bond FundSignature Corporate Bond Fund is a blend of asset classes.It can invest in investment-grade bonds across the maturityspectrum, based on Mr. Dutkiewicz’s direction, or it caninvest in high-yield corporate bonds, under the direction ofGeof Marshall, who heads Signature’s high-yield team. Thefund’s third lead manager is John Shaw, who concentrateson international credit analysis, corporate bonds andpreferred shares.In terms of positioning, the fund began 2010 with a60% allocation to investment grade and 40% in high yield.“It’s currently flipped around. It’s now 60% high yield andjust under 40% in investment grade,” says Mr. Dutkiewicz.“That reflects our growing confidence about the recovery.When we lend money to companies in the high-yield spacewe get a greater yield than investment grade. Our averagerating in the high-yield portion of the portfolio is singleB high to double B low, slightly higher quality than the highyieldbenchmark. Our modus operandi in high yield is tobuy good companies. We don’t buy distressed debt. We don’ttry to catch falling knives or falling pianos. We want to buycompanies that we think are going to be successful.”And by shifting exposure away from investment grade,Mr. Dutkiewicz says, Signature is reducing duration orinterest rate risk. The average maturity of the corporate bondfund is less than five years.8 WINTER 2011 EARLY EDITION PERSPECTIVE AS AT DECEMBER 31, 2010
Coming soon … new website forAs part of our commitment to provide useful information and tools for you andyour clients, we are pleased to bring you our new Corporate Class website.About <strong>CI</strong> Corporate Class …<strong>CI</strong> Corporate Class provides many of the benefits that can be found withTFSAs or registered accounts, including the ability to defer tax oninvestment income and capital gains. This allows for increasedcompound growth over the long term and the ability to makeinvestment decisions such as rebalancing, without worryingabout the tax consequences. Corporate Class alsoallows clients to draw tax-efficient cash flow fromtheir investments.<strong>CI</strong> Corporate Class is an ideal choice for allnon-registered investments.www.ci.com/corporateclassWINTER 2011 EARLY EDITION PERSPECTIVE AS AT DECEMBER 31, 2010 9
Signature Market RoundupMarket RoundupGlobal outlookGlobal outlookEric BushellSenior Vice-President,Portfolio Managementand Chief Investment OfficerWe exited the third quarter believing that fears of a double-diprecession were overstated and that the bond market, wheredefensive investors had been hiding since the credit crisisbegan, had become fully valued. Since then, the U.S. FederalReserve took out added insurance in November against thepossibility of deflation by embarking on a US$60 billionTreasury purchase program. The dollar weakness associatedwith this second round of quantitative easing (or “QE2”)propelled commodities higher, led by gold, as printing of theworld’s reserve currency can have that effect. Moves higher foreconomically sensitive commodities like copper, oil and coalwere underpinned by real demand and supply disruptions. Inour diversified funds, we prefer to emphasize commoditieswith real uses ahead of gold. Inflation expectations have risenand global real interest rates have headed higher since QE2.In Europe, the temporary fund set up to ensure financialstability fund was made permanent as the European CentralBank pushed Ireland to become the first nation to accept abailout. Nonetheless, discussions over private sector losses ongovernment bonds and bank refinancing challenges elevatedconcerns among investors.The Republican victory in the U.S. mid-term elections wasgood news for business, which continued with the Obamaadministration’s agreement to extend Bush-era income taxcuts and add further tax incentives for business. We believethese measures will be effective in unlocking pent-up hiringand capital expenditure activity in coming quarters. Food andwage inflation pressures throughout developing economiesalso emerged in the fourth quarter, marking an end to theera of global disinflation. Overall, 2011 should see a recoveryin bank lending, consumption and business investment. Inshort, it should be a good year for global growth, and equitiesshould outperform as they did in 2010.Drummond BrodeurVice-President,Portfolio Managementand Global StategistThe outlook for global equity markets in 2011 is attractive.While many structural challenges remain – such as sovereigndebt in developed economies and rising inflation in emergingeconomies – our belief is that these issues will be trumped bythe unfolding cyclical recovery.All signs are that the U.S. economy has re-accelerated andshould continue to see strong private sector-led growth through2011, as companies invest and hire to meet growing demand.Meanwhile, policymakers have made it clear they will nottighten prematurely. The Federal Reserve remains committedto quantitative easing until June, while the necessary fiscalausterity has been deferred to 2012 at the earliest withthe extension of the Bush tax cuts and other measures tosupport employment.Many emerging economies have enjoyed robust recoveries andhave begun to tighten fiscal and monetary policy in response torising inflation. Nevertheless, we do not see this as a threat totheir still strong growth. While we believe Europe recognizesthe need to find solutions to its debt problems, we are less certainthat the same realization exists in the U.S., the world’s largestdebtor nation. The key challenge facing the global economy inthe next few years will be addressing the imbalances betweenthe U.S. and its creditors, led by China. We will be monitoringdevelopments as the world strives to develop a new set of rulesfor international economic engagement.10 WINTER 2011 EARLY EDITION PERSPECTIVE AS AT DECEMBER 31, 2010
Signature Market RoundupInterest ratesReal estate and income trustsJames DutkiewiczVice-President,Portfolio Managementand Portfolio ManagerIn early 2011, global interest rate markets are likely to see acontinuation of recent trends. Yields rose rather dramaticallyin the fourth quarter in response to improved economicdata and renewed fiscal and monetary stimulus in theUnited States. Consumer spending over the holidays wasup 5% over the previous year, job growth is reboundingand commercial and industrial loan growth has turnedpositive. These are signs of a strengthening cyclical expansionthat has led to a significant increase in consensus 2011 GDPforecasts. However, both core and headline inflation datacontinue to trend lower. Furthermore, the Federal Reserveat its December meeting indicated that economic growthwould have to meet a high hurdle rate before it would curtailthe $600 billion Treasury buying program.This presents a dilemma for bond investors. Where shouldlong-term yields be when overnight borrowing rates arefixed at 0.25%, the central bank is buying bonds and thereis no inflation, but growth is rebounding and equities lookattractive? We expect that 10-year U.S. yields will rangebetween 3.25% and 4.0% over the next few months andthat levels below 3.0% are highly unlikely. Canadian bondyields should track the same general pattern as the Canadianeconomy recovers from its third quarter swoon.Ryan FitzgeraldVice-President,Portfolio Managementand Portfolio ManagerWith the passing of 2010, we finally say goodbye to theincome trust. The income trust model required constantaccess to capital markets, something that was severelyimpaired following Federal Finance Minister Jim Flaherty’s2006 announcement that trust distributions would be taxedat corporate tax rates beginning in 2011. What did notchange was investors’ need for yield, especially following theprecipitous decline in interest rates with the 2008 financialcrisis. This resulted in massive fund flows into a select group ofincome trusts that market participants deemed would be ableto sustain their distributions after becoming taxable. Typically,these were the best companies to start with, companies withvery stable, long-dated cash flows. Favoured sectors such aspipeline operators, renewable power generators, and REITs(which are not affected by the new trust rules) benefitedfrom this fund flow and, in some cases, saw valuations rise toall-time highs.In 2011, we expect more of the same. The small set of“winners” will continue to be favoured by investors who havelimited options for achieving high yields elsewhere. Thiscreates an environment ripe for overvaluation. Currently, ourholdings are concentrated in these favoured sectors, but weare selectively taking profits and looking to re-deploy capitaloutside of Canada, where valuations are more reasonable.WINTER 2011 EARLY EDITION PERSPECTIVE AS AT DECEMBER 31, 2010 11
Signature Market RoundupFinancialsJohn HadwenVice-President,Portfolio Managementand Portfolio ManagerWe felt strongly that U.S. banks were well positioned for2010 with strong capital positions, sufficient credit reserves,and a view that credit costs would trend lower. Regulatoryrisks represented a concern but undemanding valuationsseemingly provided room to absorb punitive taxes and highercapital requirements. Our positioning served us extremelywell in the first quarter of the year, as the market began torecognize significant credit improvement and capital strengthin the sector.In April 2010, however, things took a turn for the worse, asthe SEC filed a complaint against Goldman Sachs. Thisdevelopment and the subsequent rhetoric contributed tothe passage of a Financial Reform Bill with higher capitalrequirements and tough restrictions related to proprietarytrading, hedge funds, private equity funds, debit interchange,and derivatives activities. The bill’s design was quitedamaging for the financial sector with direct revenue hitsand added structural costs. There is also concern that thenew Consumer Financial Protection Agency presents anunpredictable new risk.Outside of the U.S., industry and regulators were focused onthe design and implementation of the Basel III internationalbanking standards. It was well recognized that the quantityand quality of bank capital would be trending higher, butto what degree and timeline? The final capital structure forbanks will have significant impact on leverage and thus returnon equity and valuation. The Basel proposals entertainedchallenging (perhaps ridiculous) liquidity requirements andasset/liability matching that could make certain traditionalbanking services uneconomic. This confusion resulted insignificant debate about future bank valuation. In addition,regulators and politicians pushed the capital debate to a newlevel with the view that new measures were needed to protectgovernments from future bank bailout expenses.The sovereign debt crisis added to the sector’s woes in 2010,given that any losses on Portuguese, Irish, Greek and Spanishgovernment bonds would have a significant impact.Over the past two years, regulatory changes and potentialregulatory changes have had a much greater impact on bankvaluations. This ongoing uncertainty has depressed investorconfidence in the sector, which is why it remains significantlyundervalued on a global basis. We expect global financialequities to perform well in 2011 as sector earnings, dividendsand capital levels continue to recover.12 WINTER 2011 EARLY EDITION PERSPECTIVE AS AT DECEMBER 31, 2010
Signature Market RoundupHealth careTechnology, media & telecommunicationsRui CardosoVice-President,Portfolio Managementand Portfolio ManagerThe health care sector continued to lag the overall marketin closing out 2010 and it finished the year as the worstperformer among the S&P 500 industry groups, as moreeconomically sensitive sectors outperformed. Despite alate-year rally, medical device companies were the weakestsub-group in the health care universe because of fears of lowerhealth care utilization and pricing pressures from hospitaland insurance groups in the U.S. and fears of reimbursementcuts in Europe. Pharmaceutical stocks fared better, but stilllagged the market, while drug distributors and life sciencetool companies were the best-performing groups.Looking into 2011, we maintain a positive outlook for thesector due to historically low valuation levels, reducedheadline risk related to health care reform, and improvingprospects stemming from maturing drug pipelines for bigpharma. We expect that investors will increasingly focus onthe sector’s emerging markets exposure and its high dividendyields provide added income potential for patient investorswaiting for valuation levels to normalize.Malcolm WhiteVice-President,Portfolio Managementand Portfolio ManagerThe technology sector started the year with a bang atthe Consumer Electronics Show. The focus this year isthe growth of the tablet market, pioneered by Apple butnow becoming more mainstream as players such as RIM,Microsoft and others launch their product offerings. Thisis exciting because tablets are a key component of a largerstructural revolution that is occurring as we shift to acloud-based computing paradigm.The focus of the media sector in 2011 will undoubtedlybe the impact of social media in the advertising market.Discussion has heated up as Facebook has now surpassedGoogle in terms of Web traffic and in light of a potential IPOfrom Facebook this year or next.On the telecommunications side, the sector continues to offerattractive dividend yields in a low interest rate environment.Growth is coming from an explosion of data as more peopleadopt smartphones that offer more utility than simple voice.We are especially excited about the acceleration of data usagein emerging markets as new next-generation wireless datanetworks are deployed.WINTER 2011 EARLY EDITION PERSPECTIVE AS AT DECEMBER 31, 2010 13
Signature Market RoundupNatural resourcesForeign ExchangeScott ValiVice-President,Portfolio Managementand Portfolio ManagerEnergy and materials markets rallied into year-end on theback of favourable economic growth indicators and disruptivesupply dynamics. Australia was hit with severe flooding inkey thermal and coking coal producing regions, disruptingsupply and causing major producers to declare force majeure.These disruptions have once again reminded the world thatsupply is very tight with multiple infrastructure bottlenecks.Supply from this region is likely to be constrained at leastuntil the end of <strong>January</strong>.Copper prices also increased as continued strong demandand incremental supply disruptions focused attention onthe expected supply deficits in 2011. With limited newproduction and declining head grades at current operations,the copper market should continue to be strong this year.Oil markets also appear to be tightening. With confidencein global growth returning and increasing North Americandemand, the markets are anticipating a reduction in sparecapacity. The increase in oil prices is leading to a renewalof exploration and exploitation, boosting demand forenergy services.Grain markets are also tight, with disappointing harvestsin North America and the ongoing drought in Argentina.However, farm income should continue to be strong, leadingto robust fertilizer applications and the restocking of depletedwholesale and retail channels.James DutkiewiczVice-President,Portfolio Managementand Portfolio ManagerAs expected, the Canadian dollar has traded at and slightlyabove parity versus the U.S. dollar. Canada has overcomea trade deficit that is running at an annualized rate of$25 billion in the past four months, which is in sharpcontrast to the $40 billion to $50 billion in annualizedsurpluses in 2007-2008. Net foreign demand for Canadiansecurities, mostly debt products, has jumped to over$11 billion monthly in the past quarter. This demand, whichis easily funding the current account deficit, and highercommodity prices have contributed to the loonie being oneof the strongest currencies in the G10 in the past few months.The predominant story in foreign exchange marketsrecently has been the resurgence of the U.S. dollar versusthe euro. We increased our hedge against the euro in earlyNovember as a precaution to a “buy the rumour, sell the fact”market reaction to the quantitative easing announcementin the U.S. Indeed, the euro has retraced much of its rallyfrom the summer, as Ireland sought financial assistance fromthe European Union and IMF. The outlook for the eurois problematic in the near term, due to an imposing debtrefinancing schedule for the peripheral nations. That said,we believe the EU will avert a funding crisis. The euro willexperience significant volatility, but is unlikely to trade tonew lows versus the U.S. dollar.Overall, we look for commodities to continue at robust pricelevels in 2011.14 WINTER 2011 EARLY EDITION PERSPECTIVE AS AT DECEMBER 31, 2010
Signature Market RoundupHigh-yield bondsGeof MarshallVice-President,Portfolio Managementand Portfolio ManagerWith a 15.2% return in 2010, the high-yield bond market hasposted the best two-year return in the short history of the assetclass. Considering the record amount of new issue supplyin 2009 and 2010, this has been astonishing. The markethas had extended periods of above-average returns in thepast, including 1991-1993, 1995-1997 and 2003-2006. Thequestion then is, can the current rally continue?While all-in yields are modest, valuations as measured by creditspreads (the difference in the yield between the corporatebond and a Treasury bond of comparable maturity), whichare currently at +541 basis points, approximate the historicalaverage of +534 basis points. This average, however, has beenskewed by the massive widening of spreads that occurred in2008, so the 1984-2007 average of +456 basis points providesa better yardstick.Strong corporate fundamentals and an improving economyshould ensure that default rates remain low. This makesvaluations even more compelling, with a high likelihoodof further spread tightening. Price appreciation gains fromspread tightening could face a slight headwind from risingTreasury yields, possibly late in the year. In this case, totalreturns would be in the high-single-digit range, but lower thanthe previous year, although we made the same predictionlast year. As such, we consider high-yield bonds the mostattractive part of the fixed-income market and they continueto comprise a core component of our income strategies.WINTER 2011 EARLY EDITION PERSPECTIVE AS AT DECEMBER 31, 2010 15
<strong>CI</strong> Income Opportunities –Fund Highlights<strong>CI</strong> <strong>Investments</strong> offers a comprehensive selection of income funds to meet investor needs.These range from traditional bond funds to diversified income funds that offer enhancedyields by investing in higher-yielding asset classes, such as high-yield corporate bonds,infrastructure, REITs and other real estate-related securities. To assist you in choosingthe appropriate funds for your clients, we present this monthly communication featuringhighlights of seven key income offerings. This piece is being e-mailed on a monthly basis.Please contact your <strong>CI</strong> sales team to ensure delivery. We hope you will find it useful andinformative in discussions with your clients.16 WINTER 2011 EARLY EDITION PERSPECTIVE AS AT DECEMBER 31, 2010
Income Opportunitiesas at November 30, 2010 (Class A)SignatureDiversifiedYieldSignatureHigh IncomeSignatureCorporateBondSignatureIncome &GrowthPS IncomeSelect IncomeAdvantageManagedSignatureCanadianBondMonthly per unit distribution $0.05 $0.07 Variable $0.025 $0.04 N/A VariableAnnualized distribution payout 5.3% 6.2% Variable 6.4% 4.4% N/A VariablePortfolio yield (approx.) 6.2% 6.3% 6.8% 3.9% 5.0% 4.4% 3.7%Dividend characteristicsCurrent asset mix*ROC &capital gainsROC, income &capital gainsIncomeIncome &capital gainsIncome &capital gainsCash 10% 6% 3% 6% 6% 11% 4%Government and investmentgrade corporate bonds6% 6% 36% 11% 38% 49% 96%High-yield bonds 45% 36% 61% 20% 21% 18% 0%REITs, trusts, & equities 39% 52% 0% 63% 35% 22% 0%DurationIn years (bond portion) 3.9 3.4 4.4 3.9 4.9 5.2 6.0Credit qualityAverage credit quality BB BB+ BB+ BBB A- A+ AA-% under Single B 5% 7% 4% 6% 3% 2% 0%Currency exposure* ‡CAD 73% 88% 91% 82% 76% 71% 99%USD 19% 7% 9% 9% 9% 10% 1%EUR 0% 1% 0% 1% 4% 4% 0%Other 8% 4% 0% 8% 11% 15% 0%Management feesClass A 1.90% 1.25% 1.70% 2.00% 1.65% 1.65% 1.35%Class F 0.90% 0.75% 0.85% 1.00% 0.90% 0.90% 0.85%PMA ($500K level)† 0.95% 0.95% 0.95% 0.95% 0.95% 0.70% 0.70%PMA ($1M level)† 0.85% 0.85% 0.85% 0.85% 0.85% 0.65% 0.65%Trailer feesClass A (ISC/DSC) 1.00%/0.50% 0.50%/0.25% 0.50%/0.25% 1.00%/0.50% 0.50%/0.25% 1.00%/0.50% 0.50%/0.25%Fund codesTrust Class A FE 619 686 9010 6116 7740 N/A 837Trust Class A DSC 819 786 9060 6166 7745 N/A 847Trust Class A LL 1619 1786 1150 1166 1745 N/A 1847Corp Class FE 2319 2304 2308 2309 N/A 2265 2303Corp Class DSC 3319 3304 3308 3309 N/A 3265 3303Corp Class LL 1319 1304 1308 1309 N/A 1465 1303N/AIncomeSource: <strong>CI</strong> Investment Consulting, RBC Dexia, Wilshire Atlas, Wilshire Axiom* Aggregate exposure may not equal 100% due to rounding.† Includes both management and administration fees.‡ Currency exposure includes the effect of hedging.WINTER 2011 EARLY EDITION PERSPECTIVE AS AT DECEMBER 31, 2010 17
Signature Diversified Yield Fund November 30, 2010Fund ManagementGeof Marshall, VP, Portfolio ManagerJoe D’Angelo, VP, Portfolio ManagerRyan Fitzgerald, VP, Portfolio ManagerEric Bushell, SVP, Chief Investment OfficerSignature Global Advisors of Toronto, a division of <strong>CI</strong><strong>Investments</strong> Inc., manages $25 billion across all asset classes,including fixed income and Canadian and global equities.Signature’s advantage is its approach in which portfoliomanagers and analysts specializing in each asset class andsector combine their research to develop a comprehensivepicture of a company and its securities. The team is led byChief Investment Officer Eric Bushell.Fund CharacteristicsNAV: $10.30Monthly distribution/unit: $0.05Annualized Payout Ratio: 5.8%Portfolio Yield (approx.): 6.3%Distribution characteristics: ROC and Capital GainsKey Facts• Diversified income portfolio by asset class, geography,and region.• Tax-advantaged monthly distribution.• High-quality high-yield portfolio.• Active currency hedging strategy used for bothprotection and advancement of foreign holdingswithin the portfolio.• Also available in tax-effi cient Corporate Class,T-Class, and segregated funds.Holdings AnalysisAsset classHigh-yield bonds 45%Real estate 23%Infrastructure 17%Cash & equivalents 10%Gov’t & investment-grade corporate bonds 5%Other 0%GeographyUnited States 39%Canada 28%Pacific Rim 18%Europe 10%Other 5%Currency exposureCanadian dollar 73%U.S. dollar 19%Other 8%Euro 0%Bond characteristicsDuration in years 4.1Foreign bonds 42%% of fund rated under B 5%Average credit qualityBBSectorFinancials 35%Industrials 17%Cash & equivalents 10%Consumer discretionary 9%Energy 6%Telecommunications 6%Health care 4%Materials 4%Utilities 3%Consumer staples 2%Technology 2%Other 2%18 WINTER 2011 EARLY EDITION PERSPECTIVE AS AT DECEMBER 31, 2010
Portfolio SnapshotPerformanceYTD 1 month 3 months 6 months 1 yearSignature Diversified Yield 8.7% -1.7% 3.3% 10.5% 9.3%HoldingsReal estateTop 5 Holdings Country WeightBrookfield Asset Management Inc. Canada 4.4%H&R REIT Canada 2.5%Capital Commercial Trust Singapore 2.2%Chartwell Seniors REIT Canada 1.9%Westfield Group REIT Australia 1.7%High-yield bondsTop 5 Holdings Country WeightCHC Helicopters SA, 9.25%, 15Oct20 Canada 1.2%Harvest Operations Corp., 6.875%, 01Oct17 Canada 1.1%Goodyear Tire and Rubber Co., 10.5%, 15May16 United States 0.9%Lender Processing Services inc., 8.125%, 01Jul16 United States 0.8%CB Richard Ellis, 11.625%, 15Jun17 United States 0.8%InfrastructureTop 5 Holdings Country WeightTransurban Group Australia 1.7%Atlantia SpA Italy 1.6%InToll Group Australia 1.5%FraPort AG Germany 1.5%Macquarie Airports Australia 1.1%Fund CodesMutual Fund Corporate Class Class T5 Class T8Class A Class F Class I Class A $US Class F $US Class I Class A Class F Class I Class A Class F Class IISC 619 4619 5619 2319 2519 4319 4519 5331 119T5 419T5 519T5 619T8 919T8 019T8LSC 1619 1319 1519 319T5 819T8DSC 819 3319 3519 219T5 719T8WINTER 2011 EARLY EDITION PERSPECTIVE AS AT DECEMBER 31, 2010 19
Tax-efficient investing at its best – Case studyBrian: The SituationBrian, age 40, has just inherited $100,000. Since he has maximized his RRSPand tax-free savings account, he plans to invest this money in a non-registeredaccount. Brian knows that any interest income generated by a non-registeredaccount will be taxed at his top marginal rate. Also, any other distributions hereceives – dividends or capital gains – will be taxed in the year they are declaredor received.The challengeTo find an investment solution for Brian that will providegrowth and help him to postpone paying tax on hisinvestment gains for as long as possible.Since Brian is investing for the long term, he wants: to be able to minimize or defer paying tax on annualdistributions the flexibility to rebalance his investments without causinga taxable disposition to be able to benefit from tax-free compounding growth,and a wide choice of investments.Brian plans to use his investment as a source of income whenhe retires.The strategyBrian’s advisor suggests investing the $100,000 in<strong>CI</strong> Corporate Class. His advisor explains that the corporatestructure can minimize or eliminate the payment of annualtaxable distributions. If he does receive an annual distribution,it will only be a Canadian dividend or a capital gains dividend– both of which receive preferential tax treatment.Brian and his advisor choose a balanced portfolio thatconsists of: $40,000 in <strong>CI</strong> Short-Term Corporate Class $20,000 in <strong>CI</strong> Emerging Markets Corporate Class, and $40,000 in Harbour Corporate Class.To illustrate the benefits of Corporate Class, we are going tocompare Brian’s portfolio with one made up of the mutualfund trust version of the same funds.20 WINTER 2011 EARLY EDITION PERSPECTIVE AS AT DECEMBER 31, 2010
The resultBetween June 1997 and August 2003, Brian’s portfolioperforms well. He incurs $2,676 in taxable distributions fromhis equity funds, but none from the income fund. His totaltax bill is $615. By comparison, the trust version of the sameportfolio generates more than $17,200 in distributions – abouthalf is highly taxed interest income. The tax bill on the trustportfolio is $5,940.In September 2003, Brian and his advisor choose torebalance his portfolio. He switches: <strong>CI</strong> Short-Term Corporate Class to Signature CorporateBond Corporate Class, for a higher potential return <strong>CI</strong> Emerging Markets Corporate Class to <strong>CI</strong> Global SmallCompanies Corporate Class, for greater diversification, and Harbour Corporate Class to Signature Select CanadianCorporate Class.In <strong>January</strong>, 2007, Brian rebalances his portfolio again.He switches: <strong>CI</strong> Global Small Companies Corporate Class back toHarbour Corporate Class, and continues to hold SignatureCorporate Bond Corporate Class and Signature SelectCanadian Corporate Class.Over the years, Brian’s portfolio of Corporate Class funds hasbenefited from the power of compounding and outperformedthe same portfolio of mutual fund trusts. More of his moneystayed invested and he has saved over $26,000 in income taxes.When he retires, Brian can create a regular cash flow with <strong>CI</strong>’sT-Class, which is based on Corporate Class. T-Class fundsmake regular payments in the form of non-taxable return ofcapital, allowing Brian to defer paying tax even longer.Thanks to the Corporate Class umbrella, Brian is able to makethese switches without incurring a taxable event.Corporate Class vs. Trust Performance$220,000$200,000Brian’sportfolio$203,407$180,000$160,000$140,000Trustportfolio$178,750$120,000$100,000$80,000June 97 98 99 00 01 02 03 04 05 06 07 08 09 June 10Source: Globe HySales, <strong>CI</strong> Investment ConsultingThis case study is based on the actual performance of <strong>CI</strong> Corporate Class and trust mutual funds from 1997 to 2010.Switches assume after-tax amount is reinvested in the new fund. Tax rate based on top marginal rate for Ontario of 46%.WINTER 2011 EARLY EDITION PERSPECTIVE AS AT DECEMBER 31, 2010 21
Signature Gold Corporate ClassSignature Gold Corporate ClassGold continues to be appreciated by investors because of its unique characteristics inproviding a store of value in times of crisis and a hedge against inflation. Now there isan easy and convenient way to invest in gold through Signature Gold Corporate Class. Itprovides the benefits of investing in gold, with the added advantages of <strong>CI</strong>’s tax-efficientCorporate Class structure.FOR ADVISOR USE ONLY22 WINTER 2011 EARLY EDITION PERSPECTIVE AS AT DECEMBER 31, 2010
Signature Gold Corporate ClassInvestment objective: To provide a secure, convenientalternative for investors seeking to hold gold for long-termcapital growth. The fund will invest primarily, directly orindirectly, in gold bullion and equity securities. The fundmay also invest, directly or indirectly, in silver, platinumand palladium.Portfolio Advisor: Signature Global AdvisorsLead Portfolio Manager: Scott Vali, CFA, LeadPortfolio Manager of Signature Canadian Resource Fundand Signature Global Energy Corporate ClassBenefits• convenient way to gain exposure to gold bullion, withan initial target of 50% of the portfolio invested in bullion• diversification because of gold’s low correlation to equitymarkets• gold can provide a hedge against inflation• part of the tax-efficient <strong>CI</strong> Corporate Class structure• additional diversification through holdings of equitysecurities of gold producers, with a focus on senior firms• potential additional exposure to bullion in other preciousmetals (silver, platinum and palladium) and equities ofcompanies producing those metals• active portfolio management by Signature Global Advisorsin determining the mix of investments.SuitabilityFor investors who:• seek exposure to the price of gold bullion and otherprecious metals• want portfolio diversification through an investment in thegold commodity• want additional diversification within <strong>CI</strong> Corporate Class• are concerned about equity market volatility or inflation,and want the stability provided by gold.The Signature AdvantageSignature Global Advisors manages core equity, balancedand income-oriented funds, and is <strong>CI</strong> <strong>Investments</strong>’ largestin-house portfolio management group. The team of24 investment professionals, led by Chief Investment OfficerEric Bushell, manages over $25 billion. Signature’s expertisehas been recognized by 11 Canadian Investment Awards inthe past nine years, including awards for Signature CanadianResource Fund in 2008 and 2009.Fund CodesClass A Class F Class IISC DSC LL ISC ISCSignature Gold Corporate Class 2378 3378 1378 4378 5378Signature Gold Corporate Class US$ 2379 3379 1379 4379 n/aISC DSC LLCommissions Class A 0-5% 5.0% 2.0%Annual trailer fees Class A 1.0% 0.5% fi rst 7 years, 0.5% fi rst 3 years,1.0% thereafter 1.0% thereafterManagement fees Class A: 2.0% Class F: 1.0%WINTER 2011 EARLY EDITION PERSPECTIVE AS AT DECEMBER 31, 2010 23
At a glanceContractIncome ClassOne contract covers all classes - Maximize benefits - Enhance client reportingContract maturity & death guarantees 75% at contract maturity (age 100) and 100% at death*Guaranteed Lifetime WithdrawalBenefit (GLWB)Withdrawals based on an age-tiered LWA Rate and income stream payment options:One-Life Income Stream – covers life of one individual. Income available at<strong>January</strong> 1 of the year the designated annuitant turns 65. Starts at 5% of the LWA Base.Two-Life Income Stream – covers lives of an annuitant and spouse, starting<strong>January</strong> 1 the year the younger spouse turns 65. Starts at 4.5% of LWA Base.See advisor guide for further information on LWA Rates and treatment of registered plans.5% Bonus 15 years from the initial investment, plus prorated in the first yearResets Death benefit – automatic on every third contract anniversary date until the annuitantreaches age 80, with a final reset at age 80.Guarantee flexibilityFunds available<strong>Investments</strong>Ability to bypass probateWaiving redemption fees upon deathGLWB resets occur on the third contract anniversary date and may increase the LWA Rate.Clients may switch classes to meet financial objectives without triggering a taxabledisposition, provided underlying fund stays the same. In some cases the guaranteesremain in place. Switch between Income and Estate Classes, without affecting theprincipal protection guarantees.44 funds, including Portfolio Series and SunWise Essential Bundlesup to 70% equityYesYesInitial deposit $25,000Minimum initial deposit per class of $100 ($50 PAC)a fundMinimum subsequent deposits $100 ($50 PAC)Maximum deposits None<strong>CI</strong> Private ManagedAssets programMinimum investment of $500,000, with $100,000 per asset class($5,000 subsequent deposits)Accounts serviced Open, RRSP, LIRA, LRSP, RRIF, LRIF, LIF, PRIF, RLIF, RLSP, TFSAAutomatic rebalancing YesSales commissions ISC: Up to 5%DSC: 5%Annual service fees ISC: 0%-0.25% on money market; 0.50% on other Income Funds(except Signature High Income & Signature Diversified Yield); 1.00% on other fundsDSC: 0% on money market; 0.25% on other Income Funds(except Signature High Income & Signature Diversified Yield); 0.50% on other fundsFund switches No charge (switches within 30 business days of deposit may be subject to an earlywithdrawal fee)24 WINTER 2011 EARLY EDITION PERSPECTIVE AS AT DECEMBER 31, 2010
Investment ClassSame as Income ClassEstate ClassSame as Income Class75% at contract maturity (age 100) and 75% at death* 75% at contract maturity (age 100) and 100% at death*Not availableNot availableNot availableNot availableSame as Income ClassNot availableDeath benefit – automatic on every third contract anniversarydate until the annuitant reaches age 80, with a final reset atage 80.Same as Income Class74 funds across all asset classes 47 funds, including Portfolio Series andSunWise Essential Bundlesup to 100% equityup to 70% equityYesYesYesYes$500 $500$500 ($50 PAC) $500 ($50 PAC)$100 ($50 PAC) $100 ($50 PAC)NoneNoneSame as Income ClassSame as Income ClassSame as Income ClassYesSame as Income ClassSame as Income ClassSame as Income ClassYesSame as Income ClassSame as Income ClassSame as Income ClassSame as Income ClassWINTER 2011 EARLY EDITION PERSPECTIVE AS AT DECEMBER 31, 2010 25
<strong>CI</strong> Sales TeamMike WarusSenior Vice-PresidentDerek J. GreenPresident, <strong>CI</strong> <strong>Investments</strong>dgreen@ci.comPatrick LefrançoisSenior Vice-PresidentRoy RatnavelSenior Vice-PresidentOntarioTEL: 416-364-1145 TOLL-FREE: 1-800-268-9374Mike Warus Senior Vice-President mwarus@ci.comKevin Bonello Vice-President kbonello@ci.comRon Bowes Vice-President rbowes@ci.comErick Boucher Vice-President eboucher@ci.comJason Capobianco Vice-President jcapobianco@ci.comSean Etherington Vice-President setherington@ci.comJeff Hobson Vice-President jhobson@ci.comRyan Keefe Vice-President rkeefe@ci.comCraig Koenig Vice-President ckoenig@ci.comPierre Lalonde Vice-President plalonde@ci.comAndrew McBain Vice-President amcbain@ci.comPeter Perri Vice-President pperri@ci.comMatthew Rose Vice-President mrose@ci.comAhmad Salehzadeh Vice-President asaleh@ci.comJennifer Sinopoli Vice-President jsinopoli@ci.comTim Skoubouris Vice-President tskoubouris@ci.comAlex Steele Vice-President asteele@ci.comDamon Sutherland Vice-President dsutherland@ci.comDavid Vigilanti Vice-President dvigilanti@ci.comSharad Appadoo Inside Sales sappadoo@ci.comTaylor Barrett Inside Sales tbarrett@ci.comAlexandra Katz Inside Sales akatz@ci.comDevendra Maharajh Inside Sales dmaharajh@ci.comChristopher Matugas Inside Sales smatugas@ci.comSarah Potosky Inside Sales spotosky@ci.comNathan Rothwell Inside Sales nrothwell@ci.comZoe Rutledge Inside Sales zrutledge@ci.comJosh Varghese Inside Sales jvarghese@ci.comCheryl Bemister Sales Assistant cbemister@ci.comTeresa Hasiuk Sales Assistant thasiuk@ci.comMichelle Kang Sales Assistant mkang@ci.comDebra MacPhail Sales Assistant dmacphail@ci.comMagda Mirecki Sales Assistant mmirecki@ci.comAlda Silva Sales Assistant asilva@ci.comMarion Tymburski Sales Assistant mtymburski@ci.comHalifax TOLL-FREE: 1-800-268-9374Patrick Lefrançois Senior Vice-President plefrancois@ci.comGreg Giffin Vice-President ggiffin@ci.comAndrew Lacas Vice-President alacas@ci.comCasey Walsh Vice-President cwalsh@ci.comDean Chong Inside Sales dechong@ci.comHeather Kennedy Sales Assistant hkennedy@ci.com<strong>CI</strong> Institutional Asset ManagementTEL: 416-364-1145 TOLL-FREE: 1-800-268-9374Chris Boyle Senior Vice-President cboyle@ci.comDustin Hunt Vice-President dhunt@ci.comMurray Jewell Vice-President mjewell@ci.comLauren Bloom Account Manager lbloom@ci.comErik Brandt Account Manager ebrandt@ci.comSarah Varley Account Manager svarley@ci.comNicolette Cutz Sales Assistant ncutz@ci.comVancouverTEL: 604-681-3346 TOLL-FREE: 1-800-665-6994Roy Ratnavel Senior Vice-President rratnavel@ci.comSean Hirtle Vice-President shirtle@ci.comVincent Nijjar Vice-President vnijjar@ci.comNeil Rawal Vice-President nrawal@ci.comTim Shrigley Vice-President tshrigley@ci.comJim Tsiakos Vice-President jtsiakos@ci.comVictor Young Vice-President vyoung@ci.comElijah Clare Inside Sales eclare@ci.comEric Mooney Inside Sales emooney@ci.comRosalind Salter Inside Sales rsalter@ci.comKristyne Melbarde Sales Assistant kmelbarde@ci.comJenny Obermeier Sales Assistant jobermeier@ci.comRicki Thal Sales Assistant rthal@ci.comCalgaryTEL: 403-205-4396 TOLL-FREE: 1-800-776-9027Roy Ratnavel Senior Vice-President rratnavel@ci.comJodie deMunnik Vice-President jdemunnik@ci.comTravis Jensen Vice-President tjensen@ci.comBill Johnstone Vice-President bjohnstone@ci.comStephen Mantrop Vice-President smantrop@ci.comJames Sturdy Vice-President jsturdy@ci.comBryce Walker Vice-President bwalker@ci.comScott Brown Inside Sales sbrown@ci.comHassan Chauhan Inside Sales hchauhan@ci.comJonathan Marusiak Inside Sales jmarusiak@ci.comKarla Piper Sales Assistant kpiper@ci.comEileen Soby Sales Assistant esoby@ci.comMontrealTEL: 514-875-0090 TOLL-FREE: 1-800-268-1602Patrick Lefrançois Senior Vice-President plefrancois@ci.comJacen Campbell Vice-President jcampbell@ci.comJoseph Gagliano Vice-President jgagliano@ci.comJeremy Gould Vice-President jgould@ci.comOlivier Liard Vice-President oliard@ci.comPeter Papamichalopoulos Vice-President papamichalopoulos@ci.comJacques Prévost Vice-President jprevost@ci.comRoberto Katigbak Inside Sales rkatigbak@ci.comLouis-Philippe Proulx Inside Sales lproulx@ci.comDiane Tremblay Inside Sales dtremblay@ci.comCarine Coursol Sales Assistant ccoursol@ci.comSamira Haikel Sales Assistant shaikel@ci.comMaritza Paredes Sales Assistant mparedes@ci.comHead Office2 Queen Street East, 20th Floor, Toronto, Ontario M5C 3G7Client Services: E-1-800-563-5181 F-1-800-668-3528www.ci.com26 WINTER 2011 EARLY EDITION PERSPECTIVE AS AT DECEMBER 31, 2010
All commentaries are published by <strong>CI</strong> <strong>Investments</strong> Inc., the manager ofall the funds described herein. They are provided as a general sourceof information and should not be considered personal investmentadvice or an offer or solicitation to buy or sell securities. Everyeffort has been made to ensure that the material contained in thecommentaries is accurate at the time of publication. However,<strong>CI</strong> <strong>Investments</strong> Inc. cannot guarantee their accuracy or completenessand accepts no responsibility for any loss arising from any use of orreliance on the information contained herein.Commissions, trailing commissions, management fees and expensesall may be associated with mutual fund investments. Please read theprospectus before investing. Unless otherwise indicated and exceptfor returns for periods less than one year, the indicated rates ofreturn are the historical annual compounded total returns includingchanges in security value. All performance data assume reinvestmentof all distributions or dividends and do not take into account sales,redemption, distribution or optional charges or income taxes payableby any securityholder that would have reduced returns. Returnsare for Class A securities, unless otherwise indicated. Mutualfunds are not guaranteed, their values change frequently and pastperformance may not be repeated. Mutual fund securities are notcovered by the Canada Deposit Insurance Corporation or by any othergovernment deposit insurer and there can be no assurances that the<strong>CI</strong> Money Market Funds will maintain its net asset value per securityat a constant amount or that the full amount of your investment inthese funds will be returned to you.Sun Life Assurance Company of Canada, a member of the Sun LifeFinancial group of companies, is the sole issuer of the individual variableannuity contract -providing for investment in SunWise Essential Seriessegregated funds. A description of the key features of the applicableindividual variable annuity contract is contained in the Information Folder.ANY AMOUNT THAT IS ALLOCATED TO A SEGREGATED FUND ISINVESTED AT THE RISK OF THE CONTRACT HOLDER AND MAYINCREASE OR DECREASE IN VALUE.®<strong>CI</strong> <strong>Investments</strong>, the <strong>CI</strong> <strong>Investments</strong> design, Perspective, SignatureGlobal Advisors, Synergy Mutual Funds, Harbour Advisors, HarbourFunds, Global Managers, American Managers, Insight and InsightProgram, Legacy Funds and <strong>CI</strong> Guaranteed Investment Funds areregistered trademarks of <strong>CI</strong> <strong>Investments</strong> Inc. Cambridge, Portfolio Select Series, Portfolio Series and SignatureFunds are trademarks of <strong>CI</strong> <strong>Investments</strong> Inc.®SunWise and Clarica are registered trademarks of Sun Life AssuranceCompany of Canada.WINTER 2011 EARLY EDITION PERSPECTIVE AS AT DECEMBER 31, 2010 27
Bringing you information you can use and share with your clients…With the tremendous popularity of the <strong>CI</strong> GET CONNECTED webcast series,we are pleased to offer an enhanced lineup in 2011:• webcasts twice a month with an executive summary the following week.• podcasts twice a month from selected portfolio managers.CE credits will be available for webcast participants.Watch for your e-mail invitations. If you are not on our e-mail listand would like to be, please contact your <strong>CI</strong> Sales Team.Webcast schedule:<strong>January</strong> 26February 9 • Daniel BubisMarch 9 • David PictonEric Bushell &Geof MarshallSignature Global AdvisorsTetrem Capital ManagementFebruary 23 • Stephen JenkinsHarbour AdvisorsFOR ADVISOR USE ONLYPicton MahoneyMarch 30 • Alan RadloCambridge Advisors1101-0078_E