January - Early Edition - CI Investments
January - Early Edition - CI Investments
January - Early Edition - CI Investments
- No tags were found...

Create successful ePaper yourself
Turn your PDF publications into a flip-book with our unique Google optimized e-Paper software.
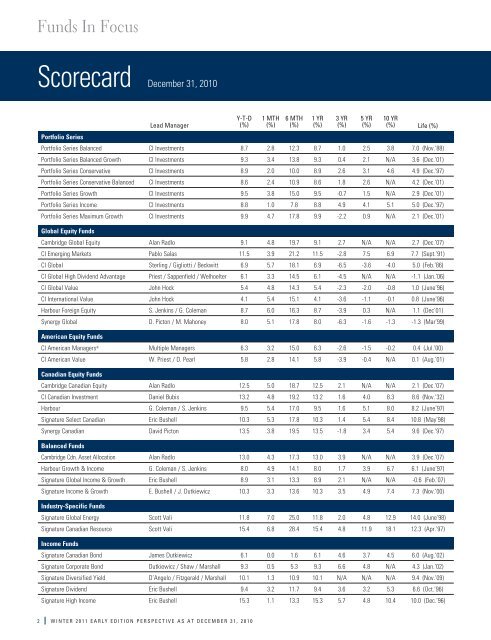
Funds In FocusScorecard December 31, 2010Portfolio SeriesLead ManagerY-T-D(%)1 MTH(%)6 MTH(%)1 YR(%)3 YR(%)5 YR(%)10 YR(%) Life (%)Portfolio Series Balanced <strong>CI</strong> <strong>Investments</strong> 8.7 2.8 12.3 8.7 1.0 2.5 3.8 7.0 (Nov.‘88)Portfolio Series Balanced Growth <strong>CI</strong> <strong>Investments</strong> 9.3 3.4 13.8 9.3 0.4 2.1 N/A 3.6 (Dec.’01)Portfolio Series Conservative <strong>CI</strong> <strong>Investments</strong> 8.9 2.0 10.0 8.9 2.6 3.1 4.6 4.9 (Dec.‘97)Portfolio Series Conservative Balanced <strong>CI</strong> <strong>Investments</strong> 8.6 2.4 10.9 8.6 1.8 2.6 N/A 4.2 (Dec.’01)Portfolio Series Growth <strong>CI</strong> <strong>Investments</strong> 9.5 3.8 15.0 9.5 -0.7 1.5 N/A 2.9 (Dec.’01)Portfolio Series Income <strong>CI</strong> <strong>Investments</strong> 8.8 1.0 7.8 8.8 4.9 4.1 5.1 5.0 (Dec.‘97)Portfolio Series Maximum Growth <strong>CI</strong> <strong>Investments</strong> 9.9 4.7 17.8 9.9 -2.2 0.9 N/A 2.1 (Dec.’01)Global Equity FundsCambridge Global Equity Alan Radlo 9.1 4.8 19.7 9.1 2.7 N/A N/A 2.7 (Dec.’07)<strong>CI</strong> Emerging Markets Pablo Salas 11.5 3.9 21.2 11.5 -2.8 7.5 6.9 7.7 (Sept.’91)<strong>CI</strong> Global Sterling / Gigliotti / Beckwitt 6.9 5.7 18.1 6.9 -6.5 -3.6 -4.0 5.0 (Feb.’86)<strong>CI</strong> Global High Dividend Advantage Priest / Sappenfield / Welhoelter 6.1 3.3 14.5 6.1 -4.5 N/A N/A -1.1 (Jan.’06)<strong>CI</strong> Global Value John Hock 5.4 4.8 14.3 5.4 -2.3 -2.0 -0.8 1.0 (June’96)<strong>CI</strong> International Value John Hock 4.1 5.4 15.1 4.1 -3.6 -1.1 -0.1 0.8 (June’96)Harbour Foreign Equity S. Jenkins / G. Coleman 8.7 6.0 16.3 8.7 -3.9 0.3 N/A 1.1 (Dec’01)Synergy Global D. Picton / M. Mahoney 8.0 5.1 17.8 8.0 -6.3 -1.6 -1.3 -1.3 (Mar’99)American Equity Funds<strong>CI</strong> American Managers ® Multiple Managers 6.3 3.2 15.0 6.3 -2.6 -1.5 -0.2 0.4 (Jul.’00)<strong>CI</strong> American Value W. Priest / D. Pearl 5.8 2.8 14.1 5.8 -3.9 -0.4 N/A 0.1 (Aug.’01)Canadian Equity FundsCambridge Canadian Equity Alan Radlo 12.5 5.0 18.7 12.5 2.1 N/A N/A 2.1 (Dec.’07)<strong>CI</strong> Canadian Investment Daniel Bubis 13.2 4.8 19.2 13.2 1.6 4.0 8.3 8.6 (Nov.‘32)Harbour G. Coleman / S. Jenkins 9.5 5.4 17.0 9.5 1.6 5.1 8.0 8.2 (June’97)Signature Select Canadian Eric Bushell 10.3 5.3 17.8 10.3 1.4 5.4 8.4 10.8 (May’98)Synergy Canadian David Picton 13.5 3.8 19.5 13.5 -1.8 3.4 5.4 9.6 (Dec.’97)Balanced FundsCambridge Cdn. Asset Allocation Alan Radlo 13.0 4.3 17.3 13.0 3.9 N/A N/A 3.9 (Dec.’07)Harbour Growth & Income G. Coleman / S. Jenkins 8.0 4.9 14.1 8.0 1.7 3.9 6.7 6.1 (June’97)Signature Global Income & Growth Eric Bushell 8.9 3.1 13.3 8.9 2.1 N/A N/A -0.6 (Feb.’07)Signature Income & Growth E. Bushell / J. Dutkiewicz 10.3 3.3 13.6 10.3 3.5 4.9 7.4 7.3 (Nov.’00)Industry-Specific FundsSignature Global Energy Scott Vali 11.8 7.0 25.0 11.8 2.0 4.8 12.9 14.0 (June’98)Signature Canadian Resource Scott Vali 15.4 6.8 28.4 15.4 4.8 11.9 18.1 12.3 (Apr.’97)Income FundsSignature Canadian Bond James Dutkiewicz 6.1 0.0 1.6 6.1 4.6 3.7 4.5 6.0 (Aug.’02)Signature Corporate Bond Dutkiewicz / Shaw / Marshall 9.3 0.5 5.3 9.3 6.6 4.8 N/A 4.3 (Jan.’02)Signature Diversified Yield D’Angelo / Fitzgerald / Marshall 10.1 1.3 10.9 10.1 N/A N/A N/A 9.4 (Nov.’09)Signature Dividend Eric Bushell 9.4 3.2 11.7 9.4 3.6 3.2 5.3 6.6 (Oct.’96)Signature High Income Eric Bushell 15.3 1.1 13.3 15.3 5.7 4.8 10.4 10.0 (Dec.’96)2 WINTER 2011 EARLY EDITION PERSPECTIVE AS AT DECEMBER 31, 2010