January - Early Edition - CI Investments
January - Early Edition - CI Investments
January - Early Edition - CI Investments
- No tags were found...

You also want an ePaper? Increase the reach of your titles
YUMPU automatically turns print PDFs into web optimized ePapers that Google loves.
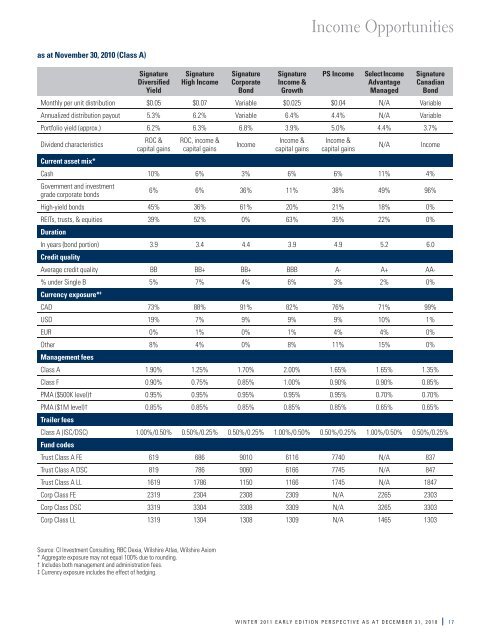
Income Opportunitiesas at November 30, 2010 (Class A)SignatureDiversifiedYieldSignatureHigh IncomeSignatureCorporateBondSignatureIncome &GrowthPS IncomeSelect IncomeAdvantageManagedSignatureCanadianBondMonthly per unit distribution $0.05 $0.07 Variable $0.025 $0.04 N/A VariableAnnualized distribution payout 5.3% 6.2% Variable 6.4% 4.4% N/A VariablePortfolio yield (approx.) 6.2% 6.3% 6.8% 3.9% 5.0% 4.4% 3.7%Dividend characteristicsCurrent asset mix*ROC &capital gainsROC, income &capital gainsIncomeIncome &capital gainsIncome &capital gainsCash 10% 6% 3% 6% 6% 11% 4%Government and investmentgrade corporate bonds6% 6% 36% 11% 38% 49% 96%High-yield bonds 45% 36% 61% 20% 21% 18% 0%REITs, trusts, & equities 39% 52% 0% 63% 35% 22% 0%DurationIn years (bond portion) 3.9 3.4 4.4 3.9 4.9 5.2 6.0Credit qualityAverage credit quality BB BB+ BB+ BBB A- A+ AA-% under Single B 5% 7% 4% 6% 3% 2% 0%Currency exposure* ‡CAD 73% 88% 91% 82% 76% 71% 99%USD 19% 7% 9% 9% 9% 10% 1%EUR 0% 1% 0% 1% 4% 4% 0%Other 8% 4% 0% 8% 11% 15% 0%Management feesClass A 1.90% 1.25% 1.70% 2.00% 1.65% 1.65% 1.35%Class F 0.90% 0.75% 0.85% 1.00% 0.90% 0.90% 0.85%PMA ($500K level)† 0.95% 0.95% 0.95% 0.95% 0.95% 0.70% 0.70%PMA ($1M level)† 0.85% 0.85% 0.85% 0.85% 0.85% 0.65% 0.65%Trailer feesClass A (ISC/DSC) 1.00%/0.50% 0.50%/0.25% 0.50%/0.25% 1.00%/0.50% 0.50%/0.25% 1.00%/0.50% 0.50%/0.25%Fund codesTrust Class A FE 619 686 9010 6116 7740 N/A 837Trust Class A DSC 819 786 9060 6166 7745 N/A 847Trust Class A LL 1619 1786 1150 1166 1745 N/A 1847Corp Class FE 2319 2304 2308 2309 N/A 2265 2303Corp Class DSC 3319 3304 3308 3309 N/A 3265 3303Corp Class LL 1319 1304 1308 1309 N/A 1465 1303N/AIncomeSource: <strong>CI</strong> Investment Consulting, RBC Dexia, Wilshire Atlas, Wilshire Axiom* Aggregate exposure may not equal 100% due to rounding.† Includes both management and administration fees.‡ Currency exposure includes the effect of hedging.WINTER 2011 EARLY EDITION PERSPECTIVE AS AT DECEMBER 31, 2010 17