Lower Byersville Creek Flood-Risk Mapping Update - City of ...
Lower Byersville Creek Flood-Risk Mapping Update - City of ...
Lower Byersville Creek Flood-Risk Mapping Update - City of ...
- No tags were found...

Create successful ePaper yourself
Turn your PDF publications into a flip-book with our unique Google optimized e-Paper software.
EXCELLENCE INENVIRONMENTALCONSULTINGSERVICESXCG File No.: 3-2087-09-01August 11, 2010LOWER BYERSVILLE CREEKFLOOD-RISK MAPPING UPDATEPrepared for:CITY OF PETERBOROUGH500 George Street NorthPeterborough, OntarioK9H 3R9Attention: Mr. Bruno Bianco, P.Eng.Prepared by:XCG CONSULTANTS LTD.2620 Bristol CircleSuite 300Oakville, OntarioL6H 6Z7XCG Consultants Ltd.300-2620 Bristol CircleOakville, ONCanadaL6H 6Z7Tel: (905) 829-8880Fax: (905) 829-8890E-mail:toronto@xcg.com3-2087-09-01/R_3-04108226_<strong>Byersville</strong> <strong>Creek</strong>_<strong>Mapping</strong> <strong>Update</strong>_FINAL08/11/10
<strong>City</strong> <strong>of</strong> Peterborough<strong>Lower</strong> <strong>Byersville</strong> <strong>Creek</strong> <strong>Flood</strong>-<strong>Risk</strong> <strong>Mapping</strong> <strong>Update</strong>TABLE OF CONTENTSTABLE OF CONTENTS1. INTRODUCTION.............................................................................................................1-11.1 Background.....................................................................................................1-11.2 Scope <strong>of</strong> This Report ......................................................................................1-42. STUDY METHOD ...........................................................................................................2-12.1 Information Gathering....................................................................................2-12.1.1 Existing Base <strong>Mapping</strong>................................................................................ 2-12.1.2 Digital Elevation Model .............................................................................. 2-12.1.3 Photo Evidence <strong>of</strong> Surface <strong>Flood</strong>ing in 2004 .............................................. 2-12.1.4 Existing Hydraulic Models (HEC-RAS) ...................................................... 2-22.1.5 Lansdowne Place Site Grading ................................................................... 2-22.1.6 Costco Development Site Grading............................................................... 2-32.1.7 Visitors Center Site Grading ....................................................................... 2-32.2 Site Investigations ..........................................................................................2-32.2.1 Survey <strong>of</strong> Local Residents............................................................................ 2-32.2.2 Ground Survey............................................................................................. 2-42.3 <strong>Update</strong> <strong>of</strong> Hydrologic/Flow Routing Model ..................................................2-62.3.1 Background and Approach.......................................................................... 2-62.3.2 Scope <strong>of</strong> PCSWMM Model <strong>Update</strong>.............................................................. 2-72.4 Extension <strong>of</strong> HEC-RAS Models.....................................................................2-82.4.1 Review <strong>of</strong> Existing HEC-RAS Model ........................................................... 2-82.4.2 Model Extension South <strong>of</strong> Former CNR Line .............................................. 2-82.4.3 <strong>Update</strong> to Main Stem Model: CPR Culverts................................................ 2-82.4.4 Integrated Application <strong>of</strong> the HEC-RAS Models ......................................... 2-93. RESULTS OF ANALYSIS.................................................................................................3-13.1 Model Performance Assessment ....................................................................3-13.1.1 Rainfall Input to Model................................................................................ 3-13.1.2 Model Representation <strong>of</strong> July 14-15, 2004 Event........................................ 3-13.1.3 Flows Computed By PCSWMM Model........................................................ 3-33.1.4 <strong>Mapping</strong> <strong>of</strong> Surface <strong>Flood</strong>ing Using HEC-RAS .......................................... 3-33.2 Regional Storm Event.....................................................................................3-53.2.1 Rainfall Input to Model................................................................................ 3-53.2.2 Flows Computed by PCSWMM Model........................................................ 3-53.2.3 <strong>Mapping</strong> <strong>of</strong> Surface <strong>Flood</strong>ing Using HEC-RAS: Existing System............... 3-63.2.4 <strong>Mapping</strong> <strong>of</strong> Surface <strong>Flood</strong>ing Using HEC-RAS: Proposed CulvertModifications ............................................................................................................ 3-74. LIMITATIONS OF ANALYSIS..........................................................................................4-14.1 Limitations <strong>of</strong> Modelling Approach...............................................................4-14.2 Base <strong>Mapping</strong>.................................................................................................4-15. RECOMMENDATIONS............................................................................................5-15.1 <strong>Flood</strong>-<strong>Risk</strong> <strong>Mapping</strong> <strong>Update</strong> ..........................................................................5-15.2 Implementation Priorities for <strong>Byersville</strong> <strong>Creek</strong> <strong>Flood</strong> Reduction:.................5-15.3 Additional Recommended Measures..............................................................5-16. REFERENCES CITED .....................................................................................................6-1i3-2087-09-01/R_3-04108226_<strong>Byersville</strong> <strong>Creek</strong>_<strong>Mapping</strong> <strong>Update</strong>08/11/10
<strong>City</strong> <strong>of</strong> Peterborough<strong>Lower</strong> <strong>Byersville</strong> <strong>Creek</strong> <strong>Flood</strong>-<strong>Risk</strong> <strong>Mapping</strong> <strong>Update</strong>TABLE OF CONTENTSTABLESTable 2.1Table 3.1HEC-RAS models obtained from ORCA.......................................................2-2Comparison <strong>of</strong> rainfall <strong>of</strong> July 14-15, 2004 over <strong>Byersville</strong> <strong>Creek</strong>with Zone 3 Regulatory event .......................................................................3-5FIGURESFigure 1.1 <strong>Flood</strong> <strong>Risk</strong> <strong>Mapping</strong> <strong>Update</strong>d to 2003 (as supplied by ORCA).....................1-2Figure 1.2 Examiner Ditch...............................................................................................1-2Figure 1.2 Examiner Ditch...............................................................................................1-3Figure 2.1 Pattern <strong>of</strong> Surface <strong>Flood</strong>ing During July 2004 Event ....................................2-5Figure 3.1 Rainfall <strong>of</strong> July 14-15, 2004 over <strong>Byersville</strong> <strong>Creek</strong> Watershed.....................3-2Figure 3.2 <strong>Mapping</strong> <strong>of</strong> Surface <strong>Flood</strong>ing Based on Model Results for July 2004 Event(Modelling "Case 3" - with CNR washouts and 60% blockage at ErskineAvenue pipe inlet) ..........................................................................................3-4Figure 3.3 <strong>Mapping</strong> <strong>of</strong> Surface <strong>Flood</strong>ing, Regional Storm: Case 1 - Existing SystemConditions, with no washout at former CNR and no inlet blockage atExaminer Ditch inlet to Erskine Avenue storm sewer ...................................3-9Figure 3.4 <strong>Mapping</strong> <strong>of</strong> Surface <strong>Flood</strong>ing, Regional Storm: Case 4 - Same as Case 1,but with the twin 2.0-m culverts under the CPR east <strong>of</strong> The Parkwayreplaced with a single 1.0-m culvert.............................................................3-10APPENDICESAppendix A Photos <strong>of</strong> July 2004 event, as Supplied by ORCAAppendix B Hand-out Questionnaire Delivered to Local Residences in February 2010Appendix C <strong>Update</strong> <strong>of</strong> PCSWMM Model (Hydrology and Flow Routing)Appendix D HEC-RAS Model Details3-2087-09-01/R_3-04108226_<strong>Byersville</strong> <strong>Creek</strong>_<strong>Mapping</strong> <strong>Update</strong>08/11/10ii
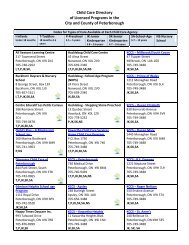
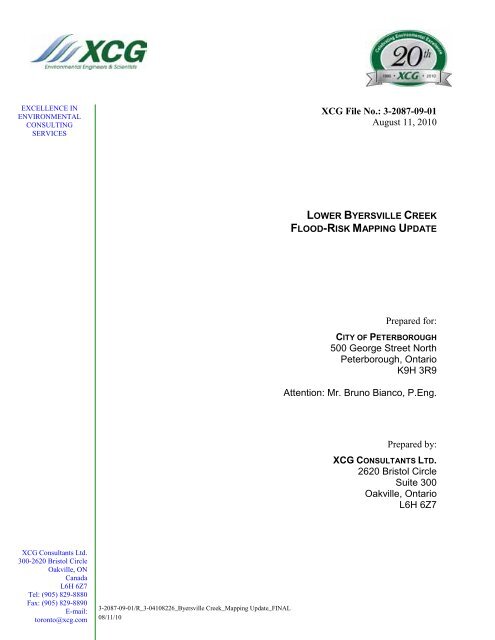
<strong>City</strong> <strong>of</strong> Peterborough<strong>Lower</strong> <strong>Byersville</strong> <strong>Creek</strong> <strong>Flood</strong>-<strong>Risk</strong> <strong>Mapping</strong> <strong>Update</strong>INTRODUCTION1. INTRODUCTIONXCG Consultants Limited (XCG) was retained by the <strong>City</strong> <strong>of</strong> Peterborough (<strong>City</strong>) todevelop an update to flood-risk mapping for the portion <strong>of</strong> <strong>Byersville</strong> <strong>Creek</strong>watershed that lies south <strong>of</strong> Lansdowne Street West.1.1 Background<strong>Flood</strong>-risk mapping for <strong>Byersville</strong> <strong>Creek</strong> was first completed in 1991 (Totten SimsHubicki and Marshall Macklin Monaghan, 1991).<strong>Update</strong>s were carried out in subsequent years, resulting in updated flood-riskmapping completed in 2003.The extent <strong>of</strong> the flood-risk area mapped as <strong>of</strong> 2003 is shown on Figure 1.1. Thisfigure was prepared based on a consolidated mapping layer supplied to XCG byOtonabee Region Conservation Authority in 2007.The 1991 mapping and the subsequent updates indicated a flow “spill” from themain channel <strong>of</strong> <strong>Byersville</strong> <strong>Creek</strong> below Lansdowne Street West and east <strong>of</strong> TheParkway, via twin CSP culverts under the CPR rail line located approximately 160metres east <strong>of</strong> The Parkway. The spill arrows shown on the 1991 mapping (MapSheet 27B) indicate that the spill flow would travel southward along what is referredto in this report as the “Examiner Ditch” which flows southward past thePeterborough Examiner building at 730 The Kingsway, under the Kingsway andthen to The Queensway and ultimately to the north side <strong>of</strong> the former CNR line, thenentering into a storm sewer inlet at Erskine Avenue. See Figure 1.2.The 1991 flood-risk mapping and subsequent updates did not delineate the area <strong>of</strong>surface flooding that could result from this spill.In 2009, the <strong>Byersville</strong>/Harper <strong>Creek</strong> <strong>Flood</strong> Reduction Study was completed (seeXCG Consultants report to <strong>City</strong> <strong>of</strong> Peterborough, April 27, 2009). This studyexamined flood-reduction alternatives for the watershed as a whole, in response tothe extensive flooding that had occurred during the rainstorm <strong>of</strong> July 14-15, 2004.The <strong>Flood</strong> Reduction Study included development <strong>of</strong> a hydraulic model that allowedfor mapping <strong>of</strong> potential surface flooding area due to the spill flows along theExaminer Ditch, as far south as the former CNR line (now a recreational pathway).This analysis revealed that the extent <strong>of</strong> surface flooding during the Regional Stormevent (the “Timmins” event) could be extensive. This was consistent with the factthat the area had reportedly experienced significant surface flooding in the 2004event.Subsequently, flood-risk mapping was prepared for the Examiner Ditch by D.M.Wills Associates. This mapping has been accepted by Otonabee RegionConservation Authority as is currently being used to assist with regulating land usewithin the flood-risk area.3-2087-09-01/R_3-04108226_<strong>Byersville</strong> <strong>Creek</strong> <strong>Mapping</strong> <strong>Update</strong> 1-108/11/10
<strong>City</strong> <strong>of</strong> Peterborough<strong>Lower</strong> <strong>Byersville</strong> <strong>Creek</strong> <strong>Flood</strong>-<strong>Risk</strong> <strong>Mapping</strong> <strong>Update</strong>INTRODUCTIONFigure 1.1<strong>Flood</strong> <strong>Risk</strong> <strong>Mapping</strong> <strong>Update</strong>d to 2003 (as supplied by ORCA)3-2087-09-01/R_3-04108226_<strong>Byersville</strong> <strong>Creek</strong> <strong>Mapping</strong> <strong>Update</strong> 1-208/11/10
R AVERSKINE AV!(!(!(!(!(LANSDOWNE!(!(!(!(!(!(!(!(!(!(!(!(!(Figure 1.2Location <strong>of</strong> Examiner Ditch!(Low Point on RoadwayApprox. 194.6m!(!(<strong>Byersville</strong> <strong>Creek</strong>The Parkway!(!(Pond#CPR Rail Line"Spill" Arrows Indicated on1991 <strong>Flood</strong> <strong>Risk</strong> <strong>Mapping</strong>Twin 2.0mCSP culverts"Spill" Arrows Indicated on1991 <strong>Flood</strong> <strong>Risk</strong> <strong>Mapping</strong>THE KINGSWAYExaminer DitchTwin 1.2m culverts#THE QUEENSWAY!(!(!(!(!(!(!(!(!(!(!(!(!( !(BORDEN AVPipe Stub Inlet to Erskine AvenueStorm Sewer (see photo in Appendix C)!(!(!(!(!(CROWN DRKINGSWAY CT!(!(!(!(!(Twin 1.5m culverts!(!(Examiner Ditch!(!(!(!(!(!(!(!(!(CAMERON PLQUEENSWAY CTFORMER CNR LINE (now a paved pathway)!(!(ORPINGTON RDCAMERON ST!(!(!(!(!(!(!(!(!(!(!(
<strong>City</strong> <strong>of</strong> Peterborough<strong>Lower</strong> <strong>Byersville</strong> <strong>Creek</strong> <strong>Flood</strong>-<strong>Risk</strong> <strong>Mapping</strong> <strong>Update</strong>INTRODUCTIONA remaining concern is that the mapping presented in the 2009 <strong>Flood</strong> ReductionStudy may not fully represent the flood-risk potential south <strong>of</strong> the recreationalpathway, in the area <strong>of</strong> Mountain Ash Road, Orpington Road, Cameron Street,Erskine Avenue, and vicinity. This area did experience significant surface floodingduring the 2004 event. One concern was that this surface flooding may not havebeen due only to local drainage systems becoming overwhelmed during the 2004event, but that the extent <strong>of</strong> flooding may have in part been due to surface flowovertop the recreational pathway (former CNR line).1.2 Scope <strong>of</strong> This ReportAt the <strong>City</strong>’s request, XCG has undertaken an update to the Regulatory flood-riskmapping for the portion <strong>of</strong> <strong>Byersville</strong> <strong>Creek</strong> that lies south <strong>of</strong> Lansdowne StreetWest.As described in this report, this update has been based on using availableinformation complemented by some limited additional investigations. The HEC-RAS hydraulic models previously developed for the main stem <strong>of</strong> <strong>Byersville</strong> <strong>Creek</strong>and for the Examiner Ditch have been employed. Additional HEC-RAS modellinghas been carried out to allow for flood-risk mapping south <strong>of</strong> the recreationalpathway.3-2087-09-01/R_3-04108226_<strong>Byersville</strong> <strong>Creek</strong> <strong>Mapping</strong> <strong>Update</strong> 1-408/11/10
<strong>City</strong> <strong>of</strong> Peterborough<strong>Lower</strong> <strong>Byersville</strong> <strong>Creek</strong> <strong>Flood</strong>-<strong>Risk</strong> <strong>Mapping</strong> <strong>Update</strong>STUDY METHOD2. STUDY METHOD2.1 Information Gathering2.1.1 Existing Base <strong>Mapping</strong>XCG acquired from the <strong>City</strong> geo-referenced base mapping that includes• Buildings• Roadways, including road curb lines• Additional planimetric features such as watercourses and surface drainagefeatures• Property boundaries (i.e. parcel fabric)Information supplied by the <strong>City</strong> indicates that the planimetric features mapping wasderived from aerial photography taken in May 2005.The mapping also included topographic contours at 0.25-m elevation intervals, asdeveloped from the <strong>City</strong>’s digital elevation model (see below).The <strong>City</strong> also supplied digital aerial photography taken in 2008 by Ontario Ministry<strong>of</strong> Natural Resources.2.1.2 Digital Elevation ModelXCG also acquired from the <strong>City</strong> the most recent digital elevation model (DEM).The DEM was developed for the <strong>City</strong> based on aerial photography taken in 2005.The <strong>City</strong> advised that the DEM vertical precision is 0.25 metres. Documentationprovided by the <strong>City</strong> related to the interpretation <strong>of</strong> the aerial photographs, indicatesthat the raw elevation information from which the DEM was developed has averagevertical elevation error <strong>of</strong> 0.16 m (per report to <strong>City</strong> <strong>of</strong> Peterborough by OSIGeomatics, 2005).The 0.25-m precision <strong>of</strong> the available topographic mapping is consistent withtechnical guidelines for floodplain mapping that have previously been published bythe Ontario Ministry <strong>of</strong> Natural Resources ("<strong>Flood</strong> Plain Management in Ontario:Technical Guidelines" , section "J - Surveys and <strong>Mapping</strong> Procedures for <strong>Flood</strong>plain<strong>Mapping</strong>", Ont. Ministry <strong>of</strong> Natural Resources, 1986).2.1.3 Photo Evidence <strong>of</strong> Surface <strong>Flood</strong>ing in 2004In 2005, J.W. Merriam & Associates had prepared a report to ORCA providingavailable photographic evidence <strong>of</strong> surface flooding and high-water elevations thatoccurred in the <strong>Byersville</strong> <strong>Creek</strong> watershed during the July 2004 event.For the portion <strong>of</strong> <strong>Byersville</strong> <strong>Creek</strong> watershed <strong>of</strong> interest, the Merriam report <strong>of</strong> 2005provide only limited information, indicating that there was surface flooding onErskine Avenue, Crawford Drive and Mountain Ash Road.3-2087-09-01/R_3-04108226_<strong>Byersville</strong> <strong>Creek</strong> <strong>Mapping</strong> <strong>Update</strong> 2-108/11/10
<strong>City</strong> <strong>of</strong> Peterborough<strong>Lower</strong> <strong>Byersville</strong> <strong>Creek</strong> <strong>Flood</strong>-<strong>Risk</strong> <strong>Mapping</strong> <strong>Update</strong>STUDY METHODIn late 2009 and 2010, ORCA staff were able to supply some additionalphotographic evidence <strong>of</strong> flooding that had occurred on Orpington Road, nearErskine Avenue and The Kingsway, and at the mouth <strong>of</strong> <strong>Byersville</strong> <strong>Creek</strong>. SeeAppendix A.2.1.4 Existing Hydraulic Models (HEC-RAS)The existing HEC-RAS models were acquired from ORCA. The following modelswere acquired:Table 2.1ModelHEC-RAS models obtained from ORCANotes on source<strong>Byersville</strong> <strong>Creek</strong> main stem, fromClonsilla Avenue down to the outlet tothe Otonabee RiverThis is the HEC-RAS model developed from the original 1991 HEC-2 model, with subsequent updates, including final update to 2003 byGreenland Engineering. This 2003 updated model was set up tooperate in HEC-RAS “unsteady mode” to provide dynamic routing<strong>of</strong> flow hydrographs.Examiner Ditch HEC-RAS model developed by D.M. Wills & Associates in 2009,covering the Examiner ditch from the CPR line down to the ErskineAvenue storm sewer inlet.Examiner Ditch West Spill modelHEC-RAS model developed by D.M. Wills & Associates in 2009 asa complement to the above model. This “side spill” model providesmapping for flooded area due to flow southwestward along the northside <strong>of</strong> the former CNR line. This flow would result from flow alongthe Examiner Ditch splitting to go two ways, at the 90o bend atwhich the ditch turns to go northeastward to the Erskine Avenuestorm sewer inlet.2.1.5 Lansdowne Place Site GradingThe D.M. Wills flood-risk mapping indicated the potential for the flood-risk area toextend onto the Lansdowne Place property.There has been recent alteration to this property in connection with expanding thecommercial building. XCG was supplied with a paper copy <strong>of</strong> the site grading anddrainage plan ("Lansdowne Place Re-Development, Site Grading Plan, Project No.04199, Drawing No. SW-G", dated December 2005, prepared by CounterpointEngineering Inc., for 20 VIC Developments Inc.).The digital elevation model supplied by the <strong>City</strong> does not represent this recentproperty development, since the DEM was developed based on aerial photographytaken in May 2005.Using the site grading plan, XCG has manually digitized and georeferenced anumber <strong>of</strong> elevation points to represent the current development, and this has beenpatched into the DEM to update the representation <strong>of</strong> this property parcel in the basemap used to develop the updated flood-risk map.3-2087-09-01/R_3-04108226_<strong>Byersville</strong> <strong>Creek</strong> <strong>Mapping</strong> <strong>Update</strong> 2-208/11/10
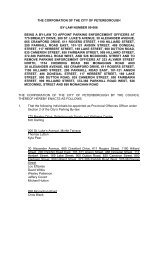
<strong>City</strong> <strong>of</strong> Peterborough<strong>Lower</strong> <strong>Byersville</strong> <strong>Creek</strong> <strong>Flood</strong>-<strong>Risk</strong> <strong>Mapping</strong> <strong>Update</strong>STUDY METHOD2.1.6 Costco Development Site GradingThe digital elevation model supplied to the <strong>City</strong> also does not reflect the current sitegrading on the recently developed Costco property on The Parkway east <strong>of</strong> CrawfordDrive.The <strong>City</strong> supplied XCG with a scanned copy <strong>of</strong> the this development's site gradingplan (Site grading plan prepared by MMM Group, dated February 13, 2008, Drawingnumber SG1, MMM Project Number 10-03064).As done for Lansdowne Place, XCG has manually digitized and georeferenced anumber <strong>of</strong> elevation points from this site grading plan, and this has been patched intothe DEM to update the representation <strong>of</strong> this property parcel in the base map used todevelop the updated flood-risk map.2.1.7 Visitors Center Site GradingThe digital elevation model supplied to the <strong>City</strong> also does not reflect the current sitegrading on the recently developed Visitors Center/Tim Horton's site locatedimmediately northwest <strong>of</strong> the intersection <strong>of</strong> Crawford Drive and The Parkway.The <strong>City</strong> supplied XCG with a scanned copy <strong>of</strong> the this development's site gradingplan (Site grading plan prepared by D.M. Wills Associates Limited, dated February11, 2009, Drawing number 1917SS01, D.M. Wills project No. 05-1917), stampedwith <strong>City</strong> site plan approval dated April 15, 2009.XCG has manually digitized and georeferenced a number <strong>of</strong> elevation points fromthis site grading plan, and this has been patched into the DEM to update therepresentation <strong>of</strong> this property parcel in the base map used to develop the updatedflood-risk map.2.2 Site Investigations2.2.1 Survey <strong>of</strong> Local ResidentsOn February 10, 2010, a hand-out questionnaire was distributed to approximately250 residences along Orpington Road, Cameron Street, Mountain Ash Road, ErskineAvenue, Roger Road and Barnes Crescent. The purpose was to obtain any availableadditional information from residents about where surface flooding occurred andwhere water flowed during the flood event <strong>of</strong> July 14-15, 2004.Appendix B provides a copy <strong>of</strong> the questionnaire that was handed out, and a mapshowing where it was distributed.A total <strong>of</strong> 13 responses were obtained. These provided some useful information. Inparticular, a number <strong>of</strong> respondents indicated that flow did occur over top <strong>of</strong> theformer CNR line and that in fact there had been some wash-out <strong>of</strong> the embankmentin the vicinity <strong>of</strong> Orpington Road and at the end <strong>of</strong> Cameron Street.The responses were used to develop a better picture <strong>of</strong> what happened in the areaduring the July 2004 event.3-2087-09-01/R_3-04108226_<strong>Byersville</strong> <strong>Creek</strong> <strong>Mapping</strong> <strong>Update</strong> 2-308/11/10
<strong>City</strong> <strong>of</strong> Peterborough<strong>Lower</strong> <strong>Byersville</strong> <strong>Creek</strong> <strong>Flood</strong>-<strong>Risk</strong> <strong>Mapping</strong> <strong>Update</strong>STUDY METHODFigure 2.1 summarizes the information that has been gathered to date regardingwhere surface flooding and surface flow was observed within the watershed area thatlies southeast <strong>of</strong> the former CNR rail line.Note that Figure 2.1 does not depict all <strong>of</strong> the surface flooding or surface pondingthat may have occurred during the July 14-15, 2004 event, especially at the peak <strong>of</strong>the event which occurred in the pre-dawn hours <strong>of</strong> July 15, 2004. Figure 2.1 depictsonly locations and directions <strong>of</strong> surface flooding that are known, based on directevidence from available photographs and from the recent questionnaire survey <strong>of</strong>local residents (Appendix B) which included a map that allowed respondents to markup locations <strong>of</strong> observed surface flow and flooding.2.2.2 Ground SurveyBeninger Surveying <strong>of</strong> Peterborough was retained by XCG to carry out groundsurvey at selected locations that were considered as potentially critical indetermining where surface flows may travel and what depth <strong>of</strong> flooding might result.The ground survey work was carried out in early March 2010, and included thefollowing:• Centreline elevation pr<strong>of</strong>ile along the recreational pathway (former CNR line)between Erskine Avenue and Crawford Drive.• Cross-section across the recreational pathway and to the north, in the vicinity <strong>of</strong>Orpington Road, to assist with determining flow directions at the 90-degree bendin the Examiner Ditch.• Elevation <strong>of</strong> culvert under the recreational pathway near northwest corner <strong>of</strong>Master Brand Cabinets industrial building.• Typical road sections and centreline pr<strong>of</strong>iles along Orpington Road, CameronStreet, Mountain Ash Road, and Erskine Avenue south <strong>of</strong> Hawley Street.The survey data were all referenced to the <strong>City</strong>’s geo-coordinate system.3-2087-09-01/R_3-04108226_<strong>Byersville</strong> <strong>Creek</strong> <strong>Mapping</strong> <strong>Update</strong> 2-408/11/10
WEBBER AVSTMOUNTAIN ASH RDROBERT RDERSKINE AVBARNES CRSURVEY STEDISON AST CATHERINE STFigure 2.1Location <strong>of</strong> Observed Surface <strong>Flood</strong>ingSouth <strong>of</strong> Former C.N.R. Line,July 2004 <strong>Flood</strong> EventFTHE PARKWAY600mm Surface <strong>Flood</strong>ingin Parking LotSurface <strong>Flood</strong>ing<strong>of</strong> YardKINGSWAY CTCROWN DRTHE KINGSWAYWashout <strong>of</strong> Rail BedReported to be8 Feet Wide by 4 Feet DeepWashout at Cameron St.Reported to be 30"Below TracksCAMERON PL2 FeetFlow DepthMasterBrandCabinetsQUEENSWAY CT!!EXAMINER DITCH!!!!THE QUEENSWAY!Recreational Pathway (Former CNR Line)!!!Water Depth2.5 to 3 Feetat Centre <strong>of</strong>Robert Rd.!CRAWFORD DRBORDEN AV5 Feet <strong>of</strong> Ponding3 to 4 FeetDepth on RoadLegend!MCKELLAR STGILLESPIE AVORPINGTON RD18 to 20 Inches PondingDepth at IntersectionGrovePublicSchoolCAMERON STBARBARA CRBELLAIRE STCRAWFORD PLDirection <strong>of</strong> Surface Flow as Reportedby Questionnaire RespondentsRespondents to Questionnaire<strong>of</strong> February 2010Locations <strong>of</strong> Overtopping and Washout <strong>of</strong>Former CNR Rail Embankmentfrom Questionnaire RespondentsApproximate Extent <strong>of</strong> Surface Ponding andRoadway <strong>Flood</strong>ing Based onAvailable Photos & Questionnaire ResponsesSHIRLEY AVHAWLEY STLITTLE STKenner CollegiateVocational InstituteHAROLD PLHAROLD DRMONAGHAN RDSPRUCE AVBRAIDWOOD AVKING GEORGE STNote:This figure does not depict full extent <strong>of</strong>surface flooding, but only the extent andlocations known through available photosor questionnaire responses.HOWDEN STSTEELE AVRIVERSIDE DRARCHIBALD AVROSE AMyersTransport3.5 Feet Flow Depth onCrawford at Robert Rd.!STOCKER RD!BYERSVILLE CREEK0 75 150 3007 & 115 HYFlow From <strong>Creek</strong>onto Stock Rd.MetresJOHNSTON DR
<strong>City</strong> <strong>of</strong> Peterborough<strong>Lower</strong> <strong>Byersville</strong> <strong>Creek</strong> <strong>Flood</strong>-<strong>Risk</strong> <strong>Mapping</strong> <strong>Update</strong>STUDY METHOD2.3 <strong>Update</strong> <strong>of</strong> Hydrologic/Flow Routing Model2.3.1 Background and ApproachThrough discussion with the <strong>City</strong> and ORCA, it was agreed that the technicalanalysis for this project would proceed as follows:1. The hydrologic and dynamic flow-routing components <strong>of</strong> the PCSWMM2005model developed by XCG for the <strong>Byersville</strong>/Harper <strong>Creek</strong> <strong>Flood</strong> ReductionProject, would be used to develop peak flood flows at various locations.2. The peak flood flows from the PCSWMM2005 model would then be applied in asteady-state HEC-RAS model to develop flood elevation estimates that wouldform the basis for the flood-risk mapping.3. The peak flows that will be given to the HEC-RAS model will come from thePCSWMM2005 model for existing watershed conditions. The hydraulicscomponent <strong>of</strong> the PCSWMM2005 model computes how much flow leaves themain stem to flow under the CPR line via the twin 2.0-m culverts that are locatedeast <strong>of</strong> The Parkway.4. <strong>Flood</strong> flows would be based on simulating the watershed response to theRegional Storm event (the so-called “Timmins” storm) per the current MNRtechnical guidelines for flood-risk mapping (MNR, 2001).5. With respect to representing the effect <strong>of</strong> stormwater storage ponds, the effects <strong>of</strong>such structures are not to be included when simulating peak flood flows for usein flood-risk mapping, per the 2002 technical guidelines.The development <strong>of</strong> the PCSWMM2005 hydrologic and flow-routing model is fullydocumented in the <strong>Byersville</strong>/Harper <strong>Creek</strong> <strong>Flood</strong> Reduction Study report (XCG,2009). In summary, this modelling approach is as follows:1. In using PCSWWM2005, the computational engine was EPA SWMM Version4.4 (Huber at al., 1988).2. For modelling purposes, the watershed was subdivided into 42 constituentsubcatchments based on considering topography and drainage systems.3. Computation <strong>of</strong> run<strong>of</strong>f hydrographs from each <strong>of</strong> these areas was carried outusing the RUNOFF object in PCSWMM2005.4. Addition <strong>of</strong> these flows and routing through the upper watershed (aboveClonsilla Avenue) was carried out using the TRANSPORT object inPCSWMM2005.5. For the lower portion <strong>of</strong> the watershed (below Clonsilla Avenue), flows wereadded and routed using the EXTRAN object <strong>of</strong> PCSWMM2005. The EXTRANobject provides full dynamic routing <strong>of</strong> flows and accounts for storage effectsassociated with channel or floodplain storage. The EXTRAN object allows for3-2087-09-01/R_3-04108226_<strong>Byersville</strong> <strong>Creek</strong> <strong>Mapping</strong> <strong>Update</strong> 2-608/11/10
<strong>City</strong> <strong>of</strong> Peterborough<strong>Lower</strong> <strong>Byersville</strong> <strong>Creek</strong> <strong>Flood</strong>-<strong>Risk</strong> <strong>Mapping</strong> <strong>Update</strong>STUDY METHODrepresentation <strong>of</strong> backwater effects and <strong>of</strong> impacts <strong>of</strong> flood conditions in themain outlet channels on conditions within tributary storm sewer systems.In this approach, the EXTRAN object is providing dynamic routing using the sametechnique that had previously been applied circa 1990 when the NWS DAMBRKmodel had been used to account for floodplain storage effects on the mildly slopedlower portions <strong>of</strong> <strong>Byersville</strong> <strong>Creek</strong> (especially downstream <strong>of</strong> The Parkway). In themore recent updates to the HEC-RAS model, the newly developed “unsteady flow”capabilities <strong>of</strong> HEC-RAS had been enabled in the 2003 update (GreenlandEngineering) apparently in an effort to do away with the need for a separate dynamicrouting model.The use <strong>of</strong> PCSWMM2005 EXTRAN to provide the dynamic flow routing, and thento apply the resulting peak flows in a steady-state version <strong>of</strong> the HEC-RAS modelhas been selected as the preferred approach, based on discussions with ORCA.2.3.2 Scope <strong>of</strong> PCSWMM Model <strong>Update</strong>To support an update to the flood-risk mapping for lower <strong>Byersville</strong> <strong>Creek</strong>, it wasdetermined that some modifications to the PCSWWM2005 model were needed.Details are provided in Appendix C. In summary, the modifications were as follows:Modification to Subcatchment BoundariesIt was decided that some minor adjustments to subcatchment boundaries in the lowerwatershed were warranted, to better represent inflow distribution along the mainstem <strong>of</strong> <strong>Byersville</strong> <strong>Creek</strong>, below The Parkway.Also, it was decided that an increase in surface imperviousness was needed in thesubcatchment (Subcatchment 5.1; see Appendix C, Figure C-1, for map) in which issituated the property on which a Costco commercial development has recently beencompleted (in the vicinity <strong>of</strong> The Parkway and Crawford Drive).<strong>Update</strong> to Flow Routing ElementsThe PCSWMM2005 EXTRAN model has been modified to include the following(see Appendix C for detail):• Flow routing elements to better represent the possibility <strong>of</strong> flow spilling over topthe former CNR line (recreational pathway), and resulting surface flow downCameron Street, Mountain Ash Road, Orpington Road and Erskine Avenue.• Potential for lateral split <strong>of</strong> flow from the Examiner Ditch at the 90-degree bendat the former CNR, with elements added to represent overland flowsouthwestward alongside the recreational pathway; and including the culvert pipeunder the pathway near the northwest corner <strong>of</strong> Master Brand Cabinets.• Potential for spill flow from the main stem <strong>of</strong> <strong>Byersville</strong> <strong>Creek</strong> flowing eastwardalong Crawford Drive and from Crawford Drive into to drainage swale alongrear yards <strong>of</strong> homes on Mountain Ash Road.3-2087-09-01/R_3-04108226_<strong>Byersville</strong> <strong>Creek</strong> <strong>Mapping</strong> <strong>Update</strong> 2-708/11/10
<strong>City</strong> <strong>of</strong> Peterborough<strong>Lower</strong> <strong>Byersville</strong> <strong>Creek</strong> <strong>Flood</strong>-<strong>Risk</strong> <strong>Mapping</strong> <strong>Update</strong>STUDY METHOD• The above routing elements have been added to address the potential floodingpathways as identified from reviewing the available information on whathappened during the event <strong>of</strong> July 2004.2.4 Extension <strong>of</strong> HEC-RAS Models2.4.1 Review <strong>of</strong> Existing HEC-RAS ModelIn order to conduct the analysis <strong>of</strong> flood levels in the lower area <strong>of</strong> <strong>Byersville</strong> <strong>Creek</strong>,existing HEC-RAS models approved and provided by ORCA were screened andapplied.As noted above, there are three (3) distinct component models that constitute theoverall existing HEC-RAS model within the study area. These three models aresections representing:a. Main branch <strong>of</strong> <strong>Byersville</strong> <strong>Creek</strong>b. Examiner Ditch; andc. Examiner Ditch West Spill alongside former CNR track (recreationalpathway).Each <strong>of</strong> these models were examined for redundancy (e.g. duplicate cross-sections),consistency with selected base map information and data gaps to facilitate an overallanalysis.Where applicable, existing cross-sections were preserved, with a priority assigned t<strong>of</strong>ield surveyed sections, and new cross-sections were generated as deemed necessary.Additional data was obtained from new survey information (March 2010)commissioned for this project.2.4.2 Model Extension South <strong>of</strong> Former CNR LineAn additional HEC-RAS model (“<strong>Lower</strong> Spill” model) has been created to calculateflood levels through the area southeast <strong>of</strong> the recreational pathway (former CNRline), with flow reaching the main stem <strong>of</strong> <strong>Byersville</strong> <strong>Creek</strong>. The upstream limit <strong>of</strong>this model represents ground surface on southeast side <strong>of</strong> the recreational pathway,from west <strong>of</strong> Cameron Street to east <strong>of</strong> Orpington Road.2.4.3 <strong>Update</strong> to Main Stem Model: CPR CulvertsThe main stem HEC-RAS model includes representation <strong>of</strong> the twin CSP culvertsunder the CPR on the main stem <strong>of</strong> <strong>Byersville</strong> <strong>Creek</strong> (west <strong>of</strong> The Parkway) as twin2.7-m diameter pipes. This reflects what was in place prior to the flood event <strong>of</strong> July14-15, 2004.During that event, there was reportedly damage to these culverts and some washout<strong>of</strong> the rail embankment. The rail company (CPR) carried out an immediatereplacement and repairs, installing a combination <strong>of</strong> a 3050-mm CSP pipe and a CSP2050-mm pipe.3-2087-09-01/R_3-04108226_<strong>Byersville</strong> <strong>Creek</strong> <strong>Mapping</strong> <strong>Update</strong> 2-808/11/10
<strong>City</strong> <strong>of</strong> Peterborough<strong>Lower</strong> <strong>Byersville</strong> <strong>Creek</strong> <strong>Flood</strong>-<strong>Risk</strong> <strong>Mapping</strong> <strong>Update</strong>STUDY METHODThese pipes were subsequently replaced in 2008 by twin 3.6-m diameter CSP pipes,per design prepared for CPR by Hatch Mott MacDonald (HMM Project No. 215529,design drawings dated April 2006).The HEC-RAS model <strong>of</strong> the main stem has been updated to represent these newculvert pipes. Culvert dimensions and elevations were based on the design drawingprepared by Hatch Mott MacDonald (Plan No. 2155929-C-004, dated April 12,2006).This modified model has been used to analyze the Regional Storm, as reportedbelow.For modelling <strong>of</strong> the flood conditions that occurred during the event <strong>of</strong> July 2004,the original model representation <strong>of</strong> the CPR culverts has been used.2.4.4 Integrated Application <strong>of</strong> the HEC-RAS ModelsWith the additional <strong>of</strong> a new component HEC-RAS model, there is the requirementto execute the new model in conjunction with the three existing HEC-RAS models,to compute flood surface elevations for the entire area <strong>of</strong> interest.The procedure applied was as follows:Step 1Step 2Step 3Step 4Run the Main Stem model in steady-state mode.Run the <strong>Lower</strong> Spill model (steady state) using starting watersurface elevation from HEC-RAS Section 0+543 <strong>of</strong> the main stemmodelRun the West Spill model (steady state) using starting watersurface elevation from HEC-RAS Section 1+705 <strong>of</strong> the main stemmodel.Run the Examiner Ditch model (steady state) using starting watersurface elevation based on higher <strong>of</strong> the upstream levels from theWest Spill model (HEC-RAS Section 876) or the <strong>Lower</strong> Spillmodel (HEC-RAS Section 450)Appendix D provides details on the HEC-RAS models, and includes map figureswhich show the section locations.3-2087-09-01/R_3-04108226_<strong>Byersville</strong> <strong>Creek</strong> <strong>Mapping</strong> <strong>Update</strong> 2-908/11/10
<strong>City</strong> <strong>of</strong> Peterborough<strong>Lower</strong> <strong>Byersville</strong> <strong>Creek</strong> <strong>Flood</strong>-<strong>Risk</strong> <strong>Mapping</strong> <strong>Update</strong>RESULTS OF ANALYSIS3. RESULTS OF ANALYSIS3.1 Model Performance AssessmentThe performance <strong>of</strong> the modelling tools has been assessed by using thePCSWMM2005 model and the HEC-RAS models to compute flows and map outsurface flooding areas for the July 14-15, 2004 event. These results have then beencompared to available information on where surface flooding occurred. Theavailable information on what happened within the study area during the July 2004event has been depicted in Figure 2.1.3.1.1 Rainfall Input to ModelThe rainfall data used to model this event was developed from radar rainfall intensitydata supplied by the <strong>City</strong> <strong>of</strong> Peterborough during the <strong>Byersville</strong>/Harper <strong>Creek</strong> <strong>Flood</strong>Reduction Study. Total event volume for the July 14-15, 2004 event over the<strong>Byersville</strong> <strong>Creek</strong> watershed is estimated at 151 mm, which fell over a period <strong>of</strong> 42hours, between 4:00 am on July 14 and 10:00 pm on July 15, 2004, with the worst <strong>of</strong>the flooding having occurred in the early morning (pre-dawn) <strong>of</strong> July 15th. SeeFigure 3.1 below, and also Appendix C for further details.3.1.2 Model Representation <strong>of</strong> July 14-15, 2004 EventInformation from local residents indicates that there was flow overtopping theformer CNR line, and some washout <strong>of</strong> the low embankment. Refer to Figure 2.1.It appears from the information obtained from local residents that wash-out near thewest end <strong>of</strong> Cameron Street may have been approximately 2 to 3 metres in width,and approximately 0.5 m in depth. In the vicinity <strong>of</strong> the west end <strong>of</strong> OrpingtonRoad, a local resident indicated that there had been flow over the former CNR and awashout approximately 2.4 m wide by 1.2 m in depth.In the PCSWMM EXTRAN model, the wash-out conditions were represented bymodifying the elevation pr<strong>of</strong>ile <strong>of</strong> the top <strong>of</strong> the former CNR line.Another factor that was applied in the EXTRAN model was the potential blockage <strong>of</strong>the storm sewer inlet (stub pipe) to the Erskine Avenue storm sewer, immediatelynorth <strong>of</strong> the former CNR crossing. Appendix C provides photographs <strong>of</strong> this inlettaken in 2007, and another taken in 2010. This inlet is obviously prone to debrisaccumulation, and it is considered very likely that at least partial blockage wouldhave occurred during the event <strong>of</strong> July 14-15, 2004. Accordingly, the model was runfor scenarios in which it was assumed that there was 60% blockage <strong>of</strong> this inlet.The dimensions <strong>of</strong> the wash-out at Cameron Street and the degree <strong>of</strong> blockage <strong>of</strong> theErskine Avenue storm sewer inlet were considered as potential “calibration”parameters, inasmuch as they could be adjusted to some degree to provide amodelling outcome that reflects what was actually observed during the 2004 event.3-2087-09-01/R_3-04108226_<strong>Byersville</strong> <strong>Creek</strong> <strong>Mapping</strong> <strong>Update</strong> 3-108/11/10
<strong>City</strong> <strong>of</strong> Peterborough<strong>Lower</strong> <strong>Byersville</strong> <strong>Creek</strong> <strong>Flood</strong>-<strong>Risk</strong> <strong>Mapping</strong> <strong>Update</strong>RESULTS OF ANALYSISFigure 3.1Rainfall <strong>of</strong> July 14-15, 2004 over <strong>Byersville</strong> <strong>Creek</strong> Watershed3-2087-09-01/R_3-04108226_<strong>Byersville</strong> <strong>Creek</strong> <strong>Mapping</strong> <strong>Update</strong> 3-208/11/10
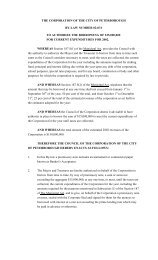
<strong>City</strong> <strong>of</strong> Peterborough<strong>Lower</strong> <strong>Byersville</strong> <strong>Creek</strong> <strong>Flood</strong>-<strong>Risk</strong> <strong>Mapping</strong> <strong>Update</strong>RESULTS OF ANALYSIS3.1.3 Flows Computed By PCSWMM ModelAppendix C provides a detailed presentation <strong>of</strong> peak flows computed by thePCSWMM EXTRAN model for the lower <strong>Byersville</strong> <strong>Creek</strong> watershed.The peak flows computed by the EXTRAN model for a numerous set <strong>of</strong> conduitsrepresenting the various flow paths within the area, was resolved into a simplified set<strong>of</strong> peak flows to be applied in the steady-state HEC-RAS model.Detailed model output tables presented in Appendix D show the flow values appliedwithin the HEC-RAS model.3.1.4 <strong>Mapping</strong> <strong>of</strong> Surface <strong>Flood</strong>ing Using HEC-RASFigure 3.2 presents the mapping <strong>of</strong> estimated surface flooding for the July 14-15,2004, as determined from the water surface elevation computed by the HEC-RASmodel using peak flows from the PCSWMM2005 model.The mapping <strong>of</strong> the surface flooding areas has been carried out using the DEMsupplied by the <strong>City</strong>. The general procedure for mapping out the surface floodingareas is as follows:• Water surface elevations computed by HEC-RAS at each cross-section (sectionlocations are shown on the map figure) are considered to be the water surfaceelevation along the full width <strong>of</strong> the cross-section.• Between each cross-section, the water surface is assumed to be an inclined, flatplane. GIS s<strong>of</strong>tware tools are used to map out where this plane intersects theground surface defined by the DEM. This intersection is the edge <strong>of</strong> the surfaceflooding area.• The results are reviewed and adjustments are made in locations where the initialmapping does not appear reasonable when considering topographic contouringand considering whether surface flow from the main path <strong>of</strong> flow could inactuality spread laterally to all locations indicated on the initial mapping.The PCSWMM EXTRAN surface/overland flowrates presented in Appendix C, andthe resulting mapping <strong>of</strong> surface flooding as shown on Figure 3.2 demonstrate whatcan be considered as acceptable model performance. The directions and depths <strong>of</strong>surface flow, and the mapping <strong>of</strong> surface flooding areas appears to be a reasonablyaccurate reflection <strong>of</strong> what is known to have actually taken place during the 2004event.It should be noted that this favourable result did in part depend on relying on roughestimates <strong>of</strong> the breadth and depth <strong>of</strong> the washouts <strong>of</strong> the former CNR embankmentas reported by local residents, and an assumption that there was 60% blockage <strong>of</strong> theErskine Avenue storm inlet.3-2087-09-01/R_3-04108226_<strong>Byersville</strong> <strong>Creek</strong> <strong>Mapping</strong> <strong>Update</strong> 3-308/11/10
GOLFVIEW RDWEBBER AVRALPHSON CRWENTWORTH ST1+025 - 190.71ARTHUR AVGOODFELLOW RDWIGHTMAN AVROBERT RD0+725 - 190.38WESTERN AVFORD STERSKINE AV0+543 - 190.36HIGH STMONAGHAN RDKENT STWHITEFIELD DRTHE PARKWAYCLONSILLA AV1+800 - 192.35SILVERDALE RD2+275 - 192.932+031 - 192.682+662 - 195.712+512 - 195.712+332 - 195.702+148 - 192.922+506 - 195.713+025 - 195.761+845 - 192.69RYE ST3+645 - 200.371+346 - 191.453+165 - 196.253+073 - 196.152+917 - 195.732+703 - 195.721+305 - 191.093+554 - 198.791964 - 193.601950 - 193.561+565 - 191.742+961 - 195.742050 - 195.001882 - 193.213+390 - 196.741978 - 194.911800 - 193.041850 - 193.071763 - 193.051700 - 193.041610 - 193.041458 - 192.84CAMERON PL1+527 - 191.532+883 - 195.731+705 - 191.99STORNOWAY PLARTHUR AVCROWN DRTHE KINGSWAY1800QUEENSWAY CTMOUNTAIN ASH RDCHAMBERLAIN PLST MARY'S ST1405 - 192.20THE QUEENSWAY14051327 - 191.990+450 - 191.571250 - 191.790+400 - 191.520+350 - 191.320+300 - 191.160+250 - 191.000+200 - 190.830+150 - 190.630+100 - 190.41BARNES CRSTOCKER RDCHAMBERLAIN STDUFFUS ST0+450 - 191.571777 - 193.05BRUNSWICK AVNEW ROMAINE STBORDEN AVGRADY AV1428 - 192.22BROWN ST0+384 - 190.33BARBARA CRCRAWFORD PLST MARY'S STGILLESPIE AVORPINGTON RDCAMERON STCRAWFORD DR0+223 - 190.29HAWLEY STFRANK STCHAMBERLAIN STBROWN STLUNDY'S LNLITTLE STBELLAIRE STHAROLD DRMERVIN AVNOBLE PLROMAINE STHAROLD PL0+083 - 190.26Cross SectionsLabels0+021 - 186.960+055 - 190.26ALBERT STNew XCG CNRSpill Model<strong>Update</strong>d DMWills Model<strong>Update</strong>d ORCAModelDOUGLAS AVMCCANNAN AVFAGAN AVHOWDEN STSPRUCE AVALFRED STBRAUND PLStation - Water Surface Elevation (m)Water Depth (m)0 - 0.010.01 - 0.050.05 - 0.10.1 - 0.20.2 - 0.30.3 - 0.40.4 - 0.50.5 - 0.60.6 - 0.70.7 - 0.80.8 - 0.90.9 - 11.0 - 1.5PRISCILLA ST1.5 - 22.0 - 2.52.5 - 33.0 - 3.53.5 - 44.0 - 4.54.5 - 5STEELE AVRIVERSIDE DR0+865 - 190.551+187 - 190.897 & 115 HY7 & 115 HYJOHNSTON DRGUTHRIE DRFigure 3.2July 2004 EventSurface <strong>Flood</strong>ingË0 100 200 300 400MetersNote:1. Elevation data is based on the Digital Elevation Model (DEM)provided by the <strong>City</strong> <strong>of</strong> Peterborough dated 2005.2. Results are for modelling "Case 3" which includes reportedwashouts <strong>of</strong> former CNR in vicinity <strong>of</strong> Orpington Road andCameron Street; and 60% blockage <strong>of</strong> the Erskine Avenuestorm sewer inlet on the Examiner Ditch.
<strong>City</strong> <strong>of</strong> Peterborough<strong>Lower</strong> <strong>Byersville</strong> <strong>Creek</strong> <strong>Flood</strong>-<strong>Risk</strong> <strong>Mapping</strong> <strong>Update</strong>RESULTS OF ANALYSIS3.2 Regional Storm EventOnce model performance had been demonstrated, the Regional Storm event wasanalyzed. As noted above, the analysis was based on applying the updated mainstem HEC-RAS model which represents the twin 3.6-m CSP culverts under the CPRwest <strong>of</strong> The Parkway as installed in 2008.3.2.1 Rainfall Input to ModelThe Regional Storm for Peterborough is the Zone 3 Regional Storm, as prescribedfor flood-risk mapping by the Ontario Ministry <strong>of</strong> Natural Resources technicalguidelines (OMNR, 2002). This historical event is also referred to as the“Timmins” event, which is a rain storm that occurred in the Timmins area inSeptember 1961. The Natural Hazard Technical Guidelines (OMNR, 2002) dictatethat this event should be used for flood-risk analysis in the portion <strong>of</strong> Province inwhich Peterborough is situated.Table 3.2 provided below presents a comparison <strong>of</strong> the Regional Storm with the July2004 event. Note that the 1-hour and 2-hour durations, the July 2004 event was moreintense. As noted in the 1990 <strong>Flood</strong> <strong>Risk</strong> <strong>Mapping</strong> Study, and also determined bymodelling during the <strong>Byersville</strong>/Harper <strong>Creek</strong> <strong>Flood</strong> Reduction Study (XCG, 2009),this is the range <strong>of</strong> critical storm duration for the <strong>Byersville</strong> <strong>Creek</strong> watershed.Table 3.1Comparison <strong>of</strong> rainfall <strong>of</strong> July 14-15, 2004 over <strong>Byersville</strong><strong>Creek</strong> with Zone 3 Regulatory eventTable Heading 1July 14-15, 2004 Event Over<strong>Byersville</strong> <strong>Creek</strong> WatershedRegulatory Timmins StormTotal event 151 mm in 42 hours 193 mm in 12 hrsMaximum amount in 1 hour 46 mm 43 mmMaximum amount in 2 hours 71 mm 63 mmMaximum amount in 6 hours 98 mm 132 mmMaximum amount in 12 hours 118 mm 193 mm3.2.2 Flows Computed by PCSWMM ModelAppendix C provides a detailed presentation <strong>of</strong> peak flows computed by thePCSWMM EXTRAN model for the lower <strong>Byersville</strong> <strong>Creek</strong> watershed, for theRegional Storm.As with the July 2004 event, the detailed PCSWMM EXTRAN flows were resolvedinto a simplified set <strong>of</strong> peak flows for input to the steady-state HEC-RAS model.Appendix D includes output tables from the HEC-RAS model that list the flowvalues applied in the HEC-RAS model runs.With respect to the twin 3.6-m CSP culverts under the CPR on the main stem <strong>of</strong><strong>Byersville</strong> <strong>Creek</strong> (west <strong>of</strong> The Parkway), it should be noted that removing these3-2087-09-01/R_3-04108226_<strong>Byersville</strong> <strong>Creek</strong> <strong>Mapping</strong> <strong>Update</strong> 3-508/11/10
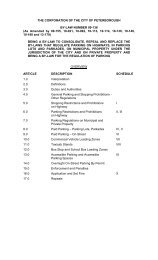
<strong>City</strong> <strong>of</strong> Peterborough<strong>Lower</strong> <strong>Byersville</strong> <strong>Creek</strong> <strong>Flood</strong>-<strong>Risk</strong> <strong>Mapping</strong> <strong>Update</strong>RESULTS OF ANALYSISculverts and the rail embankment from the flow routing model would not have anysubstantial effect on peak flows along the main channel <strong>of</strong> <strong>Byersville</strong> <strong>Creek</strong>, sincethere is no significant flow attenuation by the channel storage created by the back-upbehind the rail embankment. This can be seen by reviewing the peak flood flowvalues above and below the CPR rail line as tabulated in Appendix D. On this basis,it was not considered warranted to model the main stem flows with the CPR culvertsremoved or washed out as happened during the July 2004 event. With respect to thecomputation <strong>of</strong> water surface elevation using HEC-RAS, the effect <strong>of</strong> the CPRembankment has been included, as required by the OMNR technical guidelines.3.2.3 <strong>Mapping</strong> <strong>of</strong> Surface <strong>Flood</strong>ing Using HEC-RAS: Existing SystemFigure 3.3 presents the mapping <strong>of</strong> estimated surface flooding for the RegionalStorm ("Timmins") event, as determined from the water surface elevation computedby the HEC-RAS model using peak flows from the PCSWMM2005 model.Note that Figure 3.3 is for the existing system without any modifications to existingculverts.As was done for the July 2004 event, the mapping <strong>of</strong> the surface flooding areas hasbeen carried out using the DEM supplied by the <strong>City</strong>, with the general procedure asdescribed above.Some points to note about the mapping shown on Figure 3.3.• To map the full spatial extent <strong>of</strong> flooding, computed water surface elevations ateach modelled cross-section have been projected laterally along the section linesshown on the map figure.• These projections across the DEM did in some areas result initially in surfaceflooding or ponding within isolated patches or pockets that in all likelihoodwould not in fact experience such flooding, because there is no known orapparent hydraulic connection to the floodway. Some judgment and editing wastherefore necessary to develop the mapping as shown.• Similarly, because <strong>of</strong> the presence <strong>of</strong> multiple flow paths and the fact that themain stem and Examiner Ditch flow paths go through near 90-degree turns, therewas a requirement for some interpretation and judgment in mapping the floodsurface where cross-sections from the separate HEC-RAS models overlap or areorthogonal to one another.Along the eastern limit <strong>of</strong> the mapped area, the flood surface from the ExaminerDitch has been projected eastward to Erskine Avenue, and then further eastward ontothe Lansdowne Place property. This reflects a flood surface elevation in the range<strong>of</strong> 192.92 m to 193.02 m along the Examiner Ditch between The Kingsway and TheQueensway, and a low road surface elevation <strong>of</strong> 192.54 m along a sag in ErskineAvenue just south <strong>of</strong> The Kingsway. In other words, the mapping <strong>of</strong> surfaceflooding extending to the east <strong>of</strong> Erskine Avenue is based on lateral spread <strong>of</strong> flood3-2087-09-01/R_3-04108226_<strong>Byersville</strong> <strong>Creek</strong> <strong>Mapping</strong> <strong>Update</strong> 3-608/11/10
<strong>City</strong> <strong>of</strong> Peterborough<strong>Lower</strong> <strong>Byersville</strong> <strong>Creek</strong> <strong>Flood</strong>-<strong>Risk</strong> <strong>Mapping</strong> <strong>Update</strong>RESULTS OF ANALYSISflow along the Examiner Ditch across Erskine Avenue and then onto the LansdownePlace property.The estimated extent and depth <strong>of</strong> surface flooding to the east <strong>of</strong> Erskine Avenue isbased on a revision made by XCG to the <strong>City</strong>-supplied DEM, whereby elevationinformation taken from the site grading plan for the recent Lansdowne Placeproperty has been patched into the DEM for this property parcel.3.2.4 <strong>Mapping</strong> <strong>of</strong> Surface <strong>Flood</strong>ing Using HEC-RAS: Proposed CulvertModificationsThe <strong>Byersville</strong>/Harper <strong>Creek</strong> <strong>Flood</strong> Reduction Study (XCG Consultants, 2009 for<strong>City</strong> <strong>of</strong> Peterborough) provided the <strong>City</strong> with a number <strong>of</strong> recommended actions andmeasures to reduce surface flooding throughout the <strong>Byersville</strong> <strong>Creek</strong> watershed.One component <strong>of</strong> the recommended strategy was replacement <strong>of</strong> the existing twin2.0-m culverts under the CPR east <strong>of</strong> The Parkway that discharge into the ExaminerDitch; see Figure 1.2 above. The recommendation was that these two culverts bereplaced by a single 1.0-m culvert, to substantially reduce peak flows discharged tothe Examiner Ditch from the area north <strong>of</strong> the CPR.The effect <strong>of</strong> this specific measure on downstream flood levels and flooded area hasbeen examined, as modelling scenario "Case 4".To model the effect <strong>of</strong> this proposed measure, the following procedure was used:• The PCSWMM2005 EXTRAN model was modified to represent the culvertreplacement. It was assumed that culvert invert and length would remain thesame as existing.• The EXTRAN model was then used to simulate system response to the RegionStorm event. It was assumed that there would be no alteration in the naturalponding/storage area situated immediately north <strong>of</strong> the culverts in question.• The resulting peak flows computed by EXTRAN are provided in map figures inAppendix C <strong>of</strong> this report. Peak flows entering the Examiner Ditch at the CPRwere reduced from 11.9 m3/s to 5.3 m3/s. Further to the south, the amount <strong>of</strong>spill flow over the former CNR is substantially reduced but not completelyeliminated.• The peak flows from EXTRAN were then applied in the HEC-RAS models, andthe resulting flood surface was mapped. Figure 3.4 provides the result.The net effect is a substantial reduction in flooded area between the CPR rail lineand the former CNR line, as well as some reduction within the area south <strong>of</strong> theformer CNR.With respect to area to the east <strong>of</strong> Erskine Avenue and particularly the LansdownePlace property and immediate vicinity, there is a substantial benefit and virtual3-2087-09-01/R_3-04108226_<strong>Byersville</strong> <strong>Creek</strong> <strong>Mapping</strong> <strong>Update</strong> 3-708/11/10
<strong>City</strong> <strong>of</strong> Peterborough<strong>Lower</strong> <strong>Byersville</strong> <strong>Creek</strong> <strong>Flood</strong>-<strong>Risk</strong> <strong>Mapping</strong> <strong>Update</strong>RESULTS OF ANALYSISelimination <strong>of</strong> the surface flooding that had been projected under existing conditions(per Figure 3.3). This results from the fact that computed water surface elevationalong the Examiner Ditch between The Kingsway and The Queensway is reduced byapproximately 0.40 metres to a peak elevation <strong>of</strong> 192.63 m, resulting in watersurface projection eastward that results in 0.10 m <strong>of</strong> ponding depth overtop <strong>of</strong>Erskine Avenue at the sag just south <strong>of</strong> The Kingsway intersection, and projectionfurther to the east as shown on Figure 3.4.3-2087-09-01/R_3-04108226_<strong>Byersville</strong> <strong>Creek</strong> <strong>Mapping</strong> <strong>Update</strong> 3-808/11/10
WEBBER AVRALPHSON CRWENTWORTH ST1+025 - 190.71ARTHUR AVWIGHTMAN AVROBERT RD0+725 - 190.41WESTERN AVFORD STERSKINE AV0+543 - 190.41HIGH STMONAGHAN RDKENT STWHITEFIELD DRTHE PARKWAYCLONSILLA AV1+800 - 192.332+275 - 192.922+031 - 192.672+662 - 195.722+512 - 195.712+332 - 195.72+148 - 192.912+506 - 195.713+025 - 195.751+845 - 192.66RYE ST3+645 - 200.381+346 - 191.443+165 - 196.243+073 - 196.152+917 - 195.732+703 - 195.72Costco1+305 - 191.083+554 - 198.781964 - 193.581950 - 193.541+565 - 191.732+961 - 195.732050 - 194.881882 - 193.193+390 - 196.721978 - 194.791800 - 193.011850 - 193.041763 - 193.021700 - 193.021610 - 193.011458 - 192.84CAMERON PL1+527 - 191.522+883 - 195.731+705 - 191.98STORNOWAY PLARTHUR AVCROWN DRTHE KINGSWAY1800QUEENSWAY CTST MARY'S STMOUNTAIN ASH RDCHAMBERLAIN PL1405 - 192.15THE QUEENSWAY14051327 - 191.950+450 - 191.291250 - 191.770+400 - 191.220+350 - 191.050+300 - 191.040+250 - 190.910+200 - 190.710+150 - 190.560+100 - 190.37BARNES CRSTOCKER RDCHAMBERLAIN STDUFFUS STNEW ROMAINE STBORDEN AV0+450 - 191.291777 - 193.021428 - 192.18HAWLEY STGRADY AVBROWN ST0+384 - 190.41BARBARA CRLansdownePlace"Lansdowne Place siteplan indicates emergencyspillway elevation <strong>of</strong> 192.40m.CRAWFORD PLROMAINE STST MARY'S STGILLESPIE AVORPINGTON RDCAMERON STCRAWFORD DR0+223 - 190.41FRANK STCHAMBERLAIN STBROWN STLUNDY'S LNLITTLE STBELLAIRE STHAROLD DRMERVIN AVNOBLE PLHAROLD PL0+083 - 190.410+021 - 190.410+055 - 190.41ALBERT STCross SectionsLabelsDOUGLAS AVMCCANNAN AVFAGAN AVHOWDEN STSPRUCE AVALFRED STNew XCG CNRSpill Model<strong>Update</strong>d DMWills Model<strong>Update</strong>d ORCAModelBRAUND PLStation - Water Surface Elevation (m)Water Depth (m)0 - 0.010.01 - 0.050.05 - 0.10.1 - 0.20.2 - 0.30.3 - 0.40.4 - 0.50.5 - 0.60.6 - 0.70.7 - 0.80.8 - 0.90.9 - 1PRISCILLA ST1.0 - 1.51.5 - 22.0 - 2.52.5 - 33.0 - 3.53.5 - 44.0 - 4.54.5 - 5Current Regulatory<strong>Flood</strong> <strong>Risk</strong> Lineper ORCASTEELE AVRIVERSIDE DR0+865 - 190.561+187 - 190.897 & 115 HYJOHNSTON DR7 & 115 HYGUTHRIE DRMCNAMARA RDFigure 3.3Regional Storm EventExisting Condition (Modelling Case 1)Surface <strong>Flood</strong>ingË0 100 200 300 400MetersNote:1. Elevation data used in the analysis is based on the Digital Elevation Model(DEM) provided by the <strong>City</strong> <strong>of</strong> Peterborough dated 2005. All ground elevationsare based on the DEM with the exception <strong>of</strong> the Costco and Lansdowne Placeproperties which have been developed since then. Site grading plans for the twoproperties were used to modify the DEM to more accurately represent thedevelopments. Site grading plan for Costco property by MMM Group, datedFeb.13, 2008. Site grading plan for Lansdowne Place by CounterpointEngineering dated June 4, 2008.2. The potential extent <strong>of</strong> surface flooding associated with any spill via theLansdowne Place emergency spillway has not been analyzed.
GOLFVIEW RDWEBBER AVRALPHSON CRWENTWORTH ST1+025 - 190.71ARTHUR AVGOODFELLOW RDWIGHTMAN AVROBERT RD0+725 - 190.41WESTERN AVFORD STERSKINE AV0+543 - 190.410+543 - 190.410+384 - 190.41HIGH STSHIRLEY AVMONAGHAN RDKENT STWHITEFIELD DRTHE PARKWAYCLONSILLA AV2+031 - 192.671+800 - 192.332+332 - 195.72+148 - 192.911+565 - 191.73SILVERDALE RD2+275 - 192.922+031 - 192.672+662 - 195.252+512 - 195.242+332 - 195.222+148 - 192.911+845 - 192.66RYE ST2+506 - 195.231+800 - 192.333+025 - 195.482+917 - 195.731+845 - 192.663+645 - 200.382+961 - 195.732+883 - 195.732+662 - 195.722+275 - 192.922+512 - 195.713+390 - 196.721+346 - 191.443+165 - 196.243+073 - 196.152+917 - 195.33+554 - 198.78 3+554 - 198.782+703 - 195.72Costco1+305 - 191.081964 - 193.511+565 - 191.731+187 - 190.891950 - 193.333+390 - 196.722+961 - 195.321882 - 192.82050 - 1962+703 - 195.261978 - 1961800 - 192.751850 - 192.781763 - 192.631700 - 192.611610 - 192.531458 - 192.351+705 - 191.981+346 - 191.443+165 - 196.243+073 - 196.153+025 - 195.75CAMERON PL1+527 - 191.522+883 - 195.291+705 - 191.98STORNOWAY PLARTHUR AVCROWN DRTHE KINGSWAY1+527 - 191.527 & 115 HY0+865 - 190.561800QUEENSWAY CTMOUNTAIN ASH RDCHAMBERLAIN PLST MARY'S ST1405 - 192.15THE QUEENSWAY14051327 - 192.090+450 - 191.241250 - 192.050+400 - 191.150+350 - 191.020+300 - 190.960+250 - 190.870+200 - 190.620+150 - 190.460+100 - 190.37BARNES CRSTOCKER RDCHAMBERLAIN STDUFFUS ST0+450 - 191.241777 - 192.74BRUNSWICK AVNEW ROMAINE STBORDEN AVGRADY AV1428 - 192.16BROWN ST0+384 - 190.41CRAWFORD PLLansdownePlaceGILLESPIE AVORPINGTON RDBARBARA CRST MARY'S STCAMERON STCRAWFORD DR0+223 - 190.410+223 - 190.41HAWLEY STFRANK STCHAMBERLAIN STBROWN STLUNDY'S LNLITTLE STMERVIN AVBELLAIRE STHAROLD DRNOBLE PLROMAINE ST0+055 - 190.410+083 - 190.41Cross SectionsLabels0+083 - 190.410+021 - 190.410+055 - 190.41ALBERT STNew XCG CNRSpill Model<strong>Update</strong>d DMWills Model<strong>Update</strong>d ORCAModelDOUGLAS AVMCCANNAN AVFAGAN AVHOWDEN STSPRUCE AVALFRED STBRAUND PLStation - Water Surface Elevation (m)Water Depth (m)0 - 0.010.01 - 0.050.05 - 0.10.1 - 0.20.2 - 0.30.3 - 0.40.4 - 0.50.5 - 0.60.6 - 0.70.7 - 0.80.8 - 0.90.9 - 11.0 - 1.51.5 - 22.0 - 2.52.5 - 33.0 - 3.53.5 - 44.0 - 4.54.5 - 5PRISCILLA STCurrent Regulatory<strong>Flood</strong> <strong>Risk</strong> Lineper ORCASTEELE AVRIVERSIDE DR7 & 115 HYJOHNSTON DRGUTHRIE DRFigure 3.4Regional Storm Event with ProposedCPR Culvert Replacement (ModellingCase 4) Surface <strong>Flood</strong>ingË0 100 200 300 400MetersNote:1. Elevation data used in the analysis is based on the Digital Elevation Model(DEM) provided by the <strong>City</strong> <strong>of</strong> Peterborough dated 2005. All ground elevationsare based on the DEM with the exception <strong>of</strong> the Costco and Lansdowne Placeproperties which have been developed since then. Site grading plans for the twoproperties were used to modify the DEM to more accurately represent thedevelopments. Site grading plan for Costco property by MMM Group, datedFeb.13, 2008. Site grading plan for Lansdowne Place by CounterpointEngineering dated June 4, 2008.
<strong>City</strong> <strong>of</strong> Peterborough<strong>Lower</strong> <strong>Byersville</strong> <strong>Creek</strong> <strong>Flood</strong>-<strong>Risk</strong> <strong>Mapping</strong> <strong>Update</strong>LIMITATIONS OF ANALYSIS4. LIMITATIONS OF ANALYSIS4.1 Limitations <strong>of</strong> Modelling ApproachAs described above, the modelling approach has been based on the use <strong>of</strong> EXTRANfor dynamic flow routing and computation <strong>of</strong> how much flow travels along variousflow paths within the subject area. HEC-RAS has then been used in “steady state”mode to compute water surface elevations associated with the peak flows computedby EXTRAN.This approach accounts for the considerable surface storage effects that are presentwithin the subject area, along the main stem <strong>of</strong> <strong>Byersville</strong> <strong>Creek</strong> itself, and withinother area subject to surface ponding or flooding. Additionally, this approachaccounts for capacity limitations <strong>of</strong> the storm sewer system and represents the factthat surcharging <strong>of</strong> pipe systems such as the Erskine Avenue storm sewer may havecontributed to surface flow along streets such as Erskine Avenue.The modelling approach is considered to be a reasonable representation <strong>of</strong> thesystem, considering the favourable reproduction <strong>of</strong> what occurred during the event<strong>of</strong> July 2004. However, it needs to be recognized that the modelling tools that havebeen applied are what is termed “one dimensional” models <strong>of</strong> open channel flow.The models have been applied such that a number <strong>of</strong> interconnected flow conduitshave been used to provide a presentation <strong>of</strong> what is in fact a very two-dimensionalsituation in which surface flow does not follow one well-defined floodway, butinstead bifurcates, flows along multiple surface paths, and then reconverges near thewatershed outlet.While the modelling approach is considered a reasonable approximation, it needs tobe realized that it may not account for all localized flow patterns. Nonetheless, theresulting mapping <strong>of</strong> the area subject to surface flooding is considered to be acomprehensive mapping <strong>of</strong> where flooding risk exists, based on the availabletopographic base mapping.4.2 Base <strong>Mapping</strong>The topographic base mapping and the resulting mapping <strong>of</strong> flooded areas, is derivedfrom the digital elevation model (DEM) supplied by the <strong>City</strong>. The vertical precision<strong>of</strong> the DEM is 0.25 m, having been reportedly derived from air photo interpretationin which a vertical accuracy <strong>of</strong> 0.16 m was achieved (per report to <strong>City</strong> <strong>of</strong>Peterborough by OSI Geomatics, 2005).As noted above, the 0.25-m precision <strong>of</strong> the available topographic mapping isconsistent with technical guidelines for floodplain mapping that have previouslybeen published by the Ontario Ministry <strong>of</strong> Natural Resources ("<strong>Flood</strong> PlainManagement in Ontario: Technical Guidelines" , section "J - Surveys and <strong>Mapping</strong>Procedures for <strong>Flood</strong>plain <strong>Mapping</strong>", Ont. Ministry <strong>of</strong> Natural Resources, 1986).3-2087-09-01/R_3-04108226_<strong>Byersville</strong> <strong>Creek</strong> <strong>Mapping</strong> <strong>Update</strong> 4-108/11/10
<strong>City</strong> <strong>of</strong> Peterborough<strong>Lower</strong> <strong>Byersville</strong> <strong>Creek</strong> <strong>Flood</strong>-<strong>Risk</strong> <strong>Mapping</strong> <strong>Update</strong>LIMITATIONS OF ANALYSISThe original DEM supplied by the <strong>City</strong>, having been based on aerial photographytaken in May 2005, did not reflect recent site developments on the Costco property(circa 2008) on The Parkway east <strong>of</strong> Crawford Drive, or the recent redevelopment <strong>of</strong>Lansdowne Place (circa 2009). Site grading plans for these two propertydevelopment has been used to update the DEM for these two specific properties bymanually digitizing sufficient elevation points to provide mapping precision (i.e.density <strong>of</strong> elevation points) over those two properties that meets or exceeds that <strong>of</strong>the original DEM coverage <strong>of</strong> those properties.On this basis, the mapping provided in this report represents mapping <strong>of</strong> surfaceflooding area that is based on best available information, and which therefore can beused as the basis for finalising an update to the flood-risk mapping for this area.3-2087-09-01/R_3-04108226_<strong>Byersville</strong> <strong>Creek</strong> <strong>Mapping</strong> <strong>Update</strong> 4-208/11/10
<strong>City</strong> <strong>of</strong> Peterborough<strong>Lower</strong> <strong>Byersville</strong> <strong>Creek</strong> <strong>Flood</strong>-<strong>Risk</strong> <strong>Mapping</strong> <strong>Update</strong>FINALIZATION OF MAPPING5. RECOMMENDATIONS5.1 <strong>Flood</strong>-<strong>Risk</strong> <strong>Mapping</strong> <strong>Update</strong>It is recommended that the flood mapping presented in this report (Figure 3.3) beconsidered by the <strong>City</strong> <strong>of</strong> Peterborough and Otonabee Region ConservationAuthority, as an update to the Regulatory flood-risk mapping within the <strong>Byersville</strong><strong>Creek</strong> watershed below Lansdowne Street West. This would fulfill therecommendation made in the <strong>Byersville</strong>/Harper <strong>Creek</strong> <strong>Flood</strong> Reduction Study (April2009) that the flood-risk mapping in the area should be updated.5.2 Implementation Priorities for <strong>Byersville</strong> <strong>Creek</strong> <strong>Flood</strong> Reduction:With respect to the replacement <strong>of</strong> the existing twin 2.0-m CSP culverts locatedunder the CPR line east <strong>of</strong> The Parkway as recommended in the <strong>Byersville</strong>/Harper<strong>Creek</strong> <strong>Flood</strong> Reduction Study report, the analysis presented here has confirmed thatthis individual modification will have immediate benefits in the lower watershed.This analysis has confirmed that his measure should be considered a high priority interms <strong>of</strong> implementing the various measures recommended in the <strong>Byersville</strong>/Harper<strong>Creek</strong> <strong>Flood</strong> Reduction Study. The <strong>Byersville</strong>/Harper <strong>Creek</strong> Study report (Table6.2) recommended that this culvert replacement be considered a top priority giventhat it, along with other measures recommended for the lower watershed, wouldprovide a benefit/cost ratio <strong>of</strong> approximately 4.2. This recommendation thereforeremains appropriate.The <strong>Byersville</strong>/Harper <strong>Creek</strong> <strong>Flood</strong> Reduction Study report provides an estimatedcost for the culvert replacement <strong>of</strong> $300,000.5.3 Additional Recommended MeasuresThe <strong>Byersville</strong>/Harper <strong>Creek</strong> <strong>Flood</strong> Reduction Study recommended that culvert inlettrash racks be improved at a number <strong>of</strong> locations within the watershed.Improvements to various culvert inlet trash racks were identified as a priority forimplementation <strong>of</strong> the overall flood-reduction strategy.The inlet trash rack on the Examiner Ditch at the pipe inlet to the Erskine Avenuestorm sewer (see Figure 1.2) should be included amongst these priority locations.Routine inspection and clean-out <strong>of</strong> any accumulated debris along the ExaminerDitch should be part <strong>of</strong> routine storm drainage system maintenance carried out by the<strong>City</strong>.3-2087-09-01/R_3-04108226_<strong>Byersville</strong> <strong>Creek</strong> <strong>Mapping</strong> <strong>Update</strong> 5-108/11/10
<strong>City</strong> <strong>of</strong> Peterborough<strong>Lower</strong> <strong>Byersville</strong> <strong>Creek</strong> <strong>Flood</strong>-<strong>Risk</strong> <strong>Mapping</strong> <strong>Update</strong>REFERENCES CITED6. REFERENCES CITEDGreenland International Consulting, 2003. <strong>Byersville</strong> <strong>Creek</strong> Two-Zone conceptAssessment for <strong>Flood</strong>plain Planning & Encroachment Analysis Study Report.Prepared for <strong>City</strong> <strong>of</strong> Peterborough. Sept. 2003.Huber, W.C. and R.E. Dickinson (1988), Storm Water Management Model User'sManual, Version 4, EPA/600/3-88/001a (NTIS PB88-236641/AS),Environmental Protection Agency, Athens, GA, 1988, 595 pp.John W. Merriam & Associates, 2005. High Water Mark Descriptions, Peterborough<strong>Flood</strong> <strong>of</strong> July 15, 2004. Prepared for Otonabee Conservation, dated May2005.Marshall Macklin Monaghan Limited and Totten Sims Hubicki Limited, 1991.<strong>Flood</strong> <strong>Risk</strong> Map Sheets for Otonabee River Tributary - <strong>Byersville</strong> <strong>Creek</strong>.Prepared as part <strong>of</strong> Canada-Ontario <strong>Flood</strong> Damage Reduction Program. Mapnumbers OTR4-26, 4-27A, 4-27B, 4-28, 4-29 and 4-30. Dated March 1991(OTR4-26 updated Nov 1995 from CNR to CPR).Ontario Ministry <strong>of</strong> Natural Resources, 2002. “Technical Guide – River and StreamSystems: <strong>Flood</strong>ing Hazard Limit”, prepared by Ont. Ministry <strong>of</strong> NaturalResources Water Resources Section, 300 Water Street, P.O. Box 7000,Peterborough, Ontario. Published as part <strong>of</strong> Ontario’s Natural HazardsTechnical Guidelines, prepared by the Ontario Ministry <strong>of</strong> Natural Resourcesin support <strong>of</strong> the natural hazards policies 3.1 <strong>of</strong> the Provincial PolicyStatement <strong>of</strong> the Province <strong>of</strong> Ontario’s Planning Act. © 2001, Queen’sPrinter for Ontario. Published by Watershed Science Centre, TrentUniversity, Peterborough, Ontario, Canada. ISBN 0-7794-1008-4.OSI Geomatics, 2005. "Aerial Triangulation Report for <strong>City</strong> <strong>of</strong> Peterborough",prepared by OSI Geomatics, 107 - 930 West 1st Street, North Vancouver,B.C. V7P 3N4. OSI project # 050099, report dated June 29, 2005.Roesner, L.A., Aldrich, J.A. and R.E. Dickinson (1988), Storm Water ManagementModel User's Manual, Version 4: Addendum I, EXTRAN, EPA/600/3-88/001b (NTIS PB88236658/AS), Environmental Protection Agency,Athens, GA, 1988, 203 pp.Totten Sims Hubicki Associates, 1990. “<strong>Flood</strong> <strong>Risk</strong> <strong>Mapping</strong> Study”, prepared for<strong>City</strong> <strong>of</strong> Peterborough and Otonabee River Conservation Authority underCanada/Ontario <strong>Flood</strong> Damage Reduction Program; “Volume 2 Hydrology”dated Feb. 9, 1989 and “Volume 3 Hydraulics Report” dated Dec. 1990.XCG Consultants, 2009. <strong>Byersville</strong>/Harper <strong>Creek</strong> <strong>Flood</strong> Reduction Study FinalReport, including technical appendices. Report prepared for <strong>City</strong> <strong>of</strong>Peterborough Utility Services Department, attention Mr. Chris Lang., P.Eng.,report dated April 27, 2009.3-2087-09-01/R_3-04108226_<strong>Byersville</strong> <strong>Creek</strong> <strong>Mapping</strong> <strong>Update</strong> 6-108/11/10
<strong>City</strong> <strong>of</strong> Peterborough<strong>Lower</strong> <strong>Byersville</strong> <strong>Creek</strong> <strong>Flood</strong>-<strong>Risk</strong> <strong>Mapping</strong> <strong>Update</strong>APPENDICESAPPENDIX APHOTOS OF JULY 2004 EVENTAS SUPPLIED BY ORCA3-2087-09-01/R_3-04108226_<strong>Byersville</strong> <strong>Creek</strong> <strong>Mapping</strong> <strong>Update</strong>08/11/10A
APPENDIX A: PHOTOS PROVIDED TO XCG BY ORCA IN LATE 2009 AND EARLY 2010Photos taken July 15, 2009, Exact time <strong>of</strong> day <strong>of</strong> these photos is unknownLooking east along Orpington Road at Erskine Ave intersectionLooking southward from north side <strong>of</strong> Orpington at a location roughly mid-way between CNR and ErskineXCG file 3-2087-09-01 <strong>Lower</strong> <strong>Byersville</strong> <strong>Creek</strong> <strong>Flood</strong> <strong>Risk</strong> <strong>Mapping</strong> Report Page 1 <strong>of</strong> 9APPENDIX A
APPENDIX A: PHOTOS PROVIDED TO XCG BY ORCA IN LATE 2009 AND EARLY 2010Photos taken July 15, 2009, Exact time <strong>of</strong> day <strong>of</strong> these photos is unknownLooking eastward along Orpington, per Google street viewSame location as aboveXCG file 3-2087-09-01 <strong>Lower</strong> <strong>Byersville</strong> <strong>Creek</strong> <strong>Flood</strong> <strong>Risk</strong> <strong>Mapping</strong> Report Page 2 <strong>of</strong> 9APPENDIX A
APPENDIX A: PHOTOS PROVIDED TO XCG BY ORCA IN LATE 2009 AND EARLY 2010Photos taken July 15, 2009, Exact time <strong>of</strong> day <strong>of</strong> these photos is unknownAlong Orpington RoadAlong Orpington RoadXCG file 3-2087-09-01 <strong>Lower</strong> <strong>Byersville</strong> <strong>Creek</strong> <strong>Flood</strong> <strong>Risk</strong> <strong>Mapping</strong> Report Page 3 <strong>of</strong> 9APPENDIX A
APPENDIX A: PHOTOS PROVIDED TO XCG BY ORCA IN LATE 2009 AND EARLY 2010Photos taken July 15, 2009, Exact time <strong>of</strong> day <strong>of</strong> these photos is unknownAlong Orpington RoadThe Parkway at Queensway (looking northward through the intersection)XCG file 3-2087-09-01 <strong>Lower</strong> <strong>Byersville</strong> <strong>Creek</strong> <strong>Flood</strong> <strong>Risk</strong> <strong>Mapping</strong> Report Page 4 <strong>of</strong> 9APPENDIX A
APPENDIX A: PHOTOS PROVIDED TO XCG BY ORCA IN LATE 2009 AND EARLY 2010Photos taken July 15, 2009, Exact time <strong>of</strong> day <strong>of</strong> these photos is unknownCrawford Drive facing east from Myers TruckingCrawford Drive facing west at entrance to Myers TruckingXCG file 3-2087-09-01 <strong>Lower</strong> <strong>Byersville</strong> <strong>Creek</strong> <strong>Flood</strong> <strong>Risk</strong> <strong>Mapping</strong> Report Page 5 <strong>of</strong> 9APPENDIX A
APPENDIX A: PHOTOS PROVIDED TO XCG BY ORCA IN LATE 2009 AND EARLY 2010Photos taken July 15, 2009, Exact time <strong>of</strong> day <strong>of</strong> these photos is unknownLooking north from The Kingsway, just west <strong>of</strong> Erskine AvenueLansdowne PlaceXCG file 3-2087-09-01 <strong>Lower</strong> <strong>Byersville</strong> <strong>Creek</strong> <strong>Flood</strong> <strong>Risk</strong> <strong>Mapping</strong> Report Page 6 <strong>of</strong> 9APPENDIX A
APPENDIX A: PHOTOS PROVIDED TO XCG BY ORCA IN LATE 2009 AND EARLY 2010Photos taken July 15, 2009, Exact time <strong>of</strong> day <strong>of</strong> these photos is unknownLansdowne PlaceLooking westward along Lansdowne Street at The Parkway intersectionXCG file 3-2087-09-01 <strong>Lower</strong> <strong>Byersville</strong> <strong>Creek</strong> <strong>Flood</strong> <strong>Risk</strong> <strong>Mapping</strong> Report Page 7 <strong>of</strong> 9APPENDIX A
APPENDIX A: PHOTOS PROVIDED TO XCG BY ORCA IN LATE 2009 AND EARLY 2010Photos taken July 15, 2009, Exact time <strong>of</strong> day <strong>of</strong> these photos is unknownJohnston Drive outlet to Otonabee RiverLooking at downstream face <strong>of</strong> Con-Span culvert under Johnston Rd (flow into Otonabee River)XCG file 3-2087-09-01 <strong>Lower</strong> <strong>Byersville</strong> <strong>Creek</strong> <strong>Flood</strong> <strong>Risk</strong> <strong>Mapping</strong> Report Page 8 <strong>of</strong> 9APPENDIX A
APPENDIX A: PHOTOS PROVIDED TO XCG BY ORCA IN LATE 2009 AND EARLY 2010Photos taken July 15, 2009, Exact time <strong>of</strong> day <strong>of</strong> these photos is unknownSubmerged inlet <strong>of</strong> Johnston Road culvertLooking upstream at <strong>Byersville</strong> <strong>Creek</strong>, from Johnston RoadXCG file 3-2087-09-01 <strong>Lower</strong> <strong>Byersville</strong> <strong>Creek</strong> <strong>Flood</strong> <strong>Risk</strong> <strong>Mapping</strong> Report Page 9 <strong>of</strong> 9APPENDIX A
<strong>City</strong> <strong>of</strong> Peterborough<strong>Lower</strong> <strong>Byersville</strong> <strong>Creek</strong> <strong>Flood</strong>-<strong>Risk</strong> <strong>Mapping</strong> <strong>Update</strong>APPENDICESAPPENDIX BHAND-OUT QUESTIONNAIRE DELIVERED TOLOCAL RESIDENCES IN FEBRUARY 20103-2087-09-01/R_3-04108226_<strong>Byersville</strong> <strong>Creek</strong> <strong>Mapping</strong> <strong>Update</strong>08/11/10B
APPENDIX BHAND-OUT QUESTIONNAIRE DELIVERED TO LOCAL RESIDENCESFEBRUARY 2010In February 2010, XCG Consultants prepared and distributed a questionnaire to local residentswithin the residential area south <strong>of</strong> the former CNR rail line. The purpose <strong>of</strong> the questionnairewas to gather further information on the flood event <strong>of</strong> July 14-15, 2004, particularly withrespect to where surface flow and surface flooding had happened in the area.The following items are included in this appendix:1. A copy <strong>of</strong> the questionnaire (3 pages including map, see below) that was handed outdoor-to-door within the area. Distribution took place on February 10, 2010.2. A map showing where the questionnaire was distributed. A total <strong>of</strong> 250 copies <strong>of</strong> thequestionnaire were distributed.3. A table summarizing the comments and information received. A total <strong>of</strong> 13 responseswere received, one by e-mail and the remainder by regular post.4. As noted in the table, a few photos were submitted with some <strong>of</strong> the responses. Thesephotos are also included here.XCG file 3-2087-09-01 APPENDIX B Page 1 <strong>of</strong> 9Residents Survey Questionnaire
February 9, 2010Dear Resident,XCG Consultants Ltd. (an engineering consulting firm) has been retained by the <strong>City</strong> <strong>of</strong>Peterborough’s Utility Services Department to update the flood-risk map for <strong>Byersville</strong> <strong>Creek</strong>.The flood-risk map identifies areas that may be subject to risk <strong>of</strong> surface flooding during a rarerainfall event known as the Regional Storm. For Peterborough, the Regional Storm is anhistorical rain event known as the “Timmins” storm that occurred in 1961. This rainfall waslarger than rainfall that caused extensive flooding in Peterborough on July 14-15, 2004.To assist with the update, XCG wishes to obtain information from residents in your area aboutthe extent <strong>of</strong> surface flooding and run<strong>of</strong>f flow during the event <strong>of</strong> July 14-15, 2004. Currently,we have some photos from July 15, 2004, obtained from the Otonabee Region ConservationAuthority and the <strong>City</strong> <strong>of</strong> Peterborough, showing surface flooding along Erskine Avenue, alongCrawford Drive and along Orpington Road.We wish to obtain any additional photos or recollections you may have regarding the July 2004flood. Information we are interested in includes depth <strong>of</strong> flood water, duration <strong>of</strong> flooding, anddirection <strong>of</strong> flow. One particular question we have is: Did water flow southward over top <strong>of</strong>what is now the recreational pathway (former CNR rail line) and flow on to Orpington Road, orCameron Street or Mountain Ash Road?Please see the attached map. You can sketch on it any information you have about where thewater flowed, and where flooding happened, and then mail it back to us, along with anycomments or photos you may have. Or you can e-mail to us if you like. Please see our addressbelow.We appreciate any information you can provide. The information will be used to help verify thatour flood mapping is accurate.Yours truly,Harold Chard, P.Eng.,XCG Consultants Litd.,2620 Bristol Circle,Oakville, Ontario L6H 6Z7E-mail: haroldc@xcg.comPhone : 905-829-8880 x239XCG file 3-2087-09-01 PAGE 1 <strong>of</strong> 3
XCG file 3-2087-09-01 PAGE 2 <strong>of</strong> 3
MOUNTAIN ASH RDBARNES CRROBERT RDERSKINE AVTHE QUECROWN DRMCKELLAR STEXAMINER DITCHKAWARTHA BATTERY671 ERSKINE AVEGILLESPIE AVQUEENSWAY CTKENNER COLLEGIATEVOCATIONAL INSTITUTERECREATIONAL PATHWAY (FORMER CNR LINE)CAMERONST PARKORPINGTON RDCAMERON STFGROVE PUBLICSCHOOLBELLAIRE STMASTERBRANDCABINETSBARBARA CRCRAWFORD PLCRAWFORD DRSTOCKER RDBYERSVILLE CREEK0 25 50 100 150 200Meters
MAP SHOWING EXTENT OF HAND-OUT DISTRIBUTION OF THE QUESTIONNAIREXCG file 3-2087-09-01 APPENDIX B Page 5 <strong>of</strong> 9Residents Survey Questionnaire
ResponseNo.XCG file 3‐2087‐09‐01Project Title<strong>Lower</strong> <strong>Byersville</strong> <strong>Creek</strong> <strong>Flood</strong>‐risk <strong>Mapping</strong> <strong>Update</strong>Client<strong>City</strong> <strong>of</strong> Peterborough, Mr. Bruno Bianco, P.Eng.SubjectResidents' Survey ResponsesAs <strong>of</strong> April 14, 2010Name Address <strong>Flood</strong>ing Type <strong>Flood</strong>ing Location Measurements Photos/Sketch Comments1 Myles& Valerie Harrison Orpington Rd. Surface Orpington Rd. from CNR Line 4ft (1.22m) depth on the street SketchExtend‐ Approx. 3ft (0.91m) from doorstep2 Barnes Cr. Surface Barnes Cr. To Erskine Ave. "knee" high / could be 2‐3ft3 Mountain Ash Rd. Basement <strong>Flood</strong>ingBack <strong>of</strong> the properties on the west side <strong>of</strong>Mountain Ash 2.5 ft <strong>of</strong> water in the basement Sketch4 Photos‐ View fromLaneway eastNo basement floodingDepth & Horizontal distance can be estimated / No basement floodingNot clear if water entered through windows and/or garage door, or sewer backup. Noinformation on depth <strong>of</strong> surface flooding. Sketch indicates flow north towards Cameron St ‐local grading behind the buildings?SurfaceBack <strong>of</strong> the properties on the west side <strong>of</strong>Mountain AshSketchNo flooding at North end <strong>of</strong> Mountain Ash, surface flooding at the south end. Indicatesflood from the main <strong>Creek</strong>/backwater, as well, as flow from the west along Cameron St.Mountain Ash & Crawford Dr.Water drained‐<strong>of</strong>f approx. 30 min after rain stopped.4 835 Mountain Ash Rd.5 Cameron St./East <strong>of</strong> ErskineSurface & Basement<strong>Flood</strong>ing, incl. SewageWashout at CNR Tracks & Cameron St 12 inches <strong>of</strong> water on Cameron St Berm wash‐out under the tracks Cameron St & CNR (Pathway)Water coming along Erskine Ave. in northdirection from Crawford Dr. and overflowingonto Cameron St. 6‐7inch <strong>of</strong> water in the basement Indicates potential backwater from main creek,Water from west side <strong>of</strong> Cameron contributedto the flooding as well.West side <strong>of</strong> Cameron is lower than east part.6 Cliff & Carol Block 858 Cameron St. Surface Washout at CNR Tracks & Examiner Ditch SketchOrpington Rd, Cameron St, Mountain Ash &Rear yard swaleApprox. within 15ft front and back <strong>of</strong> thepropertyNo basement flooding/property slightly higher than adjacent properties7 Robert Rd. Surface Crawford Dr. & Robert Rd. 3.5 ft depth on Crawford Dr. Sketch Approx. a couple <strong>of</strong> hrs before water levels subsided.8 Stocker Rd. Surface Stocker Rd Sketch Water from main creek9 845 Stocker Rd. Surface Stocker RdWater from main creek came up to 3m 2 photos <strong>of</strong> maininto the back yard. Front yard ‐ water level creek, 1 photo <strong>of</strong>past the tree.street floodingPhotos taken when water was already receding. No indication <strong>of</strong> overflow on Stocker Rdfrom main creek. Mostly street flooding.10 Linda & William Theobald 814 Orpington Rd. Surface Washout at CNR Tracks & Examiner DitchBreach approx. 8 ft wide and 4 ft deep andapprox. 5ft flood depth in the field behindthe property. Approx. 3ft <strong>of</strong> water onOrpington St. Sketch/2 Photos Channel still is full <strong>of</strong> debris.Overflow/Washout at CNR Tracks atintersection with Cameron St & Orpington RdSketch11 525 Robert Rd. Surface Robert RdWater approx. within 15 ft <strong>of</strong> Robert Rdonto the front yard. Sketch Indicated overflow/flow direction from Crwaford Dr. North.12 507 Robert Rd.Surface & basementflooding.Robert Rd13 Ron Geeza 835 Cameron St., Apt. 4 Surface Cameron StWater levels on the street were approx.2.5 to 3 ft deep at the C/L. Most homesreceived approx.1ft to 16 inch. <strong>of</strong> water intheir basementsCNR berm washout‐ approx. 30 inch depthbelow the tracks. Approx. 18‐20 inches <strong>of</strong>depth at the intersection <strong>of</strong> Cameron andErskine Ave. The water did not crestMonaghan St.e‐mailFlows from Crawford Dr. Manholes along the street were lifted. Grading at the back <strong>of</strong> theproperties has been altered by the property owners over the years resulting in ineffectivedrainage even during small storm events. (drainage also includes small drainage pipes).First sign <strong>of</strong> sewer backup observed at about 5:30am. Within 90 minutes water reachedapprox. 16 inch depth (peak WL)Berm wash‐out under the tracks Cameron St & CNR (Pathway). Approximately 20yards <strong>of</strong>material removed by water from under the tracks. At the outlet to Otonabee River, approx.40 ft <strong>of</strong> water jet from the culvert into the river.
PHOTOS THAT ACCOMPANIED SURVEY RESPONSES:Surface flooding on BarnesCrescent, at north intersectionwith Erskine Ave. In the bottomphoto, the pickup truck issouthbound on Erskine. Publicschool is in the background.XCG file 3-2087-09-01 APPENDIX B Page 7 <strong>of</strong> 9Residents Survey Questionnaire
XCG file 3-2087-09-01 APPENDIX B Page 8 <strong>of</strong> 9Residents Survey QuestionnaireWater level in main channel <strong>of</strong><strong>Byersville</strong> <strong>Creek</strong> immediatelysouth <strong>of</strong> Stocker Road, sometime after the peak <strong>of</strong> the event<strong>of</strong> July 2004.
Surface flooding on Stocker Road (south west corner). Resident reported that mainsource <strong>of</strong> water was from the <strong>Byersville</strong> <strong>Creek</strong> channel (flow between the houses)XCG file 3-2087-09-01 APPENDIX B Page 9 <strong>of</strong> 9Residents Survey Questionnaire
<strong>City</strong> <strong>of</strong> Peterborough<strong>Lower</strong> <strong>Byersville</strong> <strong>Creek</strong> <strong>Flood</strong>-<strong>Risk</strong> <strong>Mapping</strong> <strong>Update</strong>APPENDICESAPPENDIX CUPDATE OF PCSWMM MODEL(HYDROLOGY AND FLOW ROUTING)3-2087-09-01/R_3-04108226_<strong>Byersville</strong> <strong>Creek</strong>_<strong>Mapping</strong> <strong>Update</strong>04/16/10C
APPENDIX CUPDATE OF PCSWMM MODELC.1 Overview:As part <strong>of</strong> the <strong>Byersville</strong>/ Harper <strong>Creek</strong> <strong>Flood</strong> Reduction Study, a computer model <strong>of</strong> watershedhydrology and watercourse hydraulics was developed. The model was developed using the U.S.EPA’s Stormwater Management Model Version 4 (Huber et al., 1988), operated using thePCSWMM2005 interface.Development and application <strong>of</strong> the model is described in detail in the <strong>Byersville</strong>/Harper <strong>Creek</strong><strong>Flood</strong> Reduction Study Final Report (April 2009) prepared by XCG Consultants Ltd., for the<strong>City</strong> <strong>of</strong> Peterborough.In summary, the model is as follows:1. For modelling purposes, the watershed was subdivided into 42 constituent subcatchmentsbased on considering topography and drainage systems.2. Computation <strong>of</strong> run<strong>of</strong>f hydrographs from each <strong>of</strong> these areas is carried out using theRUNOFF object in PCSWMM2005.3. Addition <strong>of</strong> these flows and routing through the upper watershed (above ClonsillaAvenue) is carried out using the TRANSPORT object in PCSWMM2005.4. For the lower portion <strong>of</strong> the watershed (below Clonsilla Avenue), flows are added androuted using the EXTRAN object <strong>of</strong> PCSWMM2005. The EXTRAN object provides fulldynamic routing <strong>of</strong> flows and accounts for storage effects associated with channel orfloodplain storage. The EXTRAN object allows for representation <strong>of</strong> backwater effectsand <strong>of</strong> impacts <strong>of</strong> flood conditions in the main outlet channels on conditions withintributary storm sewer systems.For the purposes <strong>of</strong> updating the flood-risk mapping for the lower <strong>Byersville</strong> <strong>Creek</strong> watershed(i.e. below Lansdowne Street West), it was necessary to make some modifications to the modelto better represent surface flow patterns that were reported to have occurred during the floodevent <strong>of</strong> July 14-15, 2004, with respect to the residential area south <strong>of</strong> the former CNR rail tracks(now a recreational pathway) in the area <strong>of</strong> Orpington Road, Cameron Street, Mountain AshRoad, Erskine Avenue, and vicinity.C.2 Model ModificationsThe modifications consisted <strong>of</strong> the following:XCG file 3-2087-09-01 APPENDIX C Page 1 <strong>of</strong> 11Aug 11, 2010<strong>Update</strong> <strong>of</strong> PCSWMM Model
C.2.1 Subcatchment Refinements:Refinement <strong>of</strong> subcatchment delineations to better represent flow distribution along the system,as follows (See Figure C-1):• Subcatchment 5 was subdivided into two catchment areas (5A and 5B; see Figure C-1) withtheir location <strong>of</strong> outflow to <strong>Byersville</strong> <strong>Creek</strong> being as indicated on Figure C-2 (modelschematic diagram) presented below.• Subcatchment 8 was subdivided into subcatchments 8A (west <strong>of</strong> Erskine Ave) and 8B (east <strong>of</strong>Erskine Ave) to better discriminate between areas draining directly into the Examiner Ditch,versus area that drains into the Erskine Avenue storm sewer upstream <strong>of</strong> the Examiner Ditchinflow to the sewer.C.2.2 Additional <strong>of</strong> Hydraulic Routing Elements:A detailed elsewhere in this report, investigations including survey <strong>of</strong> local residents werecompleted to obtain further information on where surface flooding and surface flow happened inthe event <strong>of</strong> July 14-15, 2004, particularly in the area south <strong>of</strong> the former CNR line. It wasdetermined that flow had overtopped the former CNR line and contributed to surface flow andflooding in the area to the south. A number <strong>of</strong> flow routes were reported by local residents andconfirmed from available photographs from various sources including ORCA and local residents.These include:• Flow overtop <strong>of</strong> and some washout <strong>of</strong> the former CNR rain embankment at the east end <strong>of</strong>Cameron Street, and in the vicinity <strong>of</strong> the east end <strong>of</strong> Orpington Road (where the ExaminerDitch makes a 90 o turn to the east)• Surface flow along Orpington Road, Cameron Street, Erskine Avenue, Crawford Drive; andfrom Crawford Drive onto Mountain Ash Road and once Robert Road.• Surface flooding and flow along Stocker Road and along Barnes Crescent.Details <strong>of</strong> the available observations are provided on a map figure elsewhere in this report.On this basis, and using review <strong>of</strong> available topographic and ground survey information, anumber <strong>of</strong> hydraulic elements were added to the PCSWMM2005 EXTRAN object.Figure C-2 provides a schematic diagram <strong>of</strong> the modified model that depicts the various elementsthat have been included to represent the various observed and potential overland flow paths inthe area south <strong>of</strong> the former CNR line.XCG file 3-2087-09-01 APPENDIX C Page 2 <strong>of</strong> 11Aug 11, 2010<strong>Update</strong> <strong>of</strong> PCSWMM Model
Figure C-1Subcatchment Boundaries forPCSWMM Run<strong>of</strong>f Model<strong>Update</strong>d April 2010LILY LAKE RD!(FAIRBAIRN STLegend4!( OutfallsStorm SewersCHEMONG RD!(!(WatercoursesWaterbodies15!(!(Drainage BoundaryRailwayACKISON RDMONAGHAN RDPARKHILL RD!(!(!(28!(StreetsLot LinesWELLER STPARK STElevation ContoursWALLIS DRFAIR AVE!(!(Cedar GroveSWM Pond!(1816!(!(!(!(!(25CHARLOBREALEY DR!(192034!(Kawartha HeightsPark Pond!(1731!(!(!(372135!(29HIGH STERBROOKE ST13GolfCoursePond30!(!(36GOODFELLOW RD23!(!(!(27!(24!(33321439!(1!( !( !(!(!(!(26!(!(!(!(!(!( !(!(!(98.1LANSDOWNEERSKINE AVE382240RYE ST10!(!(!(8.212416!(!(11!(DOBBIN RDBREALEY DRDobbin RoadSWM Pond!(!(!(SPILLSBURY DR!(College ParkSWM Pond!(!(!(!(!(DRARKWAY75.2!(5.1CRAWFORD DR!(43!(!(0 400 800Meters2!(!(
FIGURE C-2: SCHEMATIC OF MODIFIED PCSWMM EXTRAN MODEL, <strong>Lower</strong> <strong>Byersville</strong> <strong>Creek</strong> watershedXCG file 3-2087-09-01 APPENDIX C Page 4 <strong>of</strong> 11Aug 11, 2010<strong>Update</strong> <strong>of</strong> PCSWMM Model
C.3 Model Application and ResultsC.3.1 Rainfall InputsThe modified PCSWMM model was used to simulate flow hydrographs for two events:• The event <strong>of</strong> July 14-15, 2004• The Regional Storm event, referred to as the Zone 3 Regional Storm or the “Timmins event”,as prescribed for flood-risk mapping studies by the technical guidelines published by theOntario Ministry <strong>of</strong> Natural Resources (OMNR, 2002).The rainfall data used to model the July 2004 event was developed from radar rainfall intensitydata supplied by the <strong>City</strong> <strong>of</strong> Peterborough during the <strong>Byersville</strong>/Harper <strong>Creek</strong> <strong>Flood</strong> ReductionStudy. As documented in the <strong>Byersville</strong>/Harper <strong>Creek</strong> <strong>Flood</strong> Reduction Study Report, AppendixF, XCG Consultants reviewed the radar rainfall data for a set <strong>of</strong> 1-km 2 radar grid cells thatencompass the <strong>Byersville</strong> <strong>Creek</strong> watershed. The radar rainfall data were scaled to provide eventtotal rainfall that matches with available ground measurements <strong>of</strong> rainfall amount. The result <strong>of</strong>this analysis was development <strong>of</strong> a rainfall time series comprised on rain amounts for each 10-minute interval, describing the rainfall that occurred over the <strong>Byersville</strong> <strong>Creek</strong> watershedbetween 4:00 on July 14, 2004 and 22:00 on July 15, 2004, with the total rainfall amount being151.3 mm. See event plot below.Rainfall <strong>of</strong> July 14-15, 2004 over <strong>Byersville</strong> <strong>Creek</strong> watershedXCG file 3-2087-09-01 APPENDIX C Page 5 <strong>of</strong> 11Aug 11, 2010<strong>Update</strong> <strong>of</strong> PCSWMM Model
For the Regional Storm, the event rainfall was as described in the Ontario Ministry <strong>of</strong>Transportation Drainage Manual, Chapter H (Design Chart H3-3a) for the Zone 3 RegionalStorm, consisting <strong>of</strong> 193 mm <strong>of</strong> rainfall in 12 hours.A comparison the Regional Storm with the July 2004 event is provided below.Comparison <strong>of</strong> rainfall <strong>of</strong> July 14-15, 2004over <strong>Byersville</strong> <strong>Creek</strong> with Zone 3 Regulatory eventJuly 14-15, 2004 Event Over<strong>Byersville</strong> <strong>Creek</strong> WatershedRegulatory TimminsStormTotal event 151 mm in 42 hours 193 mm in 12 hrsMaximum amount in 1 hour 46 mm 43 mmMaximum amount in 2 hours 71 mm 63 mmMaximum amount in 6 hours 98 mm 132 mmMaximum amount in 12 hours 118 mm 193 mmBased on the above table alone, it is not immediately apparent as to whether the July 2004 eventwould be a more severe event over <strong>Byersville</strong> <strong>Creek</strong> watershed than the Timmins event. At the1-hour and 2-hour durations, the July 2004 event was more intense. As noted in the 1990 <strong>Flood</strong><strong>Risk</strong> <strong>Mapping</strong> Study, and also determined by modelling during the <strong>Byersville</strong>/Harper <strong>Creek</strong><strong>Flood</strong> Reduction Study (XCG, 2009), this is the range <strong>of</strong> critical storm duration for the<strong>Byersville</strong> <strong>Creek</strong> watershed.XCG file 3-2087-09-01 APPENDIX C Page 6 <strong>of</strong> 11Aug 11, 2010<strong>Update</strong> <strong>of</strong> PCSWMM Model
C.3.2 Model Results for Event <strong>of</strong> July 2004Figure C-3 presents peak flows computed by the PCSWMM2005 EXTRAN model <strong>of</strong> <strong>Lower</strong><strong>Byersville</strong> <strong>Creek</strong>, for the event <strong>of</strong> July 14-15, 2004. This figure provides a detailed examination<strong>of</strong> simulated peak flows within the area south <strong>of</strong> Lansdowne Street West.The peak flows from the PCSWMM2005 EXTRAN model were used as input to the steady-stateHEC-RAS model, in order to compute water surface elevations and allow mapping <strong>of</strong> surfaceflooding areas.The performance <strong>of</strong> the PCSWMM EXTRAN model has been assessed by examining how wellit replicates what is known to have actually occurred during the event <strong>of</strong> July 2004. Thisassessment was based on considering the magnitude <strong>of</strong> surface flows computed by the model atvarious locations (e.g. along Orpington Road, Cameron Street, Crawford Drive, ErskineAvenue), and by examining the resulting mapping <strong>of</strong> surface flooding.As indicated on Figure C-3, three separate cases were modelled to help with examining howsensitive the results are to assumptions about what actually happened at some critical locations.• There were reported to have been washouts <strong>of</strong> the former CNR rail embankment at twolocations, and very rough dimensions <strong>of</strong> the washout were provided by local residents.• As well, XCG’s site investigations showed that the location at which the Examiner Ditch flowsinto the Erskine Avenue storm sewer in prone to debris accumulation and blockage. Seephotos below.The model has been used to simulate the flow hydrographs for three scenarios:Case 1Case 2Case 3No washout <strong>of</strong> the former CNR, and no blockage <strong>of</strong> the Erskine Avenue storminlet on Examiner DitchNo washout <strong>of</strong> the former CNR, and 60% blockage <strong>of</strong> the Erskine Avenue storminlet on Examiner DitchRepresentation <strong>of</strong> reported washouts <strong>of</strong> the former CNR, and 60% blockage <strong>of</strong> theErskine Avenue storm inlet on Examiner DitchThe model proved to be most sensitive to the presence or absence <strong>of</strong> the CNR washouts, and lesssensitive to whether there was blockage at the storm sewer inlet.It was found that Case 3 results in the most realistic representation <strong>of</strong> what actually happenedduring the event <strong>of</strong> July 2004, indicating that the reported CNR washouts and resulting flowconveyance from north <strong>of</strong> the CNR to the south were a significant contributing factor to theobserved surface flooding to the south <strong>of</strong> the CNR.Figure 3.2 in the main body <strong>of</strong> this report shows the extent <strong>of</strong> surface flooding for Case 3.XCG file 3-2087-09-01 APPENDIX C Page 7 <strong>of</strong> 11Aug 11, 2010<strong>Update</strong> <strong>of</strong> PCSWMM Model
Photo date May 28, 2007Photo date May 28, 2007Photo date Feb. 5, 2010Photos <strong>of</strong> Debris Accumulation at Examiner Ditch Inlet to Erskine Avenue Storm SewerXCG file 3-2087-09-01 APPENDIX C Page 8 <strong>of</strong> 11Aug 11, 2010<strong>Update</strong> <strong>of</strong> PCSWMM Model
C.3.2 Model Results for Regional Storm EventFigure C-4 presents peak flows computed by the PCSWMM2005 EXTRAN model <strong>of</strong> <strong>Lower</strong><strong>Byersville</strong> <strong>Creek</strong>, for the Regional Storm event.As with the July 2004 event, peak flows from the PCSWMM2005 EXTRAN model were used asinput to the steady-state HEC-RAS model, in order to compute water surface elevations andallow mapping <strong>of</strong> surface flooding areas.The model has been used to simulate the flow hydrographs for the Regional Storm, for threescenarios:Case 1Case 2Case 4No washout <strong>of</strong> the former CNR, and no blockage <strong>of</strong> the Erskine Avenue storminlet on Examiner Ditch; existing twin 2.0-m CSP culverts under CPR east <strong>of</strong> TheParkway (head end <strong>of</strong> Examiner ditch)No washout <strong>of</strong> the former CNR, and 60% blockage <strong>of</strong> the Erskine Avenue storminlet on Examiner Ditch; existing twin 2.0-m CSP culverts under CPR east <strong>of</strong> TheParkway (head end <strong>of</strong> Examiner ditch)Representation <strong>of</strong> reported washouts <strong>of</strong> the former CNR, and 60% blockage <strong>of</strong> theErskine Avenue storm inlet on Examiner Ditch; single 1.0-m culvert under CPReast <strong>of</strong> The Parkway (proposed replacement <strong>of</strong> the existing twin 2.0-m CSPculverts) at head end <strong>of</strong> Examiner ditch.Case 1 has been used for generating updated flood-risk mapping for the existing system. Figure3.3 in the main body <strong>of</strong> this report shows the results for Case 1.Case 2 has been used only to examine model sensitivity to blockage <strong>of</strong> this storm sewer inlet.Case 4 has been examined to determine the net effect <strong>of</strong> the proposed culvert replacement(downsizing) at the top end <strong>of</strong> the Examiner Ditch, on the flood-risk area. Figure 3.4 in the mainbody <strong>of</strong> this report shows the results for Case 4.XCG file 3-2087-09-01 APPENDIX C Page 9 <strong>of</strong> 11Aug 11, 2010<strong>Update</strong> <strong>of</strong> PCSWMM Model
WEBBER AVRYE STMOUNTAIN ASH RDROBERT RDERSKINE AVBARNES CRSURVEY STSTORNOWAY PLIN PLCHAMBERLAIN STARTHUR AVFigure C-3Peak Flows from PCSWMMEXTRAN ModelJuly 15, 2004 Storm EventDUFFUS STBROWN STGRADY AVREYNOLDS CTBROWN STLUNDY'S LNNOBLE PLRALPHSON CRWENTWORTH STGOODFELLOW RDWIGHTMAN AVFORD STNEW ROMAINE STModelling Scenarios:Case 1 - no washout at former CNR,no storm sewer inlet blockageCase 2 - no washout, 60% blockageat Erskine Avenue storm inletCase 3 - same as Case 1, but with CPR3+CPR4replaced by single 1.0m culvertST MARY'S STST MARY'S STMERVIN AVROMAINE ST307330731 - 47.62 - 47.63 - 47.6ARTHUR AVLdwn 30501 - 49.1, 7.52 - 49.1, 7.53 - 49.1, 7.530503025LANSDOWNE30251 - 56.32 - 56.33 - 56.2LegendHarper 11 - 8.882 - 8.883 - 8.88Harper 1233223321 - 44.32 - 44.33 - 44.328831 - 43.32 - 43.33 - 43.32506CPR1 + CPR2(Twin 3.6m CSP culverts)2883CPR1 + CPR21 - 60.702 - 60.703 - 60.7025061 - 43.32 - 43.33 - 43.3Pkwy Sp11 - 12.92 - 12.93 - 12.9Pkwy Sp1CPR3 + CPR4(Twin 2.0m CSP culverts)E2CROWN DRE21 - 12.82 - 12.83 - 12.8E3THE KINGSWAYCPR3 + CPR41 - 12.82 - 12.83 - 12.8E31 - 12.82 - 12.83 - 12.8E6E61 - 10.42 - 10.33 - 10.5THE QUEENSWAYE19BORDEN AVE191 - 2.152 - 1.903 - 1.91E16ERSK61 - 4.712 - 4.743 - 3.08#Peak Flow, Case 1# # #Model Conduit ID andFlow DirectionModel Conduit IDPeak Flow, Case 2Peak Flow, Case 3MCKELLAR STHAWLEY STLITTLE STTHE PARKWAYCrawford1 - 63.22 - 63.43 - 63.122751800bThe Parkway1800a1565aCrawford152722751 - 60.72 - 60.73 - 60.71800b1 - 60.02 - 60.03 - 60.0The Parkway1 - 64.22 - 64.23 - 64.21800a1 - 64.132 - 64.103 - 64.101565a1 - 62.52 - 63.63 - 62.915271 - 63.12 - 63.33 - 63.015401565a1 - 02 - 03 - 0KINGSWAY CTCAMERON PLE131 - 4.202 - 4.303 - 4.10E111 - 3.472 - 3.563 - 3.00E13E11E151 - 0.042 - 0.343 - 1.01QUEENSWAY CTE8E10E16E18RECREATIONAL PATHWAY (FORMER CNR LINE)E15E81 - 10.22 - 9.83 - 10.4E101 - 8.392 - 9.363 - 8.85E141 - 2.582 - 2.493 - 3.48E161 - 2.202 - 3.693 - 5.18E181 - 0.002 - 0.003 - 1.22E14E91 - 3.12 - (-3.1)3 - (-3.0)BYERSVILLE CREEKE9E17E171 - 1.842 - 2.993 - 4.10E20E201 - (-0.25)2 - (-0.17)3 - 1.21STOCKER RDCRAWFORD DRERSK2ERSK3ERSK4ERSK6ERSK7ERSK8ERSK21 - 02 - 03 - 0GILLESPIE AVORPINGTON RDERSK31 - 1.192 - 0.843 - 1.73ERSK41 - 2.192 - 2.273 - 4.64CAMERON STERSK61 - 4.522 - 4.563 - 6.58ERSK71 - 1.732 - 1.773 - 3.06ERSK81 - 3.272 - 3.413 - 6.02BARBARA CRBELLAIRE STCRAWFORD PLNote:Conduits ERSK2 toERSK8 representoverland flow alongErskine Avenue.The EXTRAN Modelalso includes theErskine Avenuestorm sewer fromMcKellar Streetsouth to <strong>Byersville</strong><strong>Creek</strong>.Surcharge <strong>of</strong> thestorm sewer cancontribute tooverland flowalongErskine Avenue.SHIRLEY AVHAROLD PLHARO7 & 115 HY1300b1300b1 - 62.92 - 63.13 - 62.81187 865 0543b 0543a 223 Mghn Outlet11871 - 62.32 - 62.43 - 62.18651 - 62.02 - 62.03 - 61.70543b1 - 62.52 - 62.53 - 62.10543a1 - 71.32 - 71.3JOHNSTON DR3 - 74.22231 - 72.72 - 72.63 - 75.2Outlet1 - 72.72 - 72.63 - 75.2
WEBBER AVRYE STMOUNTAIN ASH RDROBERT RDERSKINE AVBARNES CRSURVEY STSTORNOWAY PLIN PLCHAMBERLAIN STARTHUR AVFigure C-4Peak Flows from PCSWMMEXTRAN ModelRegional Storm EventDUFFUS STBROWN STGRADY AVREYNOLDS CTBROWN STLUNDY'S LNNOBLE PLRALPHSON CRWENTWORTH STGOODFELLOW RDWIGHTMAN AVFORD STNEW ROMAINE STModelling Scenarios:Case 1 - no washout <strong>of</strong> former CNR,no storm sewer inlet blockageCase 2 - no washout, 60% blockageat Erskine Avenue storm inletCase 4 - same as Case 1, but with CPR3+CPR4replaced by single 1.0m culvertST MARY'S STST MARY'S STMERVIN AVROMAINE ST307330731 - 47.42 - 47.14 - 47.1ARTHUR AV30503025LANSDOWNE30251 - 55.22 - 55.54 - 55.2LegendHarper 11 - 8.82 - 8.84 - 8.8Harper 1233223321 - 44.12 - 44.34 - 44.128831 - 43.12 - 43.14 - 43.12506CPR1 + CPR2(Twin 3.6m CSP culverts)288325061 - 43.12 - 43.14 - 43.1CPR1 + CPR21 - 60.82 - 61.04 - 60.8Pkwy Sp11 - 12.102 - 12.364 - 12.10Pkwy Sp1CPR3 + CPR4(Twin 2.0m CSP culverts)E2CROWN DRE21 - 11.82 - 11.94 - 5.30E3THE KINGSWAYCPR3 + CPR41 - 11.82 - 11.94 - 5.30E6E61 - 9.62 - 9.64 - 5.1THE QUEENSWAYE19BORDEN AVE191 - 1.952 - 1.644 - 1.82E16ERSK61 - 4.712 - 4.744 - 3.08#Peak Flow, Case 1# # #Model Conduit ID andFlow DirectionModel Conduit IDPeak Flow, Case 2Peak Flow, Case 4MCKELLAR STHAWLEY STLITTLE STTHE PARKWAYCrawford1 - 62.62 - 62.74 - 61.622751800bThe Parkway1800a1565aCrawford152722751 - 60.82 - 61.14 - 60.81800b1 - 59.52 - 59.84 - 59.1The Parkway1 - 63.42 - 63.94 - 63.41800a1 - 63.32 - 63.94 - 63.31565a1 - 64.02 - 63.34 - 62.515271 - 62.52 - 62.64 - 61.615401565a1 - 02 - 04 - 0KINGSWAY CTCAMERON PLE131 - 3.732 - 3.824 - 2.66E111 - 3.382 - 3.484 - 2.94E13E11E151 - 0.002 - 0.124 - 0.00QUEENSWAY CTE8E10E16E18RECREATIONAL PATHWAY (FORMER CNR LINE)E15E81 - 9.232 - 9.254 - 5.20E101 - 7.482 - 8.344 - 3.76E141 - 2.852 - 2.494 - 1.60E161 - 1.282 - 2.744 - 0.50E181 - 02 - 04 - 0E14E91 - 2.52 - (-3.0)4 - 3.3BYERSVILLE CREEKE9E17E171 - 1.272 - 2.464 - 0.44E20E201 - (-0.20)2 - (-0.97)4 - 0.08STOCKER RDCRAWFORD DRERSK2ERSK3ERSK4ERSK6ERSK7ERSK8ERSK21 - 02 - 04 - 0GILLESPIE AVORPINGTON RDERSK31 - 1.362 - 0.964 - 0.90ERSK41 - 2.052 - 2.134 - 0.75CAMERON STERSK61 - 4.712 - 4.744 - 3.08ERSK71 - 1.862 - 2.004 - 0.95ERSK81 - 4.032 - 3.914 - 1.75BARBARA CRBELLAIRE STCRAWFORD PLNote:Conduits ERSK2 toERSK8 representoverland flow alongErskine Avenue.The EXTRAN Modelalso includes theErskine Avenuestorm sewer fromMcKellar Streetsouth to <strong>Byersville</strong><strong>Creek</strong>.Surcharge <strong>of</strong> thestorm sewer cancontribute tooverland flowalongErskine Avenue.SHIRLEY AVHAROLD PLHARO7 & 115 HY1300b1187 865 0543b 0543a 223 Outlet11871 - 61.92 - 62.04 - 61.18651 - 61.72 - 61.74 - 60.80543b1 - 62.52 - 62.44 - 61.60543a1 - 72.32 - 72.1JOHNSTON DR4 - 68.62231 - 73.52 - 72.54 - 69.7Outlet1 - 73.52 - 72.54 - 69.7
<strong>City</strong> <strong>of</strong> Peterborough<strong>Lower</strong> <strong>Byersville</strong> <strong>Creek</strong> <strong>Flood</strong>-<strong>Risk</strong> <strong>Mapping</strong> <strong>Update</strong>APPENDICESAPPENDIX DHEC-RAS MODEL DETAILS3-2087-09-01/R_3-04108226_<strong>Byersville</strong> <strong>Creek</strong>_<strong>Mapping</strong> <strong>Update</strong>08/11/10D
APPENDIX DUPDATE OF HEC-Ras MODELD.1 Overview:In order to conduct the analysis <strong>of</strong> flood levels in the lower area <strong>of</strong> <strong>Byersville</strong> <strong>Creek</strong>, existing hydraulic models approved and providedby the local Conservation Authority were screened, modified and applied, as applicable. The overall HEC-Ras model <strong>of</strong> the study areahas three (3) distinctive components:1. Main Branch <strong>of</strong> <strong>Byersville</strong> <strong>Creek</strong> from Clonsilla Ave. to the outlet at Otonabee River2. Examiner Ditch, between CPR track and Erskine Ave; and3. CNR Ditch representing a spill path from Examiner Ditch along the former CNR tracks to Main <strong>Creek</strong> upstream <strong>of</strong> CrawfordDr.In addition, a new model section was developed for the area immediately south <strong>of</strong> CNR tracks and east <strong>of</strong> Erskine Ave to evaluatespills from Examiner Ditch over the CNR berm. This fourth (4 th ) model is referred to as the <strong>Lower</strong> Spill model (CNR Spill Area).Figures D-1 to D4 provides a schematic <strong>of</strong> the above noted HEC-Ras model components.Upon review and updates <strong>of</strong> existing models, baseline condition models were established for further hydraulic analysis. The baselineconditions for the CNR spill area has been determined by refining model parameters to achieve observed flood records (within reason)during the July 15 th 2004 storm event, using flows generated using PCSWMM watershed model.A number <strong>of</strong> modeling assumptions and pr<strong>of</strong>essional judgment based on experience and field observations were applied to completethe hydraulic analysis and determine the extent <strong>of</strong> flooding. The modeling scenarios summarized in Table D-1 were used to generateflood levels at key locations.FIGURE D-1 <strong>Byersville</strong> <strong>Creek</strong> - Main BranchFIGURE D-2 Examiner Ditch modelXCG file 3-2087-09-01 APPENDIX D Page 1 <strong>of</strong> 16<strong>Update</strong> <strong>of</strong> HEC-Ras Model
FIGURE D-3 Examiner Ditch West Spill model: Spill along CNR towards Crawford Dr.FIGURE D-4 <strong>Lower</strong> Spill model : CNR Spill Area – Spill towards Erskine Ave.D.2 Model ModificationsIn summary, the model(s) modifications consisted <strong>of</strong> the following:1. New cross-sections were generated using DEM model and/or survey information;2. Local modification to existing cross-sections were applied to better represent intent <strong>of</strong> this analysis;3. “n” values and contraction/expansion coefficients were updated, where applicable;4. Reduction in storage areas due to building structures and/or local storage areas accounted for in the PCSWMM model wereapplied, where applicable;5. Weirs were incorporated at identified spill/hydraulic connectivity locations for verification purposes;6. Starting water levels were evaluated and selected as per attached Table D-2;7. CPR culvert structures were updated, as required, to reflect modelling scenarios.D.3 Model verification – CNR Spill AreaThe verification <strong>of</strong> flood levels in the lower area <strong>of</strong> <strong>Byersville</strong> <strong>Creek</strong>, especially in the spill area south <strong>of</strong> the CNR tracks, wascompleted using available flood records. Estimated flow depths, flow directions, extent <strong>of</strong> flooding, high water marks were reviewedand used as reference to simulate similar water level conditions using July 14-15, 2004 flows.Iteration <strong>of</strong> water levels at locations representing hydraulic connectivity (e.g. at the Parkway), including spills and/or temporary redirection<strong>of</strong> flows from the main creek, backwater effect, was performed to achieve reasonable water levels as per observed records, aswell as, balanced water levels within the HEC-Ras model at the points <strong>of</strong> model intersections/convergence.D.4 Model ResultsThe summary <strong>of</strong> modelling results, including key parameters such, applied flow, computed water level, flood width and flow velocityat each cross-section is presented in the attached Tables D-3 to Table D-14.A visual representation <strong>of</strong> the estimated extent <strong>of</strong> flooding during the Regional (Timmins) Storm event is provided in Figure 3.3 andFigure 3.4 in the main report. The key modelling scenarios used to simulate the flooding conditions are Case 1 and Case 4, asdiscussed in the main report.Accordingly, Figure 3.3 presents the results <strong>of</strong> flooding conditions within the study area during July 14-15, 2004 storm event usingCase 3 modelling scenario.XCG file 3-2087-09-01 APPENDIX D Page 2 <strong>of</strong> 16<strong>Update</strong> <strong>of</strong> HEC-Ras Model
Table D-2: Starting water elevations applied in HEC-RAS modelsModel # Location Storm EventModellingScenario/CaseHEC-RasCross-Sec.WL Comment 1 Comment 21<strong>Byersville</strong> <strong>Creek</strong> Main Branch: Clonsill Avenue toOutlet at Otonabee RiverJuly 14-15, 2004<strong>Flood</strong>ing Event3 18 186.75A summer navigable water elevation on the OtonabeeRiver as per Note 1. A critical depth occurs at theculvert, thus, upstream water levels are not affectedby downstream water levels during significant flowevents such as Regional and July 2004 events.ORCA Model: used mean WLs on Otonabee River/ Allsections looking upstream/Base geometry from1990&1996. Local updates from site developmentapplications.Timmins RegionalStorm1 & 4 18 187.00Estimated high water level on Otonabee River duringMarch 1999 was applied. Note 3.2 Lwer Spill. Model: Southeast <strong>of</strong> former CNR lineJuly 14-15, 2004<strong>Flood</strong>ing Event3 543 190.36Downstream water level based on estimated waterlevel along the main creekReference xsec. 543 - Main Ck model3 450CriticalDepthUpstream water levels estimated on the south side <strong>of</strong>CNR using PCSWMM model. Critical depth occurs inHEC-Ras model.WL at extension <strong>of</strong> the Examiner Ditch = 191.51m; WL atCameron St = 191.67mTimmins RegionalStorm1 & 4 543 190.37Downstream water level based on estimated waterlevel along the main creekReference xsec. 0+543 - Main Ck model1 & 4 450CriticalDepthUpstream water levels estimated on the south side <strong>of</strong>CNR using PCSWMM model. Critical depth occurs inHEC-RAS model.Case 1: WL at extension <strong>of</strong> the Examiner Ditch =191.47m; WL at Cameron St = 191.48m; Case 4:Negligeble spill at Cameron St at CNR tracks3Examiner Ditch Model: From CPR trackssouthward to inlet to Erskine Avenue storm sewerJuly 14-15, 2004<strong>Flood</strong>ing Event3 1050 192.01 Water levels estimated using PCSWMM model.1 & 4 1050 RC Rating Curve as per D.M. Willis HEC-RAS modelTimmins RegionalStorm1 & 4 1050 RC Rating Curve as per D.M. Willis HEC-RAS model4Examiner Ditch West Spill Model: Spill flow fromExaminer Ditch southwestward along former CNRrail lineJuly 14-15, 2004<strong>Flood</strong>ing Event3 1327 192.01Water levels estimated using HEC-RAS "ExistingExaminer Ditch" modelNode 9 in PCSWMM ModelTimmins RegionalStorm1 & 4 1327 191.95Water levels estimated using HEC-RAS "ExistingExaminer Ditch" modelNode 9 in PCSWMM ModelNotes:1. Starting water surface elevations at the outlet <strong>of</strong> <strong>Byersville</strong> <strong>Creek</strong>, as per "<strong>Byersville</strong> <strong>Creek</strong> Two-Zone Concept Assessment for <strong>Flood</strong>plain Planningand Encroachment Analysis"; Greenland International Consulting (Sept. 2003)188.50 m <strong>Flood</strong> Stage on Otonabee River186.75 m A summer navigable water elevation on the Otonabee River (similar to 1990 Peterborough <strong>Flood</strong> <strong>Risk</strong> <strong>Mapping</strong> Study).This elevation was applied to derive a rating curve at the outlet for unsteady flow analysis.2. Estimated water level at the Beyersville <strong>Creek</strong> outlet during the July 14-15, 2004 storm event using high water marks189.6 m Monaghan Rd. Debris line, as per "July 2004 <strong>Flood</strong>" Report; John W. Merriam & Associates (2005)High water mark record at Johnston Drive outlet "High Water Mark Description- Peterborough <strong>Flood</strong>";John W. Merriam & Associates (May 2005).189.3 m South armour stone plus 0.3m - elevation estimated using culvert data (record drawing)3. Culvert Data - Outlet to Otonabee RiverTop <strong>of</strong> RoadTop <strong>of</strong> StructureTop <strong>of</strong> ArmourSummer Water Level VarianceWater Level March 24, 1999190.97 m188.90 m189.00 m186.59 m186.72 m186.895 mRef. Dwg. 2335SP01-PUCU2; Sheet No.1 (March 2000)
TABLE D-3HEC-RAS RESULTS for EVENT OF JULY 14-15, 2004Model Scenario Case 3: Washouts at former CNR modelled, and 60% blockage <strong>of</strong> Erskine Avenue storm inletMAIN BRANCH Model ‐ CASE 3River Sta Pr<strong>of</strong>ile Q Total Min Ch El W.S. Elev Crit W.S. E.G. Elev E.G. Slope Vel Chnl Flow AreaTop Froude #Width Chl(m3/s) (m) (m) (m) (m) (m/m) (m/s) (m2) (m)3645 July 15 2004 37.2 199.17 200.37 200.37 200.77 0.013833 2.79 13.34 16.84 13554 July 15 2004 47.6 197.06 198.79 198.83 199.36 0.014091 3.35 14.22 14.01 1.063390 July 15 2004 56.2 194.79 196.74 197.08 197.44 0.009629 4.25 18.68 29.05 0.993165 July 15 2004 56.2 193.68 196.25 195.9 196.3 0.000905 1.47 70.64 243.57 0.313073 July 15 2004 56.2 193.29 196.15 195.33 196.2 0.001195 1.37 75.64 145.53 0.263068 July 15 2004 56.2 193.29 196.15 195.81 196.2 0.000347 1.37 122.69 216.78 0.263047 Lansdowne Bridge3026 July 15 2004 56.2 193.23 195.81 195.81 196.02 0.001255 2.47 59.33 152.72 0.493025 July 15 2004 56.2 193.23 195.76 195.27 195.78 0.000769 1.04 84.45 194.34 0.213023 July 15 2004 56.2 193.23 195.76 195.26 195.78 0.000622 0.93 84.47 193.77 0.193009 July 15 2004 56.2 193.23 195.75 195.26 195.77 0.000648 0.95 83.27 189.91 0.192999 July 15 2004 56.2 193.23 195.74 195.26 195.77 0.000669 0.96 82.39 188.47 0.22993 July 15 2004 56.2 193.23 195.73 195.26 195.76 0.000682 0.97 81.84 187.54 0.22986 July 15 2004 56.2 193.23 195.73 195.26 195.76 0.000698 0.98 81.21 226.35 0.22969 July 15 2004 56.2 193.08 195.74 195.75 0.000118 0.46 166.46 304.31 0.092961 July 15 2004 56.2 193.08 195.74 195.75 0.000135 0.58 166.03 299.02 0.112947 July 15 2004 56.2 192.9 195.74 195.74 0.00011 0.47 213.4 342.21 0.092940 July 15 2004 56.2 192.9 195.74 194.59 195.74 0.000093 0.43 205.89 243.61 0.082939 July 15 2004 56.2 192.9 195.74 194.59 195.74 0.000116 0.48 188.78 243.23 0.092917 July 15 2004 56.2 192.9 195.73 194.6 195.74 0.000106 0.46 205.21 243.57 0.092889 July 15 2004 56.2 192.9 195.73 195.74 0.000076 0.39 257.14 337.02 0.072883 July 15 2004 56.2 192.25 195.73 194.24 195.74 0.000069 0.42 225.19 260.97 0.082703 July 15 2004 56.2 192.01 195.72 195.72 0.000053 0.44 199.42 318.93 0.082662 July 15 2004 56.2 191.95 195.71 195.72 0.000098 0.64 157.84 121.92 0.112512 July 15 2004 56.2 191.5 195.71 195.71 0.000036 0.43 251.95 172.23 0.072506 July 15 2004 43.3 191.2 195.71 195.71 0.000038 0.45 185.5 143.14 0.072332 July 15 2004 60.7 190.6 195.7 195.71 0.000033 0.43 242.99 140.53 0.062320 July 15 2004 60.7 190.6 195.68 193.12 195.7 0.000121 0.78 139.11 169.65 0.122310 CPR TRACKS Bridge2300 July 15 2004 60.7 190.3 192.81 192.81 193.8 0.007723 4.4 13.81 38.53 12275 July 15 2004 60.7 189.69 192.93 191.92 193.16 0.001682 2.42 33.92 19.52 0.452148 July 15 2004 60.7 189.6 192.92 191.64 192.98 0.000653 1.19 92.94 148.21 0.252031 July 15 2004 60.7 189.5 192.68 192.85 0.00197 1.81 34.21 21.56 0.431845 July 15 2004 64.2 188.81 192.69 192.71 0.000232 0.99 193.49 457.25 0.171839 July 15 2004 64.2 188.95 192.66 190.33 192.71 0.000178 0.97 66.09 97.85 0.171823 THE PARKWAY Bridge1807 July 15 2004 64.2 188.95 192.36 190.33 192.4 0.000191 0.95 110.56 85.13 0.171800 July 15 2004 64.1 188.68 192.35 192.4 0.000578 1.61 136.07 330.62 0.271765 July 15 2004 64.1 188.82 191.99 191.11 192.33 0.00279 3.21 51.41 407.68 0.581705 July 15 2004 64.1 188.34 191.99 191.34 192.15 0.001777 2.33 74.46 610.72 0.411645 July 15 2004 64.1 188.32 191.67 191.37 191.98 0.003505 3.07 48.39 525.4 0.561585 July 15 2004 64.1 188.29 191.71 191.04 191.8 0.001224 2.18 107.73 410.92 0.381565 July 15 2004 62.9 188.28 191.74 191.77 0.000584 1.52 169.35 277.62 0.271552 July 15 2004 62.9 188.2 191.75 189.52 191.76 0.000029 0.33 231.13 357.31 0.081543 CRAWFORD Culvert1534 July 15 2004 62.9 188.2 191.54 189.52 191.55 0.000045 0.39 173.82 217.87 0.11527 July 15 2004 63.1 188.47 191.53 191.55 0.000297 0.98 165.54 317.72 0.191346 July 15 2004 63.1 188.22 191.45 190.7 191.49 0.00055 1.34 86.89 99.98 0.241322 July 15 2004 63.1 188.08 191.05 191.33 0.002453 2.53 31.07 18.84 0.521305 July 15 2004 62.8 188.2 191.09 191.26 0.00163 2.32 66.76 166.21 0.441187 July 15 2004 62.8 187.54 190.89 191.06 0.001836 2.25 50.91 85.79 0.421025 July 15 2004 62.8 187.44 190.71 190.81 0.001183 1.81 62.02 70 0.33865 July 15 2004 62.8 187.42 190.55 190.62 0.001035 1.64 62.78 44.85 0.31725 July 15 2004 62.1 187.39 190.38 190.48 0.000968 1.5 49.63 31.86 0.32543 July 15 2004 62.1 187.33 190.36 190.38 0.000242 0.89 138.84 193.61 0.17384 July 15 2004 62.1 186.93 190.33 190.34 0.000177 0.75 179.88 390.96 0.13223 July 15 2004 72.7 186.6 190.29 190.31 0.000302 1 177.43 293.28 0.1883 July 15 2004 72.7 186.29 190.26 190.28 0.000144 0.8 149.14 127.6 0.1355 July 15 2004 72.7 186.6 190.26 190.2 190.27 0.000084 0.6 223.33 146.19 0.142.5 JOHNSTON Bridge30 July 15 2004 72.7 186.3 189.14 188.79 189.16 0.000347 1.03 115.66 80.93 0.227 July 15 2004 72.7 186.37 188.15 188.15 188.93 0.012399 3.92 18.54 11.84 124 July 15 2004 72.7 186.3 187.27 187.73 188.79 0.044997 5.48 13.27 14.5 1.8321 July 15 2004 72.7 186.23 186.96 187.43 188.62 0.067276 5.71 12.73 18.1 2.1718 July 15 2004 72.9 186.16 186.8 187.25 188.38 0.074041 5.57 13.09 20.95 2.25
TABLE D-4HEC-RAS RESULTS for EVENT OF JULY 14-15, 2004Model Scenario Case 3: Washouts at former CNR modelled, and 60% blockage <strong>of</strong> Erskine Avenue storm inletRiver Sta Pr<strong>of</strong>ile Q Total Min Ch El W.S. Elev Crit W.S. E.G. Elev E.G. Slope Vel Chnl Flow Area Top Width Froude # Chl(m3/s) (m) (m) (m) (m) (m/m) (m/s) (m2) (m)River Sta Pr<strong>of</strong>ile Q Total Min Ch El W.S. Elev Crit W.S. E.G. Elev E.G. Slope Vel Chnl Flow Area Top Width Froude # Chl(m3/s) (m) (m) (m) (m) (m/m) (m/s) (m2) (m)2050 July 15 2004 12.9 192.9 195.00 193.99 195.04 0.000599 0.82 15.65 111.86 0.211978 July 15 2004 12.8 192.69 194.91 193.57 194.98 0.000551 1.14 11.25 94.81 0.241974 Culvert1964 July 15 2004 12.8 192.6 193.60 193.54 193.97 0.010203 2.72 4.71 17.66 0.91950 July 15 2004 12.8 192.46 193.56 193.65 0.00426 1.9 13.75 30.34 0.591882 July 15 2004 12.8 191.85 193.21 193.21 193.34 0.005135 1.95 12.83 47.91 0.621850 July 15 2004 12.8 191.65 193.08 192.72 193.11 0.001133 1.01 20.57 45.55 0.31800 July 15 2004 12.8 191.35 193.06 193.07 0.000524 0.78 28.69 55.61 0.211777 July 15 2004 12.8 191.22 193.06 192.43 193.06 0.000142 0.2 69.23 175.64 0.11770 Culvert1763 July 15 2004 12.8 191.19 193.06 193.06 0.000011 0.06 283.47 908.01 0.031700 July 15 2004 12.8 191.24 193.06 193.06 0.000021 0.11 224.44 749.38 0.041610 July 15 2004 12.8 191.12 193.05 193.05 0.000066 0.28 161.31 532.98 0.071553 July 15 2004 12.8 191.26 192.96 193.01 0.001251 1.1 14.76 24.7 0.321500 July 15 2004 12.8 191.06 192.95 192.97 0.000354 0.77 21.17 20.48 0.191458 July 15 2004 10.5 190.8 192.87 191.62 192.93 0.0006 1.13 9.27 336.26 0.251442 Culvert1428 July 15 2004 10.5 190.48 192.39 192.49 0.001139 1.42 7.37 77.73 0.341427 Lat Struct1405 July 15 2004 10.5 190.45 192.36 192.44 0.001257 1.41 10.91 12.68 0.341327 July 15 2004 10.4 190.35 192.12 192.22 0.001716 1.53 9.24 11.08 0.391250 July 15 2004 3 190.01 192.08 192.09 0.000167 0.43 8.77 12.32 0.11194 July 15 2004 3 190.28 192.06 191.01 192.08 0.000366 0.63 8.49 67.05 0.161123 July 15 2004 3 190.35 192.03 192.05 0.000524 0.68 8.81 27.23 0.181050 July 15 2004 3 190.67 192.01 191.18 192.02 0.000215 0.36 9.18 12.32 0.12
TABLE D-5HEC-RAS RESULTS for EVENT OF JULY 14-15, 2004Model Scenario Case 3: Washouts at former CNR modelled, and 60% blockage <strong>of</strong> Erskine Avenue storm inletLOWER SPILL Model (south <strong>of</strong> former CNR) ‐ CASE 3U/S Starting WL =Critical Depth D/S Starting WL =190.41TopWidthX‐sec.MaxDepthModelEstimatedDepthRiver Sta Pr<strong>of</strong>ile Q Total Min Ch El W.S. Elev Crit W.S. E.G. Elev E.G. Slope Vel Chnl Flow AreaFroude # ChlGr. Elev. High Water Mark Difference<strong>Flood</strong> Recordreference(m3/s) (m) (m) (m) (m) (m/m) (m/s) (m2) (m) (+/‐) Depth WL As per obtained As per obtainedRiver Sta Pr<strong>of</strong>ile Q Total Min Ch El W.S. Elev Crit W.S. E.G. Elev E.G. Slope Vel Chnl Flow Area Top Width Froude # Chl (m) (m) (m) (m) (m) (m) flood records flood records(m3/s) (m) (m) (m) (m) (m/m) (m/s) (m2) (m)460 Jul‐04 9.8 191.18 191.59 191.45 191.61 0.00076 0.7 57.78 354.09 0.37 0.41 191.4 0.3 191.7 ‐0.11 0.19 ID.4Comment/ <strong>Flood</strong> Recordreference450 Jul‐04 9.8 191.18 191.57 191.6 0.001086 0.8 44.78 351.04 0.44 0.39 190.9 1.1 192 ‐0.43 0.67 ID. 1400 Jul‐04 9.8 191 191.52 191.54 0.000515 0.62 56.16 292.31 0.31 0.52 190.9 0.8 191.7 ‐0.18 0.62 ID. 10Orpington St/Sag elevation inthe middle <strong>of</strong> the rd.Orpington St/Sag elevation inthe middle <strong>of</strong> the rd.Orpington St/Sag elevation in350 Jul‐04 9.8 191.03 191.32 191.32 191.41 0.008777 1.88 31.86 201.26 1.19 0.29 190.9 1.1 192 ‐0.68 0.42 ID. 1the middle <strong>of</strong> the rd.300 Jul‐04 9.8 190.59 191.16 190.92 191.18 0.000394 0.52 38.71 207.12 0.27 0.57 190.85 0.3 191.15 0.01 0.31 ID. 4 Cameron St250 Jul‐04 10.06 190.76 191 191 191.07 0.007947 1.63 36.31 324.67 1.11 0.24 190.76 0.5 191.26 ‐0.26 0.24 ID. 5 & 6Intersection <strong>of</strong> Erskine Ave. &Cameron St200 Jul‐04 10.06 190.35 190.83 190.6 190.84 0.000608 0.63 67.44 288.19 0.33 0.48 190.35 0.9 191.25 ‐0.42 0.48 ID.2 Barnes Cr150 Jul‐04 10.06 190.34 190.63 190.61 190.71 0.007116 1.46 24.81 205.59 1.03 0.29 0100 Jul‐04 10.06 189.98 190.41 190.32 190.45 0.001964 0.92 14.66 71.28 0.57 0.43 0
TABLE D-6HEC-RAS RESULTS for EVENT OF JULY 14-15, 2004Model Scenario Case 3: Washouts at former CNR modelled, and 60% blockage <strong>of</strong> Erskine Avenue stormEXAMINER DITCH WEST SPILL model ‐ CASE 3Spill from Examiner Ditch southwestward along the north side <strong>of</strong> former CNR track ‐ Case 3River Sta Pr<strong>of</strong>ile Q Total Min Ch El W.S. Elev Crit W.S. E.G. Elev E.G. Slope Vel Chnl Flow AreaTopWidth(m3/s) (m) (m) (m) (m) (m/m) (m/s) (m2) (m)871 PF 1 8.85 191.33 192.07 191.56 192.07 0.000029 0.11 94.75 225826 PF 1 8.85 191.59 192.04 192.06 0.002888 0.74 14.71 116.94781 PF 1 8.85 191.59 192.02 192.02 0.000298 0.25 32.16 106.62745 PF 1 8.85 191.59 191.91 191.91 191.98 0.017275 1.17 7.41 53.68676 PF 1 8.85 191.17 191.69 191.34 191.70 0.000121 0.18 50.02 126.93626 PF 1 3.00 191.20 191.69 191.69 0.000053 0.09 32.44 121.31606 PF 1 3.00 191.17 191.69 191.69 0.000015 0.06 49.48 126.63578 PF 1 3.00 191.30 191.69 191.69 0.000079 0.1 29.49 141.55508 PF 1 3.00 191.15 191.69 191.69 0.000028 0.06 48.15 179.61448 PF 1 3.00 191.00 191.68 191.69 0.000019 0.06 54.86 193.98294 PF 1 3.00 191.36 191.68 191.68 0.000078 0.07 40.32 251.42281 PF 1 3.00 191.28 191.68 191.68 0.000028 0.05 59.87 339.77266 PF 1 3.00 190.22 191.68 191.68 0.000169 0.19 15.87 46.09222 PF 1 3.00 190.00 191.68 191.68 0.000013 0.06 48.64 123.8172 PF 1 3.00 190.50 191.68 191.68 0.000003 0.03 74.42 161.31159 PF 1 3.00 190.00 191.68 191.68 0.000007 0.05 61.78 173.19152 PF 1 3.00 191.49 191.66 191.68 0.0008 0.54 6.25 71.93142 PF 1 3.00 191.49 191.63 191.63 191.66 0.003082 0.83 3.84 59.14135 PF 1 3.00 191.00 191.14 191.23 191.55 0.351836 2.85 1.05 15.32122 PF 1 3.00 190.28 190.88 190.88 191.03 0.019066 1.74 1.73 5.892 PF 1 3.00 190.00 190.78 190.46 190.79 0.001236 0.53 5.64 14.5150 PF 1 3.00 190.00 190.51 190.51 190.65 0.019821 1.61 1.86 7.27
TABLE D-7HEC-RAS RESULTS for REGIONAL STORM EVENTModel Scenario Case 1: No washouts at former CNR, and no blockage <strong>of</strong> Erskine Avenue storm inletMAIN BRANCH Model ‐ CASE 1River Sta Pr<strong>of</strong>ile Q Total Min Ch El W.S. Elev Crit W.S. E.G. Elev E.G. Slope Vel Chnl Flow Area Top Width Froude #Chl(m3/s) (m) (m) (m) (m) (m/m) (m/s) (m2) (m)3645 Regional 37.4 199.17 200.38 200.38 200.77 0.013833 2.79 13.38 16.84 13554 Regional 47.4 197.06 198.78 198.83 199.35 0.01424 3.36 14.12 13.97 1.073390 Regional 55.2 194.79 196.72 197.06 197.42 0.009666 4.23 18.39 26.02 0.993165 Regional 55.2 193.68 196.24 195.89 196.29 0.000905 1.47 69.65 241.78 0.313073 Regional 55.2 193.29 196.15 195.31 196.2 0.001187 1.36 74.74 144.97 0.263068 Regional 55.2 193.29 196.15 195.81 196.19 0.000343 1.36 121.25 215.2 0.263047 Lansdowne Bridge3026 Regional 55.2 193.23 195.8 195.8 196.02 0.001255 2.46 57.81 150.82 0.493025 Regional 55.2 193.23 195.75 195.27 195.78 0.000753 1.03 84 193.76 0.213023 Regional 55.2 193.23 195.75 195.25 195.78 0.000609 0.92 84.02 193.14 0.193009 Regional 55.2 193.23 195.74 195.25 195.77 0.000635 0.94 82.85 189.25 0.192999 Regional 55.2 193.23 195.74 195.25 195.76 0.000655 0.95 81.99 187.8 0.192993 Regional 55.2 193.23 195.73 195.25 195.76 0.000667 0.96 81.47 186.89 0.22986 Regional 55.2 193.23 195.73 195.25 195.75 0.000682 0.97 80.85 225.81 0.22969 Regional 55.2 193.08 195.74 195.74 0.000115 0.46 165.84 303.79 0.092961 Regional 55.2 193.08 195.73 195.74 0.000131 0.57 165.42 298.49 0.112947 Regional 55.2 192.9 195.73 195.74 0.000107 0.46 212.37 342.18 0.092940 Regional 55.2 192.9 195.73 194.58 195.74 0.000091 0.42 205.18 243.57 0.082939 Regional 55.2 192.9 195.73 194.58 195.74 0.000113 0.47 188.08 242.93 0.092917 Regional 55.2 192.9 195.73 194.59 195.74 0.000103 0.45 204.51 243.54 0.092889 Regional 55.2 192.9 195.73 195.73 0.000074 0.38 256.17 336.62 0.072883 Regional 55.2 192.25 195.73 194.2 195.73 0.000067 0.42 224.49 260.86 0.082703 Regional 55.2 192.01 195.72 195.72 0.000052 0.43 198.99 318.83 0.082662 Regional 43.1 191.95 195.72 195.72 0.000058 0.49 157.97 121.93 0.082512 Regional 43.1 191.5 195.71 195.71 0.000021 0.33 252.45 172.36 0.052506 Regional 43.1 191.2 195.71 195.71 0.000037 0.45 185.7 143.22 0.072332 Regional 60.8 190.6 195.7 195.71 0.000033 0.43 243.18 140.55 0.062320 Regional 60.8 190.6 195.68 193.12 195.7 0.000121 0.78 139.34 170.29 0.122310 CPR TRACKS Bridge2300 Regional 60.8 190.3 192.82 192.82 193.8 0.007704 4.4 13.83 38.62 12275 Regional 60.8 189.69 192.92 191.93 193.16 0.001708 2.44 33.75 19.46 0.452148 Regional 60.8 189.6 192.91 191.64 192.97 0.000673 1.21 91.34 146.11 0.262031 Regional 60.8 189.5 192.67 192.83 0.002032 1.83 33.84 21.39 0.431845 Regional 63.4 188.81 192.66 192.69 0.000254 1.03 182.47 451.64 0.181839 Regional 63.4 188.95 192.64 190.32 192.69 0.000178 0.97 65.69 96.96 0.171823 THE PARKWAY Bridge1807 Regional 63.4 188.95 192.35 190.32 192.39 0.00019 0.94 109.48 84.58 0.171800 Regional 63.3 188.68 192.33 192.38 0.000605 1.64 130.29 321.45 0.281765 Regional 63.3 188.82 191.98 191.09 192.32 0.002755 3.18 50.67 402.44 0.581705 Regional 63.3 188.34 191.98 191.32 192.13 0.001773 2.33 73.3 602.03 0.411645 Regional 63.3 188.32 191.67 191.37 191.97 0.003443 3.04 48.12 519.59 0.561585 Regional 63.3 188.29 191.7 191.04 191.8 0.001229 2.18 106.11 406.59 0.381565 Regional 62.6 188.28 191.73 191.76 0.000598 1.53 166.87 274.23 0.271552 Regional 62.6 188.2 191.75 189.52 191.75 0.000029 0.33 228.16 354.96 0.081543 CRAWFORD Culvert1534 Regional 62.6 188.2 191.53 189.52 191.54 0.000045 0.39 171.51 215.9 0.11527 Regional 62.5 188.47 191.52 191.54 0.000309 1 161.94 315.94 0.191346 Regional 62.5 188.22 191.44 190.69 191.48 0.00056 1.35 85.57 99.25 0.241322 Regional 62.5 188.08 191.05 191.32 0.002439 2.52 30.92 18.79 0.511305 Regional 61.9 188.2 191.08 191.25 0.001602 2.3 65.58 156.95 0.431187 Regional 61.9 187.54 190.89 191.05 0.0018 2.22 50.59 85.2 0.421025 Regional 61.9 187.44 190.71 190.81 0.001142 1.78 62.22 70.18 0.33865 Regional 61.9 187.42 190.56 190.63 0.000995 1.61 63.19 45.26 0.31725 Regional 62.5 187.39 190.39 190.49 0.000966 1.5 49.91 31.96 0.32543 Regional 62.5 187.33 190.37 190.39 0.000238 0.89 140.82 193.79 0.17384 Regional 62.5 186.93 190.34 190.35 0.000173 0.75 184.07 394.76 0.13223 Regional 72.3 186.6 190.3 190.31 0.000324 1.03 179.75 295.05 0.1883 Regional 72.3 186.29 190.27 190.29 0.00014 0.79 150.21 128.33 0.1355 Regional 72.3 186.6 190.27 190.2 190.28 0.000082 0.59 224.53 146.6 0.142.5 JOHNSTON Bridge30 Regional 72.3 186.3 189.13 188.79 189.15 0.000349 1.03 114.9 80.66 0.227 Regional 72.3 186.37 188.14 188.14 188.92 0.012406 3.91 18.47 11.83 124 Regional 72.3 186.3 187.26 187.72 188.79 0.045054 5.47 13.22 14.5 1.8321 Regional 72.3 186.23 186.95 187.43 188.61 0.06734 5.7 12.68 18.1 2.1718 Regional 73.5 186.16 186.81 187.25 188.37 0.072057 5.54 13.27 20.96 2.22
TABLE D-8HEC-RAS RESULTS for REGIONAL STORM EVENTModel Scenario Case 1: No washouts at former CNR, and no blockage <strong>of</strong> Erskine Avenue storm inletLOWER SPILL Model (south <strong>of</strong> former CNR) ‐ CASE 1CNR Spill ‐ Case 1River Sta Pr<strong>of</strong>ile Q Total Min Ch El W.S. Elev Crit W.S. E.G. Elev E.G. Slope Vel Chnl Flow Area Top Width Froude #Chl(m3/s) (m) (m) (m) (m) (m/m) (m/s) (m2) (m)460 Regional 1.28 191.18 191.33 191.27 191.33 0.001016 0.39 4.55 180.31 0.36450 Regional 1.28 191.18 191.29 191.31 0.003373 0.56 2.77 141.11 0.61400 Regional 1.28 191.00 191.22 191.22 0.000569 0.32 9.56 73.59 0.27350 Regional 1.28 191.03 191.05 191.04 191.08 0.501954 1.9 2.07 85.23 5.44300 Regional 2.63 190.59 191.04 191.04 0.00011 0.21 20.83 148.68 0.13250 Regional 4.91 190.76 190.91 190.91 190.97 0.010571 1.37 17.78 204.24 1.18200 Regional 4.91 190.35 190.71 190.49 190.71 0.000635 0.48 35.34 222.82 0.32150 Regional 4.91 190.34 190.56 190.60 0.006202 1.06 14.25 131.15 0.9100 Regional 7.56 189.98 190.37 190.28 190.40 0.001925 0.82 11.95 64.44 0.55
TABLE D-9HEC-RAS RESULTS for REGIONAL STORM EVENTModel Scenario Case 1: No washouts at former CNR, and no blockage <strong>of</strong> Erskine Avenue storm inletEXAMINER DITCH Model ‐ CASE 1River Sta Pr<strong>of</strong>ile Q Total Min Ch El W.S. Elev Crit W.S. E.G. Elev E.G. Slope Vel Chnl Flow Area Top Width Froude #Chl(m3/s) (m) (m) (m) (m) (m/m) (m/s) (m2) (m)2050 Regional 12.1 192.90 194.88 193.97 194.91 0.000697 0.84 14.39 107.69 0.221978 Regional 11.8 192.69 194.79 193.52 194.85 0.000566 1.11 10.63 86.67 0.251974 Culvert1964 Regional 11.8 192.60 193.58 193.49 193.91 0.009347 2.56 4.61 17.15 0.861950 Regional 11.8 192.46 193.54 193.63 0.003996 1.82 13.13 29.12 0.571882 Regional 11.8 191.85 193.19 193.19 193.32 0.005132 1.92 11.89 47.21 0.611850 Regional 11.8 191.65 193.04 192.72 193.08 0.001195 1.01 18.83 42.53 0.311800 Regional 11.8 191.35 193.01 193.03 0.000541 0.78 26.46 53.37 0.221777 Regional 11.8 191.22 193.02 192.37 193.02 0.000172 0.21 61.94 173.89 0.11770 Culvert1763 Regional 11.8 191.19 193.02 193.02 0.000015 0.06 247.66 904.66 0.031700 Regional 11.8 191.24 193.02 193.02 0.000025 0.12 195.38 709.85 0.041610 Regional 11.8 191.12 193.01 193.01 0.00008 0.3 140.01 512.37 0.081553 Regional 11.8 191.26 192.92 192.97 0.001269 1.08 13.75 24.7 0.321500 Regional 11.8 191.06 192.91 192.93 0.000335 0.73 20.37 20.48 0.181458 Regional 9.6 190.80 192.84 191.58 192.90 0.000523 1.05 9.16 329.83 0.231442 Culvert1428 Regional 9.6 190.48 192.18 192.29 0.001439 1.47 6.51 73.98 0.371427 Lat Struct1405 Regional 7.87 190.45 192.15 192.22 0.00122 1.27 8.5 10.29 0.331327 Regional 7.87 190.35 191.95 192.03 0.001563 1.35 7.49 9.12 0.371250 Regional 7.87 190.01 191.77 191.87 0.002375 1.43 6.06 5.3 0.381194 Regional 2.94 190.28 191.73 191.00 191.76 0.000879 0.83 4.64 33.72 0.241123 Regional 2.94 190.35 191.61 191.66 0.002164 1.1 3.65 5.93 0.351050 Regional 2.94 190.67 191.29 191.17 191.37 0.009405 1.22 2.4 6.55 0.65
TABLE D-10HEC-RAS RESULTS for REGIONAL STORM EVENTModel Scenario Case 1: No washouts at former CNR, and no blockage <strong>of</strong> Erskine Avenue storm inletEXAMINER DITCH WEST SPILL model ‐ CASE 1Spill from Examiner Ditch southwestward along the north side <strong>of</strong> former CNR track ‐ Case 1River Sta Pr<strong>of</strong>ile Q Total Min Ch El W.S. Elev Crit W.S. E.G. Elev E.G. Slope Vel Chnl Flow AreaTop Froude #Width Chl(m3/s) (m) (m) (m) (m) (m/m) (m/s) (m2) (m)871 Regional 7.48 191.33 192.04 191.55 192.04 0.00003 0.10 88.99 225.0 0.04826 Regional 7.48 191.59 192.01 192.03 0.00313 0.73 11.65 116.4 0.42781 Regional 7.48 191.59 191.99 192.00 0.00028 0.23 29.60 104.6 0.13745 Regional 7.48 191.59 191.89 191.89 191.96 0.01717 1.12 6.46 49.0 0.88676 Regional 7.48 191.17 191.70 191.33 191.71 0.00008 0.15 51.34 127.7 0.07626 Regional 3.40 191.20 191.70 191.70 0.00006 0.10 33.80 123.4 0.06606 Regional 3.40 191.17 191.70 191.70 0.00002 0.07 50.88 127.4 0.03578 Regional 3.40 191.30 191.70 191.70 0.00009 0.11 31.04 146.0 0.07508 Regional 3.40 191.15 191.70 191.70 0.00003 0.07 50.04 181.5 0.04448 Regional 3.40 191.00 191.70 191.70 0.00002 0.06 56.85 194.5 0.04294 Regional 3.40 191.36 191.69 191.69 0.00009 0.08 42.83 259.8 0.06281 Regional 3.40 191.28 191.69 191.69 0.00003 0.06 63.21 342.8 0.04266 Regional 3.40 190.22 191.69 191.69 0.00020 0.21 16.30 46.4 0.11222 Regional 3.40 190.00 191.69 191.69 0.00002 0.07 49.79 125.6 0.03172 Regional 3.40 190.50 191.69 191.69 0.00000 0.04 75.91 163.0 0.02159 Regional 3.40 190.00 191.69 191.69 0.00001 0.05 63.39 176.8 0.02152 Regional 3.40 191.49 191.67 191.69 0.00080 0.56 6.84 74.7 0.5142 Regional 3.40 191.49 191.63 191.63 191.67 0.00311 0.87 4.19 61.2 0.92135 Regional 3.40 191.00 191.15 191.24 191.56 0.32517 2.85 1.19 16.3 3.36122 Regional 3.40 190.28 190.91 190.91 191.07 0.01870 1.78 1.91 6.1 1.0192 Regional 3.40 190.00 190.81 190.48 190.83 0.00126 0.55 6.14 15.1 0.2850 Regional 3.40 190.00 190.54 190.54 190.68 0.01948 1.65 2.06 7.6 1.01
TABLE D-11HEC-RAS RESULTS for REGIONAL STORM EVENTModel Scenario Case 4: Same as Case 1 but with twin 2.0-m CPR culverts replacedTwin 2.0‐m CPR culverts east <strong>of</strong> The Parkway replaecd by single 1.0‐m CSP culvertMAIN BRANCH Model ‐ CASE 4River Sta Pr<strong>of</strong>ile Q Total Min Ch El W.S. Elev Crit W.S. E.G. Elev E.G. Slope Vel Chnl Flow AreaTop Froude #Width Chl(m3/s) (m) (m) (m) (m) (m/m) (m/s) (m2) (m)3645 Regional 37.4 199.17 200.38 200.38 200.77 0.013833 2.79 13.4 16.8 1.003554 Regional 47.4 197.06 198.78 198.83 199.35 0.01424 3.36 14.1 14.0 1.073390 Regional 55.2 194.79 196.72 197.06 197.42 0.009666 4.23 18.4 26.0 0.993165 Regional 55.2 193.68 196.24 195.89 196.29 0.000905 1.47 69.7 241.8 0.313073 Regional 55.2 193.29 196.15 195.31 196.20 0.001187 1.36 74.7 145.0 0.263068 Regional 55.2 193.29 196.15 195.81 196.19 0.000343 1.36 121.3 215.2 0.263047 Bridge3026 Regional 55.2 193.23 195.80 195.80 196.02 0.001255 2.46 57.8 150.8 0.493025 Regional 55.2 193.23 195.48 195.27 195.56 0.002106 1.63 55.0 115.7 0.353023 Regional 55.2 193.23 195.49 195.25 195.55 0.001768 1.50 55.1 115.9 0.323009 Regional 55.2 193.23 195.44 195.25 195.53 0.002101 1.62 51.2 139.1 0.352999 Regional 55.2 193.23 195.40 195.25 195.50 0.00249 1.75 47.5 127.7 0.382993 Regional 55.2 193.23 195.37 195.25 195.48 0.002846 1.86 44.8 105.2 0.412986 Regional 55.2 193.23 195.25 195.25 195.45 0.00487 2.37 35.0 90.5 0.542969 Regional 55.2 193.08 195.33 194.89 195.35 0.000493 0.85 97.1 176.9 0.182961 Regional 55.2 193.08 195.32 195.35 0.000556 1.04 95.3 152.2 0.222947 Regional 55.2 192.90 195.32 195.34 0.000525 0.92 103.9 200.8 0.192940 Regional 55.2 192.90 195.32 194.58 195.33 0.000463 0.86 114.6 227.8 0.182939 Regional 55.2 192.90 195.31 194.58 195.33 0.000538 0.93 103.1 202.6 0.192917 Regional 55.2 192.90 195.30 194.59 195.32 0.000565 0.95 111.2 227.3 0.192889 Regional 55.2 192.90 195.29 195.31 0.000449 0.84 131.1 280.4 0.172883 Regional 55.2 192.25 195.29 194.20 195.30 0.000319 0.82 128.5 245.3 0.162703 Regional 55.2 192.01 195.26 195.27 0.000134 0.62 135.2 250.1 0.122662 Regional 43.1 191.95 195.25 195.26 0.000187 0.80 102.8 110.6 0.152512 Regional 43.1 191.50 195.24 195.25 0.000057 0.50 176.2 151.7 0.082506 Regional 44.1 191.20 195.23 195.24 0.000111 0.72 123.7 118.8 0.122332 Regional 60.8 190.60 195.22 195.23 0.000083 0.63 176.8 132.3 0.102320 Regional 60.8 191.30 194.90 193.09 195.10 0.000999 1.97 30.8 48.6 0.332310 CPR Culvert2300 Regional 60.8 191.30 193.07 193.07 193.90 0.011184 4.04 15.0 45.3 0.992275 Regional 60.8 189.69 192.92 191.93 193.16 0.001708 2.44 33.8 19.5 0.452148 Regional 60.8 189.60 192.91 191.64 192.97 0.000673 1.21 91.3 146.1 0.262031 Regional 60.8 189.50 192.67 192.83 0.002032 1.83 33.8 21.4 0.431845 Regional 63.4 188.81 192.66 192.69 0.000254 1.03 182.5 451.6 0.181839 Regional 63.4 188.95 192.64 190.32 192.69 0.000178 0.97 65.7 97.0 0.171823 Bridge1807 Regional 63.4 188.95 192.35 190.32 192.39 0.00019 0.94 109.5 84.6 0.171800 Regional 63.3 188.68 192.33 192.38 0.000605 1.64 130.3 321.5 0.281765 Regional 63.3 188.82 191.98 191.09 192.32 0.002755 3.18 50.7 402.4 0.581705 Regional 63.3 188.34 191.98 191.32 192.13 0.001773 2.33 73.3 602.0 0.411645 Regional 63.3 188.32 191.67 191.37 191.97 0.003443 3.04 48.1 519.6 0.561585 Regional 63.3 188.29 191.70 191.04 191.80 0.001229 2.18 106.1 406.6 0.381565 Regional 62.6 188.28 191.73 191.76 0.000598 1.53 166.9 274.2 0.271552 Regional 62.6 188.20 191.75 189.52 191.75 0.000029 0.33 228.2 355.0 0.081543 Culvert1534 Regional 62.6 188.20 191.53 189.52 191.54 0.000045 0.39 171.5 215.9 0.101527 Regional 62.5 188.47 191.52 191.54 0.000309 1.00 161.9 315.9 0.191346 Regional 62.5 188.22 191.44 190.69 191.48 0.00056 1.35 85.6 99.3 0.241322 Regional 62.5 188.08 191.05 191.32 0.002439 2.52 30.9 18.8 0.511305 Regional 61.9 188.20 191.08 191.25 0.001602 2.30 65.6 157.0 0.431187 Regional 61.9 187.54 190.89 191.05 0.0018 2.22 50.6 85.2 0.421025 Regional 61.9 187.44 190.71 190.81 0.001142 1.78 62.2 70.2 0.33865 Regional 61.9 187.42 190.56 190.63 0.000995 1.61 63.2 45.3 0.31725 Regional 62.5 187.39 190.39 190.49 0.000966 1.50 49.9 32.0 0.32543 Regional 62.5 187.33 190.37 190.39 0.000238 0.89 140.8 193.8 0.17384 Regional 62.5 186.93 190.34 190.35 0.000173 0.75 184.1 394.8 0.13223 Regional 72.3 186.60 190.30 190.31 0.000324 1.03 179.8 295.1 0.1883 Regional 72.3 186.29 190.27 190.29 0.00014 0.79 150.2 128.3 0.1355 Regional 72.3 186.60 190.27 190.20 190.28 0.000082 0.59 224.5 146.6 0.1042.5 Bridge30 Regional 72.3 186.30 189.13 188.79 189.15 0.000349 1.03 114.9 80.7 0.2027 Regional 72.3 186.37 188.14 188.14 188.92 0.012406 3.91 18.5 11.8 1.0024 Regional 72.3 186.30 187.26 187.72 188.79 0.045054 5.47 13.2 14.5 1.8321 Regional 72.3 186.23 186.95 187.43 188.61 0.06734 5.70 12.7 18.1 2.1718 Regional 73.5 186.16 186.81 187.25 188.37 0.072057 5.54 13.3 21.0 2.22
TABLE D-12HEC-RAS RESULTS for REGIONAL STORM EVENTModel Scenario Case 4: Same as Case 1 but with twin 2.0-m CPR culverts replacedTwin 2.0‐m CPR culverts east <strong>of</strong> The Parkway replaecd by single 1.0‐m CSP culvertLOWER SPILL Model (south <strong>of</strong> former CNR) ‐ CASE 4CNR Spill ‐ Case 4River Sta Pr<strong>of</strong>ile Q Total Min Ch El W.S. Elev Crit W.S. E.G. Elev E.G. Slope Vel Chnl Flow Area Top Width Froude # Chl(m3/s) (m) (m) (m) (m) (m/m) (m/s) (m2) (m)460 Regional 0.58 191.18 191.29 191.24 191.29 0.000735 0.26 2.7 140.3 0.29450 Regional 0.58 191.18 191.24 191.24 191.26 0.010915 0.59 1.1 103.1 0.97400 Regional 0.58 191.00 191.15 191.16 0.000498 0.24 5.9 65.6 0.24350 Regional 0.58 191.03 191.02 191.02 191.04 0.692881 0.9 60.4 0300 Regional 2.50 190.59 190.96 190.79 190.97 0.000236 0.28 14.5 120.9 0.19250 Regional 2.35 190.76 190.87 190.87 190.90 0.011272 1.07 10.5 193.0 1.14200 Regional 2.35 190.35 190.62 190.36 190.62 0.00055 0.35 21.6 148.7 0.28150 Regional 2.35 190.34 190.46 190.36 190.50 0.016824 1.15 6.2 78.2 1.34100 Regional 4.68 189.98 190.37 190.23 190.38 0.000738 0.5 12.0 64.4 0.34
TABLE D-13HEC-RAS RESULTS for REGIONAL STORM EVENTModel Scenario Case 4: Same as Case 1 but with twin 2.0-m CPR culverts replacedTwin 2.0‐m CPR culverts east <strong>of</strong> The Parkway replaecd by single 1.0‐m CSP culvertEXAMINER DITCH Model ‐ CASE 4Examiner Ditch ‐ Case 4River Sta Pr<strong>of</strong>ile Q Total Min Ch El W.S. Elev Crit W.S. E.G. Elev E.G. Slope Vel Chnl Flow AreaTopWidthFroude # Chl(m3/s) (m) (m) (m) (m) (m/m) (m/s) (m2) (m)2050 Regional 12.1 192.9 196.00 193.97 196.00 0.00 0.06 263.98 133.93 0.011978 Regional 5.3 192.69 196.00 193.38 196.00 0.00 0.03 207.91 104.95 0.011974 Culvert1964 Regional 5.3 192.6 193.51 193.51 193.96 0.01 2.96 1.79 15.58 11950 Regional 5.3 192.46 193.33 193.09 193.37 0.00 1.2 8.08 19.81 0.421882 Regional 5.3 191.85 192.80 192.80 193.04 0.01 2.17 2.64 7.71 0.891850 Regional 5.3 191.65 192.78 192.49 192.81 0.00 0.89 9.21 29.29 0.321800 Regional 5.3 191.35 192.75 192.77 0.00 0.61 14.42 37.41 0.191777 Regional 5.3 191.22 192.74 191.90 192.74 0.00 0.4 15.05 147.31 0.351770 Culvert1763 Regional 5.3 191.19 192.63 192.71 0.00 1.29 4.12 418.32 0.341700 Regional 5.3 191.24 192.61 192.61 0.00 0.27 20.24 79.23 0.141610 Regional 5.3 191.12 192.53 192.56 0.00 0.8 7.3 48.03 0.271553 Regional 5.3 191.26 192.39 192.45 0.00 1.08 4.92 7.22 0.421500 Regional 5.3 191.06 192.39 192.40 0.00 0.57 11.12 16.22 0.171458 Regional 5.1 190.8 192.35 191.31 192.38 0.00 0.73 6.96 86.29 0.191442 Culvert1428 Regional 5.1 190.48 192.16 192.19 0.00 0.79 6.46 73.76 0.21427 Lat Struct1405 Regional 5.1 190.45 192.15 192.18 0.00 0.82 8.49 10.29 0.211327 Regional 5.1 190.35 192.09 192.11 0.00 0.78 8.86 10.69 0.21250 Regional 5.2 190.01 192.05 192.07 0.00 0.77 8.35 11.51 0.191194 Regional 5.2 190.28 191.96 191.24 192.02 0.00 1.2 6.9 56.15 0.311123 Regional 5.2 190.35 191.73 191.85 0.00 1.7 4.45 7.43 0.511050 Regional 3.3 190.67 191.49 191.20 191.53 0.00 0.85 3.87 8.15 0.39
TABLE D-14HEC-RAS RESULTS for REGIONAL STORM EVENTModel Scenario Case 4: Same as Case 1 but with twin 2.0-m CPR culverts replacedTwin 2.0‐m CPR culverts east <strong>of</strong> The Parkway replaecd by single 1.0‐m CSP culvertEXAMINER DITCH WEST SPILL model ‐ CASE 4Spill from Examiner Ditch southwestward along the north side <strong>of</strong> former CNR track ‐ Case 3River Sta Pr<strong>of</strong>ile Q Total Min Ch El W.S. Elev Crit W.S. E.G. Elev E.G. Slope Vel Chnl Flow Area Top Width Froude #Chl(m3/s) (m) (m) (m) (m) (m/m) (m/s) (m2) (m)871 Regional 3.76 191.33 191.94 191.51 191.94 0.000013 0.06 67.52 186.38 0.03826 Regional 3.76 191.59 191.92 191.93 0.001764 0.47 7.87 32.68 0.3781 Regional 3.76 191.59 191.91 191.91 0.000227 0.17 20.89 97.19 0.11745 Regional 3.76 191.59 191.82 191.82 191.88 0.015907 0.9 3.73 32.33 0.81676 Regional 3.76 191.17 191.69 191.29 191.69 0.000023 0.08 49.52 126.65 0.04626 Regional 2.94 191.20 191.69 191.69 0.000052 0.09 32.24 121 0.05606 Regional 2.94 191.17 191.69 191.69 0.000014 0.06 49.26 126.51 0.03578 Regional 2.94 191.30 191.69 191.69 0.000077 0.1 29.26 140.89 0.06508 Regional 2.94 191.15 191.68 191.68 0.000027 0.06 47.87 179.33 0.04448 Regional 2.94 191.00 191.68 191.68 0.000019 0.05 54.56 193.91 0.03294 Regional 2.94 191.36 191.68 191.68 0.000076 0.07 39.95 250.13 0.06281 Regional 2.94 191.28 191.68 191.68 0.000028 0.05 59.36 339.15 0.04266 Regional 2.94 190.22 191.68 191.68 0.000165 0.19 15.81 46.05 0.1222 Regional 2.94 190.00 191.68 191.68 0.000012 0.06 48.46 123.52 0.03172 Regional 2.94 190.50 191.68 191.68 0.000003 0.03 74.19 161.05 0.01159 Regional 2.94 190.00 191.68 191.68 0.000006 0.05 61.54 172.64 0.02152 Regional 2.94 191.49 191.66 191.68 0.000799 0.53 6.16 71.5 0.49142 Regional 2.94 191.49 191.63 191.63 191.66 0.003098 0.83 3.78 58.77 0.91135 Regional 2.94 191.00 191.14 191.22 191.55 0.355994 2.84 1.03 15.17 3.48122 Regional 2.94 190.28 190.87 190.87 191.02 0.019146 1.73 1.7 5.75 1.0292 Regional 2.94 190.00 190.77 190.46 190.79 0.001232 0.53 5.56 14.41 0.2750 Regional 2.94 190.00 190.51 190.51 190.64 0.019898 1.6 1.83 7.21 1.02