DMA Brochure 1 - TA Instruments
DMA Brochure 1 - TA Instruments
DMA Brochure 1 - TA Instruments
- No tags were found...

Create successful ePaper yourself
Turn your PDF publications into a flip-book with our unique Google optimized e-Paper software.
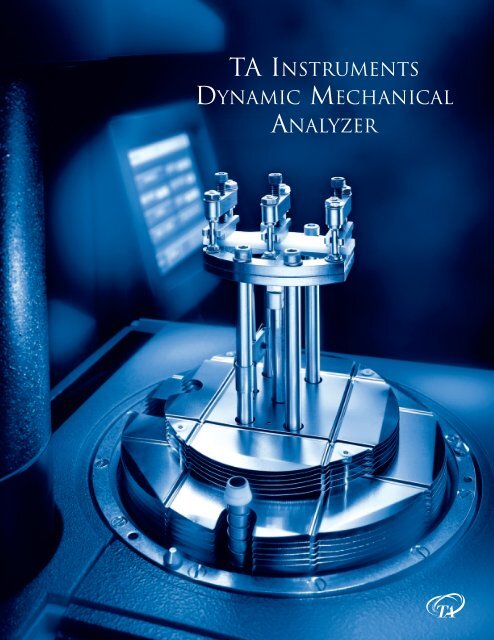
<strong>TA</strong> INSTRUMENTSDYNAMIC MECHANICALANALYZER
THE <strong>TA</strong> INSTRUMENTSDYNAMIC MECHANICAL ANALYZERThe <strong>TA</strong> <strong>Instruments</strong> Q800 is the culmination of years ofengineering expertise in Dynamic Mechanical Analyzers.<strong>TA</strong> <strong>Instruments</strong> pioneered <strong>DMA</strong> instrumentation with the 980 <strong>DMA</strong>introduced in 1976 and continues the tradition today. The Q800 is thesixth generation <strong>DMA</strong> and incorporates unique technology. Backed bythe best customer support available, the <strong>TA</strong> <strong>Instruments</strong> Q800 <strong>DMA</strong>sets the standard for Dynamic Mechanical Analyzers.The most important features of any <strong>DMA</strong> are how the stress is applied to the sample,and how the resultant strain is measured. The Q800 <strong>DMA</strong> utilizes state-of-the-artnon-contact, linear drive motor technology to provide precise control of the stress.Strain is measured using optical encoder technology that provides unmatchedsensitivity and resolution. Along with low friction air bearing technology, the Q800provides superior performance compared to traditional designs that employ LVDTtechnology, stepper motors, and mechanical springs.
TECHNICAL SPECIFICATIONSMaximum Force18 NMinimum ForceForce ResolutionStrain ResolutionModulus Range0.001 N0.0001 N1 nanometer10E 3 to 3x10E 12 PaModulus Precision +/- 1%Tan δ (delta) Range 0.0001 to 10Tan δ (delta) Sensitivity 0.0001Tan δ (delta) Resolution 0.00001Frequency Range0.01 to 200 HzDynamic Sample Deformation Range +/- 0.5 to 10,000 µmTemperature RangeHeating RateCooling RateIsothermal StabilityAutomated Furnace MovementTime/Temperature Superposition Software-150 to 600˚C0.1 to 20˚C/min0.1 to 10˚C/min+/- 0.1˚CYesYesOUTPUT VALUESStorage Modulus Complex/Dynamic Viscosity TimeLoss Modulus Creep Compliance Stress/StrainStorage/Loss Compliance Relaxation Modulus FrequencyTan Delta (δ) Static/Dynamic Force Sample StiffnessComplex Modulus Temperature Displacement
DESIGN FEATURES AND BENEFITSThe performance of a Dynamic Mechanical Analyzer is a function ofits ability to apply a force and measure displacement. The Q800 <strong>DMA</strong>incorporates the latest technology for this purpose as described below.1 Drive Motor The Q800 uses a non-contact, direct drive motor to provide the oscillatory or static forcerequired. The motor is constructed of high performance composites that ensure low compliance and isthermostated to eliminate heat build-up even when using large oscillation amplitudes and high deformationforces. Sophisticated electronics enable the motor current to be rapidly adjusted in small increments.Benefits: The motor can deliver reproducible forces over a wide range and the force can be changed rapidly,enabling a wide range of material properties to be measured.2 Air Bearings The non-contact drive motor transmits force directly to a rectangular air bearing slide.The slide is guided by eight porous carbon air bearings grouped into two sets of four near the top andbottom of the slide. Pressurized air or nitrogen flows to the bearingsforming a frictionless surface that permits the slide to “float”.The slide, which connects to the drive shaft and sample 2clamp, can move vertically 25 mm and its rectangularshape eliminates any twisting of the sample.Benefits: Very weak materials like films and fiberscan be characterized with ease since the drive shaftcan move with virtually no friction and the uniquerectangular slide prevents twist in the sample.3 Optical Encoder A high resolution linearoptical encoder is used to measure displacement onthe Q800 <strong>DMA</strong>. Based on diffraction patterns 3of light through gratings (one moveable and onestationary), optical encoders provide exceptionalresolution compared to typical LVDT technology.Benefits: Due to the excellent 1 nanometer resolution of theoptical encoder, very small amplitudes can be measured precisely.This combined with the non-contact drive motor and air bearing technology provides excellent modulusprecision and high Tan δ sensitivity, allowing the Q800 <strong>DMA</strong> to characterize a broad range of materials.
4 Low Mass, High Stiffness Sample Clamps The Q800 features a variety of sample clampsthat provide for multiple modes of deformation. The clamps were designed using “finite element analysis” toprovide high stiffness, with low mass and attach to the drive shaft with a dovetail connection. The clamps aresimple to use and adjust, and each is individually calibrated to insure data accuracy. Benefits: A broad rangeof samples can be analyzed. The high stiffness minimizes clamp compliance, and the low mass ensuresrapid temperature equilibration. The simple, yet elegant designs reduce the time necessary to change clampsand load samples.455 Furnace The Q800 features a bifilar woundfurnace that automatically opens and closes.Benefits: The furnace design combined with theGas Cooling Accessory provides for efficientand precise temperature control over theentire temperature range, both in heating,cooling, and isothermal operation.The automatic furnace movement simplifiesexperimental setup.6 Rigid Aluminum Casting TheQ800 drive motor, air bearing slideassembly with optical encoder and airbearings are all mounted within a rigidaluminum casting that is temperaturecontrolled. Benefits: The rigid aluminumhousing minimizes system compliance andthe temperature-controlled housing ensuresprecise data.61
MODES OF DEFORMATIONThe Q800 offers all the major deformation modes required to characterize solid bars,elastomers, soft foams, thin films and fibers. The deformation modes include bending(single cantilever, dual cantilever, and 3-point bend), shear, compression, and tension.In addition, submersible compression and film tension clamps are available.DUAL/SINGLE CANTILEVERDual CantileverIn this mode, the sample is clamped at both ends and either flexed in the middle(dual cantilever) or at one end (single cantilever). Cantilever bending is a goodgeneral purpose mode for evaluating thermoplastics and highly damped materials(e.g., elastomers). Dual cantilever mode is ideal for studying the cure of supportedthermosets.Three clamp sizes are available:Dual/Single Cantilever 8/4mm (L), Up to 15mm (W) and 5mm (T)Dual/Single Cantilever 20/10mm (L), Up to 15mm (W) and 5mm (T)Dual/Single Cantilever 35/17.5mm (L), Up to 15mm (W) and 5mm (T)3 POINT BENDIn this mode, the sample is supported at both ends and force is applied in themiddle. 3 point bend is considered a "pure" mode of deformation since clampingeffects are eliminated. The 50 mm and 20 mm clamps feature a unique low-frictionsupport using roller bearings that improves accuracy.Three clamp sizes are available:3-pt bend, Small3-pt bend, 50 mm3-pt bend, 20 mm5, 10, or 15mm (L). Up to 15mm (W) and 7mm (T)50mm (L), Up to 15mm (W) and 7mm (T)20mm (L), Up to 15mm (W) and 7mm (T)SHEAR SANDWICHIn this mode, two equal sizes of the same material are sheared between a fixedouter plate and the moving center plate. This mode is ideal for gels, adhesives,high viscosity resins and other highly damped materials.Shear Sandwich10mm square. Up to 4mm (T)
COMPRESSIONIn this mode, the sample is placed on a fixed flat surface and force is appliedby an oscillating upper plate. Compression is suitable for low to moderatemodulus materials (e.g., foams, elastomers), provided the material has someelasticity. With minor changes this mode can be used to make measurements ofexpansion or penetration using a static force.Two clamp sizes are available:Compression (small)Compression (large)15mm diameter up to 10mm thick40mm diameter up to 10mm thickFilmsTENSIONIn this mode, the sample is placed in tensionbetween a fixed and moveable clamp. In oscillationexperiments, a small static force is applied in orderto prevent buckling. The clamps feature verysimple mounting and because the drive shaft doesnot rotate, no twist is induced in the sample thatcan lead to inaccurate data.Two clamps are available:FibersTension (film)Tension (fiber)5 to 30mm (L); up to 8mm (W) and 2mm (T)5 to 30mm (L); 5 denier (0.57 tex) to 0.8mm diam.single fibers or fiber bundlesSUBMERSIBLE CLAMPSBoth film tension and compression clamps areavailable in submersible configurations. Theseclamps allow samples to be analyzed in a fluidenvironment up to 80˚C.
ACCESSORIESGAS COOLING ACCESSORYThe Gas Cooling Accessory (GCA) extends theoperating range to subambient temperatures.The GCA uses cold nitrogen gas generated fromcontrolled heating of liquid nitrogen. Automatedfilling of the GCA tank can be programmed to occureither after the scan is complete or during a run. Thisability to automatically refill during the middle ofa run is particularly useful during long <strong>DMA</strong>experiments typically encountered when generatingdata for Time/Temperature Superposition (TTS).AIR COMPRESSOR ACCESSORYThe Q800 uses air bearings for support of the driveshaft. The air bearings use a clean, dry compressedair or nitrogen supply that typically comes from acentralized supply. In cases where this is not possible,the Air Compressor Accessory (ACA) is available.This self-contained air compressor provides the clean,dry air supply required for the air bearings.ACCESSORY KITThe standard accessory kit supplied with the Q800provides all the necessary tools and calibrationmaterials needed for operation. Included with the kitis the 35 mm dual/single cantilever clamp that is usedfor many common applications. A set of precisiondigital calipers is included for accurate sampledimension measurements. A torque wrench issupplied since when mounting samples, an accurate,reproducible torque must be applied to mountingscrews on the sample clamp. Finally, a variety ofcalibration samples are provided and used forinstrument calibration.
<strong>DMA</strong> THEORYDynamic Mechanical Analysis (<strong>DMA</strong>) is a technique used to measure the mechanical properties of a widerange of materials. Many materials, including polymers, behave both like an elastic solid and a viscous fluid,thus the term viscoelastic. <strong>DMA</strong> differs from other mechanical testing devices in two important ways.First, typical tensile test devices focus only on the elastic component. In many applications, the inelastic,or viscous component, is critical. It is theRange of Material Behaviorviscous component that determines propertiessuch as impact resistance. Second, tensile testSolid LikeLiquid Likedevices work primarily outside the linear Ideal Solid Most Materials Ideal Fluidviscoelastic range. <strong>DMA</strong> works primarily in the Purely Elastic Viscoelastic Purely Viscouslinear viscoelastic range and is therefore moreViscoelasticity: Having both viscous and elastic propertiessensititive to structure.<strong>DMA</strong> measures the viscoelastic properties using either transient or dynamic oscillatory tests. Transient testsinclude creep and stress relaxation. In creep, a stress is applied to the sample and held constant whiledeformation is measured vs. time. After some time, the stress is removed and the recovery is measured.In stress relaxation, a deformation is applied to the sample and held constant, and the degradation of the stressvs. time is measured. Both tests are used to assess the viscoelastic nature of materials.The most common test is the dynamic oscillatory test,where a sinusoidal stress is applied to the materialand a sinusoidal strain is measured (Figure 1). Alsomeasured is the phase difference, δ, between thetwo sine waves. The phase lag will be zero degreesfor purely elastic materials and 90 degrees forpurely viscous materials. Polymers will exhibit anintermediate phase difference.Since modulus is stress/strain, the complex modulus, E*,can be calculated. From E* and the measurement of δ,the storage modulus, E l , and loss modulus, E ll , can becalculated as illustrated in Figure 2. E l , the storagemodulus is the elastic component and related to thesamples stiffness. E ll , the loss modulus, is the viscouscomponent and is related to the samples ability todissipate mechanical energy through molecular motion.The tangent of phase difference, or Tan δ, is anothercommon parameter that provides information on therelationship between the elastic and inelastic component. These parameters can be calculated as a functionof time, temperature, frequency, or amplitude (stress or strain) depending on the application.
MODES OF OPERATIONThe Q800 <strong>DMA</strong> provides multiple operating modes that facilitate a wide variety of common experiments.The modes include:Multi-Frequency Mode: The multi-frequency mode canassess viscoelastic properties as a function of frequency, whileoscillation amplitude is held constant. These tests can be runat single or multiple frequencies, in time sweep, temperatureramp, or temperature step/hold experiments.Multi-Stress/Strain Mode: In this mode, frequency andtemperature are held constant, and the viscoelastic propertiesare monitored as % strain or the stress is varied. This mode isprimarily used to identify the Linear Viscoelastic Range (LVR).Creep/Stress Relaxation Mode: With creep, the stress is heldconstant and deformation is monitored as a function of time. In stressrelaxation, the deformation is held constant and the stress ismonitored vs. time.TimeControlled Force/Strain Rate Mode: In this mode, the temperatureis held constant while stress or strain is ramped at a constant rate.This mode is used to generate stress/strain plots to obtain Young’sModulus. Alternatively, stress can be held constant with a temperatureramp while strain is monitored.Isostrain Mode: With this mode, strain is held constantduring a temperature ramp. Isostrain can be used to assess shrinkageforce in films and fibers.StrainTemperature
APPLICATIONSMEASUREMENT OF Tg OF A PRESSURESENSITIVE ADHESIVE (PSA)A common measurement on polymers is the glasstransition temperature, Tg. It can be measured withvarious techniques, but <strong>DMA</strong> is by far the mostsensitive. Figure 3 shows a scan of a pressuresensitive adhesive run in the tension clamps at afrequency of 1 Hz. Tg can be measured by theE l onset point, by the E ll peak, or the peak of Tan δ.In addition to the Tg, the absolute value of thevarious viscoelastic parameters is also useful.FREQUENCY EFFECT ON MODULUSAND GLASS TRANSITION OFPOLYETHYLENE TEREPHALATE (PET)Because the Tg has a kinetic component, it isstrongly influenced by the frequency (rate) ofdeformation. As the frequency of the test increases,the molecular relaxations can only occur at highertemperatures and, as a consequence, the Tg willincrease with increasing frequency as illustrated inFigure 4. In addition, the shape and intensity of theTan δ peak as well as the slope of the storage modulusin the transition region will be affected. Basedon end-use conditions, it is important to understandthe temperature and frequency dependence oftransitions.THE MEASUREMENT OF SECONDARYTRANSITIONS IN VINYL ESTER<strong>DMA</strong> is one of the only techniques that can measureβ and γ secondary transitions. Secondary transitionsarise from side group motion with some cooperativemotion from the main chain as well as internalmotion within a side group. The transitions, asshown in Figure 5, are below the Tg and typicallysubambient. They are very important as they affectimpact resistance and other end-use properties. Thisdata was generated using 3-point bending and alsoillustrates the ability to run stiff composites.
EFFECT OF PLASTICIZER CONTENT ONPVCFigure 6 illustrates another very commonapplication for <strong>DMA</strong>. This data on PolyvinylChloride (PVC) was generated using the singlecantilever bending mode. The three samples havevarying amounts of plasticizer which dramaticallyeffects both the absolute value of modulus as well asthe Tg. Assessing the effects of plasticizer and otheradditives such as fillers, modifiers, and colorants onmodulus and transition temperatures is a commonuse for <strong>DMA</strong>.CHARACTERIZING PRINTEDCIRCUIT BOARDSPrinted Circuit Boards (PCB) are typicallycomprised of fiberglass braid impregnated with athermosetting resin. Characterizing the Tg of PCB’sis often difficult due to the very low amount ofresin used. Figure 7 shows a typical PCB run in singlecantilever bending. The Tg is clearly discernibleand the difference between the “as received” and“post baked” sample clearly shows the effect thatfurther crosslinking has on both the Tg and theabsolute value of modulus.SUBAMBIENT CHARACTERIZATIONOF SOFT FOAMSFigure 8 shows a single cantilever bendingexperiment on a soft foam material. These materialscan also be characterized using shear andcompression modes, but the single cantilever modeprovides information well below the Tg. This dataalso illustrates the effectiveness of the Q800 forcharacterizing materials that exhibit very lowstiffness from the glassy plateau, through thetransition region, and well into the rubbery plateau.This is only possible on instruments that havesuperior stress and strain control.
CHARACTERIZING PACKAGING FILMSUSING CREEPIn a thermoforming process, a film is pulled downinto a heated mold to form a desired shape. Theability to produce a stable product can be predictedby using a creep-recovery experiment. Figure 9illustrates data on a packaging film using the tensionmode. In the recovery phase, the equilibriumrecoverable compliance, Jer can be calculated. If thesample compliance is too high, as observed by a highJer, then the elasticity may be too low at the formingtemperature to maintain the desired shape.SHEET MOLDING COMPOUND CUREFigure 10 shows the cure profile of a sheet moldingcompound using the shear mode. In thisexperiment, the sample was heated to 150˚C andthen held isothermally. Data was collected vs. time.The sample first softens then begins to cure,reaching a final maximum modulus. This profile willbe influenced greatly by the heating profile. Anassessment can be made on the trade-off in physicalproperties for various cure profiles by conductingthis experiment under various conditions.PREDICTING MATERIAL PERFORMANCEUSING TIME/TEMPERATURESUPERPOSITIONING(TTS)The TTS technique, well grounded in theory, is usedto predict material performance at frequencies or timescales outside the range of the instrument. Data isusually generated by scanning multiple frequenciesduring an isothermal step-hold experiment over atemperature range. A reference temperature is selectedand the data shifted. A shift factor plot is generatedand fit to either a William-Landel-Ferry (WLF) orArrhenius model. Finally, a master curve at a specifictemperature is generated as illustrated in Figure 11for a PET film sample. Using this technique, propertiesat very high frequencies (short time scales) or verylow frequencies (long time scales) can be assessed.E' Master CurveT r =75˚C1.0E-15 1.0E-8 1.0E-1 1.0E6 1.0E13 1.0E20
THERMAL ADVAN<strong>TA</strong>GE SOFTWAREA quality Thermal Analyzer requires flexible, intelligent software to power it. No onebelieves this more than our software engineers, who have pioneered most of the featurescommonly seen in today's modern thermal analyzers. Thermal Advantage for Q Series software is Microsoft Windows ® based, and expandable to meet growing user needs.THERMAL ADVAN<strong>TA</strong>GE - INSTRUMENT CONTROL• Multitasking – conducts experiments and simultaneously analyzes data• Multimode – can operate up to 8 modules simultaneously• Wizards – guides and prompts in setting up of experiments• Real Time Plot – provides a real-time display of the progress of the experiment• Autoqueuing – permits pre-programmed set-up of future experiments• “How To” Feature – provides extensive, context sensitive assistanceUNIVERSAL ANALYSIS 2000 - DA<strong>TA</strong> ANALYSIS• Single Package – analyze data from all <strong>TA</strong> <strong>Instruments</strong> modules• Picture-in-a-Picture – provides easy one plot analysis of large and small events• Real Time Data Analysis – ability to analyze data “as it arrives”• Ability to create up to 20 simultaneous curve overlay plots• Custom Report Generation – within UA 2000 using Microsoft Word ® & Excel ® templates• Saved Analysis – for quick retrieval of previously analyzed data filesTIME/TEMPERATURE SUPERPOSITIONING (TTS)• Flexible Mutifrequency Data Input – accepts data from ramp or step-hold experiments• Accepts Creep and Stress Relaxation Data• Reference Temperature – user selectable reference temperature• Automatic/Manual Shifting – provides for automatic shifting or manual shifting of data• Shift Factor Curves – includes real-time interaction between curve shift and shift factor graphs• Shift Factor Models– includes both WLF and Arrhenius models• Master Curve– can be stored as separate file and generated at any explicit temperatureMicrosoft Windows, Microsoft Word, and Microsoft Excel are trademarks of Microsoft Corporation
WHY <strong>TA</strong> INSTRUMENTSMore worldwide customers choose <strong>TA</strong> <strong>Instruments</strong> than any competitor as theirpreferred thermal analysis and rheology supplier. We earn this distinction by bestmeeting customer needs and expectations for high technology products, qualitymanufacturing, timely deliveries, excellent training, and superior after sales-support.SALES AND SERVICEWe pride ourselves in the technical competence andprofessionalism of our sales force, whose only business isthermal analysis and rheology. <strong>TA</strong> <strong>Instruments</strong> is recognizedworldwide for its prompt, courteous and knowledgeableservice staff. Their specialized knowledge and experience aremajor reasons why current customers increasingly endorseour company and products to their worldwide colleagues.INNOVATIVE ENGINEERINGOur company is the recognized leader for innovation and cutting-edgetechnology. Representative examples include the Q Series Modules,Modulated DSC ® , the AR 2000 Rheometer with Mobius Drive andSmart Swap , and the Q800 Dynamic Mechanical Analyzer. We invest twicethe industry average in research and development and consistently outpaceour competitors in introducing new products.QUALITY PRODUCTSAll thermal analyzers are manufactured to ISO 9002procedures in our expanded plant in New Castle, DE,USA. State-of-the-art flow manufacturing procedures anda highly motivated work force ensure high quality productswith industry-leading delivery times.TECHNICAL SUPPORTCustomers prefer <strong>TA</strong> <strong>Instruments</strong> because they buy analyzers to solve problemsand often need operation and applications assistance. Our worldwide technicalsupport staff is the largest and most experienced in the industry, and areaccessible daily by telephone, e-mail, or via our website. We also providemultiple training opportunities in our worldwide facilities.
TO CON<strong>TA</strong>CT YOUR LOCAL <strong>TA</strong> INSTRUMENTSTECHNICAL REPRESEN<strong>TA</strong>TIVE VISIT OUR WEBSITEAT WWW.<strong>TA</strong>INST.COM•NEW CASTLE, DE USA - TELEPHONE: 1-302-427-4000•PARIS, FRANCE - TELEPHONE: 33-1-30-48-94-60•BRUSSELS, BELGIUM - TELEPHONE: 32-2-706-0080•LEATHERHEAD, ENGLAND - TELEPHONE: 44-1372-360363•ETTEN-LEUR, NETHERLANDS - TELEPHONE: 31-76-508-7270•ALZENAU, GERMANY - TELEPHONE: 49-6023-96470•MILANO, I<strong>TA</strong>LY - TELEPHONE: 39-02-27421-283•TOKYO, JAPAN - TELEPHONE: 81-3-5479-8418•BARCELONA, SPAIN - TELEPHONE: 34-93-600-9300•MELBOURNE, AUSTRALIA - TELEPHONE: 61-3-9553-0813•STOCKHOLM, SWEDEN - TELEPHONE: 46-8-59-46-92-00<strong>TA</strong> 284