Arab Knowledge Report 2009
Arab Knowledge Report 2009
Arab Knowledge Report 2009
- No tags were found...

You also want an ePaper? Increase the reach of your titles
YUMPU automatically turns print PDFs into web optimized ePapers that Google loves.
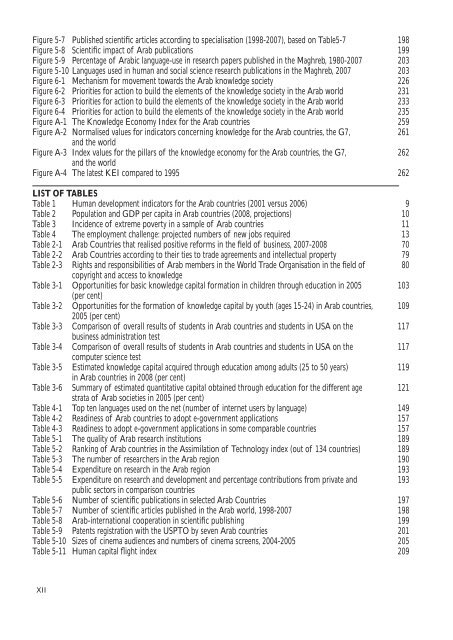
Figure 5-7 Published scientific articles according to specialisation (1998-2007), based on Table5-7Figure 5-8 Scientific impact of <strong>Arab</strong> publicationsFigure 5-9 Percentage of <strong>Arab</strong>ic language-use in research papers published in the Maghreb, 1980-2007Figure 5-10 Languages used in human and social science research publications in the Maghreb, 2007Figure 6-1 Mechanism for movement towards the <strong>Arab</strong> knowledge societyFigure 6-2 Priorities for action to build the elements of the knowledge society in the <strong>Arab</strong> worldFigure 6-3 Priorities for action to build the elements of the knowledge society in the <strong>Arab</strong> worldFigure 6-4 Priorities for action to build the elements of the knowledge society in the <strong>Arab</strong> worldFigure A-1 The <strong>Knowledge</strong> Economy Index for the <strong>Arab</strong> countriesFigure A-2 Normalised values for indicators concerning knowledge for the <strong>Arab</strong> countries, the G7,and the worldFigure A-3 Index values for the pillars of the knowledge economy for the <strong>Arab</strong> countries, the G7,and the worldFigure A-4 The latest KEI compared to 1995LIST OF TABLESTable 1 Human development indicators for the <strong>Arab</strong> countries (2001 versus 2006)Table 2 Population and GDP per capita in <strong>Arab</strong> countries (2008, projections)Table 3 Incidence of extreme poverty in a sample of <strong>Arab</strong> countriesTable 4 The employment challenge: projected numbers of new jobs requiredTable 2-1 <strong>Arab</strong> Countries that realised positive reforms in the field of business, 2007-2008Table 2-2 <strong>Arab</strong> Countries according to their ties to trade agreements and intellectual propertyTable 2-3 Rights and responsibilities of <strong>Arab</strong> members in the World Trade Organisation in the field ofcopyright and access to knowledgeTable 3-1 Opportunities for basic knowledge capital formation in children through education in 2005(per cent)Table 3-2 Opportunities for the formation of knowledge capital by youth (ages 15-24) in <strong>Arab</strong> countries,2005 (per cent)Table 3-3 Comparison of overall results of students in <strong>Arab</strong> countries and students in USA on thebusiness administration testTable 3-4 Comparison of overall results of students in <strong>Arab</strong> countries and students in USA on thecomputer science testTable 3-5 Estimated knowledge capital acquired through education among adults (25 to 50 years)in <strong>Arab</strong> countries in 2008 (per cent)Table 3-6 Summary of estimated quantitative capital obtained through education for the different agestrata of <strong>Arab</strong> societies in 2005 (per cent)Table 4-1 Top ten languages used on the net (number of internet users by language)Table 4-2 Readiness of <strong>Arab</strong> countries to adopt e-government applicationsTable 4-3 Readiness to adopt e-government applications in some comparable countriesTable 5-1 The quality of <strong>Arab</strong> research institutionsTable 5-2 Ranking of <strong>Arab</strong> countries in the Assimilation of Technology index (out of 134 countries)Table 5-3 The number of researchers in the <strong>Arab</strong> regionTable 5-4 Expenditure on research in the <strong>Arab</strong> regionTable 5-5 Expenditure on research and development and percentage contributions from private andpublic sectors in comparison countriesTable 5-6 Number of scientific publications in selected <strong>Arab</strong> CountriesTable 5-7 Number of scientific articles published in the <strong>Arab</strong> world, 1998-2007Table 5-8 <strong>Arab</strong>-international cooperation in scientific publishingTable 5-9 Patents registration with the USPTO by seven <strong>Arab</strong> countriesTable 5-10 Sizes of cinema audiences and numbers of cinema screens, 2004-2005Table 5-11 Human capital flight index1981992032032262312332352592612622629101113707980103109117117119121149157157189189190193193197198199201205209XII