Financial Statements - Hemas Holdings, Ltd
Financial Statements - Hemas Holdings, Ltd
Financial Statements - Hemas Holdings, Ltd
- No tags were found...

Create successful ePaper yourself
Turn your PDF publications into a flip-book with our unique Google optimized e-Paper software.
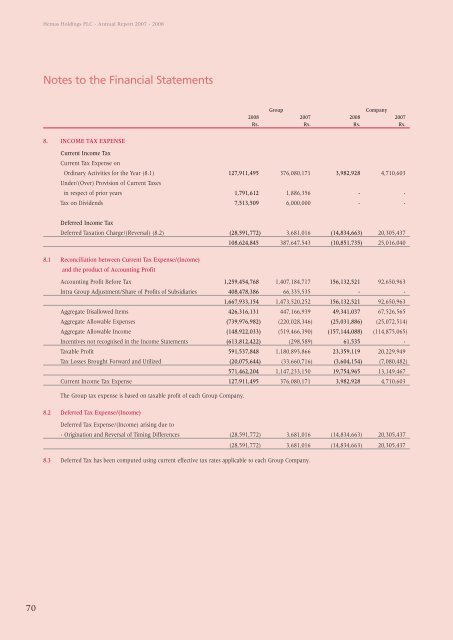
<strong>Hemas</strong> <strong>Holdings</strong> PLC - Annual Report 2007 - 2008Notes to the <strong>Financial</strong> <strong>Statements</strong>GroupCompany2008 2007 2008 2007Rs. Rs. Rs. Rs.8. INCOME TAX EXPENSECurrent Income TaxCurrent Tax Expense onOrdinary Activities for the Year (8.1) 127,911,495 376,080,171 3,982,928 4,710,603Under/(Over) Provision of Current Taxesin respect of prior years 1,791,612 1,886,356 - -Tax on Dividends 7,513,509 6,000,000 - -Deferred Income TaxDeferred Taxation Charge/(Reversal) (8.2) (28,591,772) 3,681,016 (14,834,663) 20,305,437108,624,845 387,647,543 (10,851,735) 25,016,0408.1 Reconciliation between Current Tax Expense/(Income)and the product of Accounting ProfitAccounting Profit Before Tax 1,259,454,768 1,407,184,717 156,132,521 92,650,963Intra Group Adjustment/Share of Profits of Subsidiaries 408,478,386 66,335,535 - -1,667,933,154 1,473,520,252 156,132,521 92,650,963Aggregate Disallowed Items 426,316,131 447,166,939 49,341,037 67,526,565Aggregate Allowable Expenses (739,976,982) (220,028,346) (25,031,886) (25,072,514)Aggregate Allowable Income (148,922,033) (519,466,390) (157,144,088) (114,875,065)Incentives not recognised in the Income <strong>Statements</strong> (613,812,422) (298,589) 61,535 -Taxable Profit 591,537,848 1,180,893,866 23,359,119 20,229,949Tax Losses Brought Forward and Utilized (20,075,644) (33,660,716) (3,604,154) (7,080,482)571,462,204 1,147,233,150 19,754,965 13,149,467Current Income Tax Expense 127,911,495 376,080,171 3,982,928 4,710,603The Group tax expense is based on taxable profit of each Group Company.8.2 Deferred Tax Expense/(Income)Deferred Tax Expense/(Income) arising due to- Origination and Reversal of Timing Differences (28,591,772) 3,681,016 (14,834,663) 20,305,437(28,591,772) 3,681,016 (14,834,663) 20,305,4378.3 Deferred Tax has been computed using current effective tax rates applicable to each Group Company.70