<strong>Hemas</strong> <strong>Holdings</strong> PLC - Annual Report 2007 - 2008Notes to the <strong>Financial</strong> <strong>Statements</strong>37. RELATED PARTY DISCLOSURESDetails of significant related party disclosures are as follows:37.1 Transaction with related entitiesSubsidiaries Others Total2008 2007 2008 2007 2008 2007Rs. Rs. Rs. Rs. Rs. Rs.Nature of TransactionManagement Fees Receivable 12,500,000 10,000,000 - - 12,500,000 10,000,000Consultancy Fees Receivable 137,958,571 42,000,000 - - 137,958,571 42,000,000Bank Guarantee Fees Receivable 1,585,625 1,280,000 - - 1,585,625 1,280,000IT Charges Receivable 59,227,555 56,523,248 - - 59,227,555 56,523,248Rent Receivable 5,301,083 4,608,052 - - 5,301,083 4,608,052Loan Interest Income Receivable 24,569,767 28,072,914 - - 24,569,767 28,072,914Dividend Income Receivable 157,137,674 59,670,000 - - 157,137,674 59,670,000Treasury Loans Granted (709,633,200) (1,161,611,804) (709,633,200) (1,161,611,804)Loan Interest Income Payable (42,176,110) (40,016,446) - - (42,176,110) (40,016,446)Receipt of Services (4,855,106) (4,191,466) - - (4,855,106) (4,191,466)Shared Service Fee Payable (3,228,444) (2,279,412) - - (3,228,444) (2,279,412)Purchase of Air Ticket (4,361,914) (9,617,263) - - (4,361,914) (9,617,263)Treasury Loans Obtained 605,418,447 866,564,500 605,418,447 866,564,500Repayment of Loans (Net) 152,258,543 391,247,903 152,258,543 391,247,903391,702,491 242,250,226 - - 391,702,491 242,250,226Off Balance Sheet itemsGuarantees given by the Company to banks on behalf of related parties are disclosed in Note 35.2 to these financial statement.Terms and Conditions:• Sales and purchase of goods and/or services to related parties were made at on the basis of the price lists in force with non relatedparties, but subject to approved discounts . Property, plant and equipment purchases and sales are made at Net book values ofsurrendering Company. Fees relating to rendering of services were made at agreed prices. Settlement will take place in cash .• Terms and conditions on loans obtained from related parties are disclosed in note 25 and 26 to these financial statements.37.2 Transactions with Key Management PersonnelThe key management personnel are the members of its Board of Directors of <strong>Hemas</strong> <strong>Holdings</strong> PLC.a) Key Management Personnel Compensation2008 2007Rs.Rs.Directors' Fees 3,805,000 3,160,000Emoluments 36,552,438 26,010,271Non Cash Benefits 2,978,893 2,040,31043,336,331 31,210,581b) Transactions, arrangements and agreements involving Key Management PersonnelPurchase of Air Tickets 9,626,254 7,363,2209,626,254 7,363,220No other significant transactions had taken place involving Key Management Personnel & their Close Family Members.94
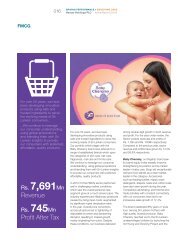
<strong>Hemas</strong> <strong>Holdings</strong> PLC - Annual Report 2007 - 2008Notes to the <strong>Financial</strong> <strong>Statements</strong>38. SEGMENTAL INFORMATIONInformation based on the primary segments (Business Segment)For the year ended 31st March FMCG Healthcare Leisure Transportation Power Others Group2008 2007 2008 2007 2008 2007 2008 2007 2008 2007 2008 2007 2008 2007Rs. Rs. Rs. Rs. Rs. Rs. Rs. Rs. Rs. Rs. Rs. Rs. Rs. Rs.RevenueSegmental revenue - gross 4,871,773,189 5,552,771,741 3,234,294,651 2,854,606,642 945,342,677 863,642,303 570,668,027 507,250,402 5,266,013,484 3,643,389,658 385,173,642 261,129,248 15,273,265,670 13,682,789,994Intra Segmental Revenue (689,347,728) (1,707,286,105) (77,352,698) - - - - - - - (18,603,261) (13,924,157) (785,303,687) (1,721,210,262)4,182,425,461 3,845,485,636 3,156,941,953 2,854,606,642 945,342,677 863,642,303 570,668,027 507,250,402 5,266,013,484 3,643,389,658 366,570,381 247,205,091 14,487,961,983 11,961,579,732Inter Segmental revenue - - (21,670,408) - - - - - - - (302,486,651) (183,443,537) (324,157,059) (183,443,537)Total Revenue 4,182,425,461 3,845,485,636 3,135,271,545 2,854,606,642 945,342,677 863,642,303 570,668,027 507,250,402 5,266,013,484 3,643,389,658 64,083,730 63,761,554 14,163,804,924 11,778,136,195ResultsSegmental Results 537,191,094 622,148,619 265,931,550 226,526,195 74,480,793 94,662,159 157,145,856 149,938,522 570,995,043 522,541,592 (144,025,023) (102,804,594) 1,461,719,314 1,513,012,494Finance Cost (141,846) (279,540) (39,857,590) (11,356,808) (34,568,388) (29,804,289) (8,071,283) (13,082,773) (263,592,840) (218,253,394) (332,599) (149,661) (346,564,546) (272,926,465)Change in Fair Value of InvestmentProperties - - - - - - - - - - 144,300,000 163,385,091 144,300,000 163,385,091Share of AssociateCompany Profit/(Loss) - - - - - - - - - - - 3,713,596 - 3,713,596Profit Before Tax 537,049,248 621,869,079 226,073,961 215,169,387 39,912,405 64,857,871 149,074,573 136,855,749 307,402,202 304,288,198 (57,622) 64,144,432 1,259,454,768 1,407,184,717Income Tax (23,814,024) (222,486,918) (41,620,535) (74,269,676) (14,038,652) (22,194,086) (28,041,010) (34,622,083) (1,110,623) (34,074,780) (108,624,845) (387,647,543)Profit for the Year 513,235,225 399,382,161 184,453,425 140,899,711 25,873,753 42,663,784 121,033,563 102,233,666 307,402,202 304,288,198 (1,168,246) 30,069,652 1,150,829,923 1,019,537,174Attributable toEquity holder of the Parent 513,235,225 399,382,161 184,453,425 140,899,711 10,462,500 28,853,676 121,033,563 102,233,666 307,402,202 304,288,198 (1,168,245) 30,069,653 1,135,418,670 1,005,727,066Minority Interests - - - - 15,411,253 13,810,108 - - - - - - 15,411,253 13,810,108513,235,225 399,382,161 184,453,425 140,899,711 25,873,753 42,663,784 121,033,563 102,233,666 307,402,202 304,288,198 (1,168,245) 30,069,653 1,150,829,923 1,019,537,174As at 31st March FMCG Health Care Leisure Transportation Power Others Group2008 2007 2008 2007 2008 2007 2008 2007 2008 2007 2008 2007 2008 2007Rs. Rs. Rs. Rs. Rs. Rs. Rs. Rs. Rs. Rs. Rs. Rs. Rs. Rs.Assets and LiabilitiesNon Current AssetsProperty, Plant & Equipment 1,173,640,364 504,974,719 81,373,197 204,954,974 1,385,597,301 1,358,923,338 46,135,061 53,797,456 2,466,840,462 2,494,017,256 75,480,619 88,254,160 5,229,067,006 4,704,921,903Investment Property - - - - - - - - - - 1,178,709,950 963,709,950 1,178,709,950 963,709,950Other Non Current Assets 744,807,454 839,091,355 346,016,260 173,040,000 141,502,635 149,935,603 168,401,209 106,560,985 773,146,200 743,462,810 5,617,571,130 5,333,612,346 6,612,734,938 6,381,993,149Segmental Non Current Assets 1,918,447,818 1,344,066,074 427,389,457 377,994,974 1,527,099,937 1,508,858,941 214,536,270 160,358,441 3,248,925,897 3,237,480,066 5,693,051,749 5,421,866,506 13,020,511,894 12,050,625,002Deferred Tax Assets 18,482,425 -Eliminations/Adjustments (6,139,255,709) (6,088,637,244)Total Non Current Assets 6,899,738,610 5,961,987,758Current AssetsSegmental Current Assets 2,057,459,646 1,604,274,368 1,587,074,439 1,305,205,230 904,819,732 753,046,880 1,628,968,099 1,466,516,638 1,858,779,412 1,367,272,083 680,156,066 574,192,550 8,717,257,394 7,070,507,758Tax Refunds 91,994,344 47,509,765Eliminations/Adjustments (2,578,364,640) (1,684,149,754)Total Current Assets 6,230,887,098 5,433,867,759Total Assets 13,130,625,708 11,395,855,51795