2010 ANNUAL REPORT - Watercare
2010 ANNUAL REPORT - Watercare
2010 ANNUAL REPORT - Watercare
- No tags were found...

Create successful ePaper yourself
Turn your PDF publications into a flip-book with our unique Google optimized e-Paper software.
<strong>2010</strong> <strong>ANNUAL</strong> <strong>REPORT</strong>
WATERCARE SERVICES LIMITED <strong>ANNUAL</strong> <strong>REPORT</strong> <strong>2010</strong>Performance Measurement<strong>Watercare</strong> measures its performance against19 objectives covering six key policy areas:POLICY1POLICY2POLICY3POLICY4POLICY5POLICY6Environmental CareTo minimise the adverse impact of thecompany’s operations on the environmentHealth, Safety and Well-BeingTo be an industry-best workplaceStakeholder RelationshipsTo be responsive to stakeholder requirementscustomer ServiceTo provide high-quality products and meetcustomer service level requirementsasset ManagementTo manage and maintain the long-termintegrity of assetseconomic PerformanceTo manage the business efficientlyat minimum pricesCompany VisionOutstanding and affordable waterservices for all the people of Auckland.Front cover: The ageing sewer that crosses Hobson Bay is demolishedas part of Project Hobson. It has been replaced with a high-capacity storagetunnel that runs from Parnell to a pump station in Orakei.About <strong>Watercare</strong><strong>Watercare</strong> Services Limited (<strong>Watercare</strong>) is the bulk water andwastewater service provider for the Auckland region of New Zealand.The company draws water from twelve sources, treats it to A-gradequality and supplies it to six local network operators (LNOs) thatretail it to more than 1.2 million consumers.<strong>Watercare</strong> operates a regional wastewater network, receivingwastewater from Metrowater (Auckland City), Manukau City,Waitakere City Council and United Water (Papakura district)and treating it at the Mangere Wastewater Treatment Plant.The company is owned by the city and district councils of Auckland,Manukau, Waitakere, North Shore, Papakura and Rodney.From 1 November <strong>2010</strong>, as a result of regional governance changes,<strong>Watercare</strong> will become the integrated water and wastewatercompany, providing water and wastewater services directly tothe people of Auckland and be a wholly owned subsidiary of thenew Auckland Council. United Water will continue to retail waterand wastewater services in the Papakura area under an existingfranchise agreement. However, <strong>Watercare</strong> will continue to providewholesale services and own the assets.Project One, referred to throughout this report, consists of relevantexperts tasked with the process of integrating the LNOs and theirretail water and wastewater services into <strong>Watercare</strong>.Integrated Reporting<strong>Watercare</strong> is committed to being a good corporate citizen,providing cost-effective services that balance the social,cultural, economic and environmental impacts of itsdecisions. As the company responsible for deliveringhigh-quality water and wastewater services to the peopleof Auckland it is recognised that our services contributesignificantly to the health and well-being of our community.However, it is acknowledged also that our operations canhave both positive and negative impacts on people and theenvironment. It is due to this belief and a commitment totransparency that <strong>Watercare</strong>’s Annual Report is following theobjectives of integrated reporting as outlined by the Princeof Wales Accounting for Sustainability Project and the GlobalReporting Initiative providing integrated information on thecompany’s environmental, social and governance issues.How to Read the Sustainability Performance Rulers(PAGES 23 – 60)<strong>Watercare</strong> uses sustainability rulers to measure achievements against 19 objectives in six key policy areas. These are intended to allow stakeholders to compare ourperformance against that of previous years. Each ruler comprises 10 units, which are either a measure or an action to be achieved, giving <strong>Watercare</strong>’s performancea score out of 10.Email address to gain furtherinformation about the rulerAchievedPartially achievedG3 table referenceNot achievedA. Objective (a.staffname@watercare.co.nz)Unit of measure 0.5 0.5 28 26 24 22 20 18 16 14 12 10TargetG3TABLEThis year’s performance(out of 10)<strong>2010</strong>9/10BenchmarkPrevious four years’ results for comparison2006 2007 2008 20095.5 6.5 7.5 8.5Results in each policy area are summarised at the start of the chapter in which they are covered. For ease of reading,<strong>Watercare</strong>’s performance against targets in all six policy areas is presented in chart form on page 5.
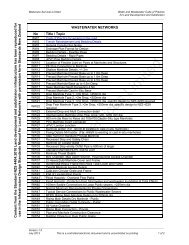
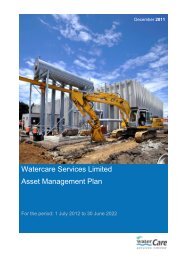
WATERCARE SERVICES LIMITED <strong>ANNUAL</strong> <strong>REPORT</strong> <strong>2010</strong>Water and Wastewater NetworksRODNEY DISTRICTDamWater Treatment PlantWastewater Treatment PlantBulk Water Supply NetworkMain WastewaterCollection NetworkNORTH SHORE CITYAUCKLAND CITYWAITAKEREWAITAKERE CITY HUIAUPPER NIHOTUPUUPPER HUIALOWER NIHOTUPULOWER HUIAHUIA VILLAGEONEHUNGAMANGEREMANUKAU CITYPAPAKURADISTRICTHAYSCREEKPAPAKURAARDMORECOSSEYSWAIROAUPPER MANGATAWHIRIMANGATANGIFRANKLIN DISTRICTWAIKATOWAIKATO DISTRICTWater SupplySystemWastewaterSystemWater TreatmentWater SupplyNetworkWastewaterCollection NetworkMangere WastewaterTreatment PlantÌÌÌÌIncludes:ÌÌÌÌÌÌÌÌÌÌÌÌSources: 10 dams, one river and one underground water source7 water treatment plantsIncludes:ÌÌÌÌÌÌÌÌÌÌ76km of raw water mains469km of treated water mains53 reservoirs31 pump stationsProduced 139,164,000,000 litres of A-grade drinking water316km of sewers53 pump stations102 controlled overflow structuresTreats 111,378,000,000 litres of wastewater annually, equivalent to 260 litresper person per dayProduces 108,900 tonnes of treated biosolids annuallyRecovers biogas from the wastewater treatment process to generate 44 per cent of its electricity needs1
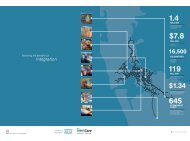
WATERCARE SERVICES LIMITED <strong>ANNUAL</strong> <strong>REPORT</strong> <strong>2010</strong>2009/10This year <strong>Watercare</strong> supplied nearly 135 billion litresof A-grade drinking water to our customers, the localnetwork operators (LNOs), at an average price of53 cents per 1,000 litres. Collectively, the LNOs onsoldthat water to more than 1.2 million consumers in theGreater Auckland area.The company treated 111 billion litres of wastewater at its MangereWastewater Treatment Plant and produced around 109,000 tonnes oftreated biosolids. Over 50 per cent of the electricity used this year atthe Mangere Wastewater Treatment Plant was generated from methaneextracted from biogas, a by-product of the wastewater treatment process.The company’s annual turnover in 2009/10 was $198 million andits assets were valued at $2.4 billion.<strong>Watercare</strong>’s AchievementsThis has been an especially busy year for <strong>Watercare</strong>. As well as deliveringhigh-quality water and wastewater services and making significantprogress on infrastructure projects, the company implemented plans tobecome the integrated water and wastewater supplier to the people ofAuckland, and also responded to a record dry spell over the first fourmonths of <strong>2010</strong>.Project One: working to integrate water and wastewater servicesacross the region into <strong>Watercare</strong>Excellent progress on Project One was made over the year and it remainson target to deliver services direct to the people of Auckland, with minimaldisruption to them, from 1 November <strong>2010</strong>. <strong>Watercare</strong>’s customer basewill grow from six customers to over 430,000 bill payers as a result.<strong>Watercare</strong> and LNO experts worked to integrate LNO asset managementand billing systems. A new system was built and configured during thefinancial year, ready for stringent testing.A new customer centre was established at the Manukau Water premises,with the fitout commencing in July <strong>2010</strong>. In addition, new regionaloperations hubs were established and the logistics for information transferand control commenced.Project One adhered to thorough project management and reportingprinciples throughout the year and elements of the project were subject toindependent audits. Rigorous programme management ensured the projectremained on track and within budget, offering the greatest opportunity forsuccess from 1 November.Other significant company achievements included:Project Hobson nears completionProject Hobson entered the final stage in June when hydraulic jaws begandemolishing the ageing sewer pipe that bisects Hobson Bay. Works toreplace the sewer pipe with a tunnel, and the pump station it connects to,have been under way for three years. In May <strong>2010</strong>, the replacement tunneland pump station entered service full time, providing significantly greatercapacity and reducing the number of wet-weather overflows into HobsonBay. By the final quarter of <strong>2010</strong>, the people of Auckland will be able toenjoy a greater range of recreational activities in the bay as the sewer pipewill be gone, along with all signs of construction.Mangatangi Dam is one of five in the pristine Hunua Ranges, south ofAuckland. Water entering the dam is exceptionally clean because there islittle human activity in the catchment area. In addition, water quality improveswhile it is in the dam as sediment comes to rest on the bed of the lake andbacteria die off in the sunlight.Construction of the Hunua No. 4 Trunk Watermain commencesConstruction of the $250 million Hunua No. 4 Trunk Watermain began in2009 with sections of the watermain being installed under the deck of thenew Manukau Harbour Bridge.The project involves laying a 28-kilometre-long watermain from Manukauto Epsom via Mangere and Onehunga to boost the security of supply. Whilework on most of the route is not scheduled to begin until 2012, work on thesection that crosses the harbour was carried out in 2009/10 in conjunctionwith the New Zealand Transport Agency’s (NZTA) Manukau HarbourCrossing Project.This is a good example of <strong>Watercare</strong> working with other authorities tobenefit the people of Auckland. It minimises the period of disruptioncaused by construction and helps <strong>Watercare</strong> to maintain its positionas a least-cost provider of water and wastewater services.The company has applied for regulatory approvals and entered thedetailed design phase for the remainder of the watermain.Central Interceptor project making good progressThe Central Interceptor was confirmed through the Regional Three WatersStrategic Planning Programme, as the preferred solution to provide additionaltrunk sewer capacity for Auckland. When completed, the new interceptor willcollect wastewater flow from parts of central Auckland and Waitakere Cityand pipe it to the existing Mangere Wastewater Treatment Plant. The CentralInterceptor will also meet the wastewater needs of a growing population andhelp to reduce overflows during wet weather – improving the health of theenvironment. Over the past year the design and consenting phase of theproject has progressed.Puketutu Island biosolids rehabilitation proposal passessignificant milestoneThe proposal to rehabilitate a former quarry on Puketutu Island withbiosolids, and in the process to make it a regional park, was set backwhen planning regulators declined it primarily on cultural grounds.Over the year, <strong>Watercare</strong> listened and worked collaboratively with localiwi, Auckland Regional Council, and Manukau and Auckland city councilstowards resolving outstanding issues.2
WATERCARE SERVICES LIMITED <strong>ANNUAL</strong> <strong>REPORT</strong> <strong>2010</strong>Above: Risk Management Specialist Brian Park and Principal Engineer Alastair Stewart oversee the installationof a new section of the North Shore No. 1 watermain which runs under the Auckland Harbour Bridge.ContentsAbout <strong>Watercare</strong>Key to performance measurementIFCIFCWater and wastewater networks 1<strong>Watercare</strong>'s achievements 2Overview of company activities 4Shareholders and customers 4Responsiveness to stakeholders 4Measuring <strong>Watercare</strong>'s performance 5Sustainability impactsof company activities 6Chairman andTransition Chief Executive's Report 8Directors' profiles 12Executives' profiles 14Governance 16Maori Advisory Group 19Environmental Advisory Group 20Consumer Advisory Group 21Policy 1: Environmental care 23Policy 2: Health, safety and well-being 33Policy 3: Stakeholder relationships 39Policy 4: Customer service 45Policy 5: Asset management 49Policy 6: Economic performance 57Financial report 61Report of the Auditor-General 69G3 cross-reference table 109IndexIBCGlossaryIBC3
WATERCARE SERVICES LIMITED <strong>ANNUAL</strong> <strong>REPORT</strong> <strong>2010</strong>Overview of Company ActivitiesThe <strong>Watercare</strong>-specific provisions of the Local Government Act 1974 require the company to “manage its business efficiently with a view tomaintaining prices for water and wastewater services at the minimum levels consistent with the effective conduct of that business and themaintenance of the long-term integrity of its assets”. A description and map of the water and wastewater networks are shown on page 1.WaterWastewaterAnnual quantities 139,164,000,000 litres 111,378,000,000 litresDaily average quantities 381,270,000 litres 283,954,000 litresPopulation served 1,318,000 985,000Total Water WastewaterAnnual turnover ($000) 198,116 75,679 122,437Asset value ($000) 2,470,790 1,391,228 1,079,562Shareholders and Customers<strong>Watercare</strong>’s OwnersShare-Holding %Customers water wastewaterAuckland City Council 41.6 Metrowater (wholly owned by Auckland City Council) Manukau City Council 25.1 Manukau Water (wholly owned by Manukau City Council) Waitakere City Council 16.7 Waitakere City Council North Shore City Council 11.5 North Shore City Council –Papakura District Council 3.7 United Water (under a franchise agreement with Papakura District Council) Rodney District Council 1.4 Rodney District Council –Responsiveness to Stakeholders<strong>Watercare</strong> encourages the exchange of information with its many stakeholders througha wide range of forums. The company has regular meetings with both its customersand its shareholders, has established community liaison groups associated with itsprojects and operations, and has Maori, environmental and customer advisory groupsto review and advise on its activities. Other stakeholders with whom the companyengages are employees, contractors, suppliers, financiers and the wider public.The company interacts with other groups including regulatory and legislative bodiesin the course of its operations and projects.The company, as part of preparation to be the integrated water and wastewatercompany for Auckland, has recently established a Consumer Advisory Group toprovide independent advise on the commitment to treat all consumers in a fair andequitable manner.<strong>Watercare</strong> continues to evolve the manner in which it reports its activities in responseto feedback from its stakeholders. The stakeholder materiality matrix, published tothe right, is <strong>Watercare</strong>’s summary of issues and their relative importance to some keystakeholder groups. This matrix reflects <strong>Watercare</strong>’s understanding of the perspectivesoffered by stakeholders.Stakeholder Materiality MatrixKey: very importantimportantless importantIssuesDelivery of high-quality waterWater conservation and energy efficiencyClimate change and carbon managementMinimisation of environmental effectsPricing of servicesIntegrated regional planningTalent recruitment and retentionStakeholder groupShareholdersCustomersWider publicEmployeesSuppliers and contractorsRegulatorsEnvironmental groupsMaori groupsFinanciersCOMPANY OVERVIEWWeblinksFigures:Water and wastewater facts Fig. 1Shareholding Fig. 2Customers Fig. 3Financial overview Fig. 4Taxation Fig. 5Local rates Fig. 6Population and water sales Fig. 7For this year’s report, <strong>Watercare</strong> has:ÌÌ Scaled back some reporting as staff focus on Project One; the project to integrate water and wastewater servicesacross the region into <strong>Watercare</strong>. This meant the company did not seek an independent verification report orformal LNO and customer feedback. Similarly, no WSAA Asset Management benchmarking was undertaken.ÌÌ Incorporated information on integration of the Auckland regional water and wastewater services into the reportwhere relevant.This is <strong>Watercare</strong>’s last Annual Report as a wholesale company. Next year’s report will examine performanceand results of the integrated company. Feedback on this report, ideas or suggestions for future reports arewelcomed either online at www.watercare.co.nz or by emailing Brent Evans, Business Planning Manager,at bevans@water.co.nz.4
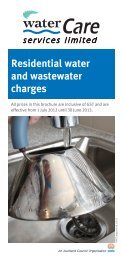
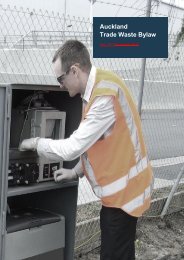
WATERCARE SERVICES LIMITED <strong>ANNUAL</strong> <strong>REPORT</strong> <strong>2010</strong>Measuring <strong>Watercare</strong>'s Performance<strong>Watercare</strong> measures and manages its sustainability performance against 19 objectives in six policy areas. The policy areas are: environmental care;health, safety and well-being; stakeholder relationships; customer service; asset management; and economic performance. The charts below show<strong>Watercare</strong>’s performance this year against a target of 10. For comparison purposes, last year’s level of performance is shown in pale blue.2009 performance9.010.09.08.07.06.05.04.03.02.01.0010.09.08.07.06.05.04.03.02.01.007.08.58.08.59.5Promote cleaner production to industry and minimise waste1 2 3 4 5 6Minimise emissions and reduce carbon footprint9.01010 11 121POLICY: Environmental CareReduce and control odours,overflows and other nuisancesUse energy efficiently and recover energyfrom operational activitiesPromote the preservation of species and protectionof places of significant heritage value impacted by operationsMinimise the impact of treated biosolids and effluent36.5POLICY: Stakeholder Relationships PAGE 39Comply with statutory requirementsParticipate in relevant public policy initiatives andconsultation with the community and stakeholdersMaintain open communications, educational initiatives andrecreational opportunities PAGE 2310.09.08.07.06.05.04.03.02.01.0010.09.08.07.06.05.04.03.02.01.009.09.57.07 8 9137.02POLICY: Health, Safetyand Well-BeingDevelop staff to their full potentialMaintain a working environment that promotesstaff productivity and well-beingProvide staff with safe working conditions4POLICY: Customer Service PAGE 45Continually improve service deliveryto customers PAGE 3310.09.08.07.06.05.04.03.02.01.006.59.09.58.014 15 16 175POLICY: Asset ManagementAchieve continuous improvement in sustainablebusiness performanceAchieve continuous improvement in maintaining assetsLead the development of an integrated solution for themanagement of water, wastewater and stormwater service demandEnsure that capital projects have robust business cases andare delivered to plan10.09.08.07.06.05.0 PAGE 49 PAGE 574.03.02.01.008.0187.0196POLICY: Economic PerformanceEnsure that the costs of providing servicesare consistent with leading practiceEnsure that financial strategies are consistent withachieving economic efficiency, inter-generational equityand optimal cost of capitalWATERCARE MEASURES5
WATERCARE SERVICES LIMITED <strong>ANNUAL</strong> <strong>REPORT</strong> <strong>2010</strong>Sustainability Impacts of Company ActivitiesThis table provides an overview of the sustainability impacts of the company’s majorinitiatives. Projects are listed in detail in <strong>Watercare</strong>’s Asset Management Plan,available on its website: www.watercare.co.nzImpact on key areas: Social Economic Environmentalsustainability impactsInitiative Sustainability Impacts Outcome to Date Outlook <strong>2010</strong>/11Project Hobson: Replacethe 98-year-old sewer thatbisects Hobson Bay with athree-kilometre-long tunnelPuketutu IslandRehabilitation: Rehabilitatea former quarry withtreated biosolids overa 35-year periodCentral Interceptor:Construct a centralwastewater and wet-weatherinterceptor from centralAuckland to the MangereWastewater Treatment PlantHunua No. 4 TrunkWatermain Project:Installation of approximately35 kilometers of trunkwatermain from ManukauCity to central AucklandReliability-CentredMaintenance (RCM)Programme: A programmeto identify when to repair orreplace assetsThree Waters Plan: Continueimplementation of theThree Waters joint planningprocess that consideredregion-wide issues in themanagement of drinkingwater, wastewater andstormwaterWestern Dams Upgrade:Provide environmental flowsinto streams below damsRehabilitation of Pond 2:Rehabilitate a formeroxidation pond, adjacent tothe Mangere WastewaterTreatment Plant, with treatedbiosolidsBy offering greater capacity and storage,the Hobson tunnel allows for populationgrowth and substantially reduces wetweatheroverflows into the bay.The removal of the old sewer willincrease recreational opportunitiesin the bay.The proposal offers a long-term solutionfor the beneficial use of treated biosolidsthat is cost effective, minimises truckmovements through urban areas andresults in a new regional park for thepeople of AucklandThe project will provide for mitigationof pipe failure risks, reduce wastewateroverflows and provide for populationgrowthThe watermain will provide forpopulation growth and will increasethe security of the water supply to theAuckland regionRCM continues to identify the optimummaintenance frequency for assets anddetermines where assets can continueto be used until they need replacing;RCM has also improved the prioritisationof maintenance work duringThe Three Waters implementation planwill provide a coordinated approach tomanaging the three waters to ensurethe needs and expectations of a growingpopulation are metThe upgrades of compensation and freedischarge valves will improve the qualityof the water and aquatic life in thestreams below the dams, and increase<strong>Watercare</strong>’s ability to control lake levelsThe site will be used in the future as anecological reserve. The rehabilitation isa least-cost solution and its proximityto the treatment plant minimises truckmovements of biosolids in urban areasÌÌÌÌÌÌÌÌCompleted the construction worksPump Station 64 handed over toOperationsDemolition of old sewer commencedContinued to engage with the localcommunityÌÌ Reconfirmed economics of project afterthe Auckland Regional Council (ARC)declined applications for resource consentand the Manukau City Council (MCC)recommended <strong>Watercare</strong>’s Notice ofRequirement be withdrawn in 2008/09ÌÌ Worked with affected stakeholderstowards resolving outstanding issuesÌÌ Continued focus on concept design,consultation and preparation of resourceconsent applicationÌÌ Engaged in public consultation. Particulareffort has been targeted at contentiousareas of the alignmentÌÌ Applied for regulatory approvals (ResourceConsent and Notices of Requirement)Detailed design under wayÌÌÌÌÌÌCompleted construction of the newpipeline on the SH20 Manukau Harbourbridge crossingWorked collaboratively with stakeholdersto maximise mutual benefit, e.g. workingwith planned road work programmes.ÌÌ Optimisation of the RCM programme isnow under way. The objective is to deliverthe most efficient and cost-effectivemaintenance programme for <strong>Watercare</strong>ÌÌ Work commenced on replacing theexisting computerised maintenancemanagement system (CMMS)ÌÌ Draft Three Waters ImplementationPlan preparedÌÌ Investigations and planning for the newCentral Interceptor sewer, identified aspart of Three Waters planning, whichextends from central Auckland toMangere, are progressingÌÌ Completed work on Lower Huia, Lowerand Upper Nihotupu and Waitakere damsÌÌ Commenced work on Upper Huia DamÌÌ Engaged in public consultation regardinglandscaping plansÌÌ Submitted landscaping plans to the ARCand MCC for approvalÌÌ Continued progress with rehabilitatione.g. plantingÌÌ Complete all outstanding works by30 September <strong>2010</strong>ÌÌ Complete demolition of all old structuresby 30 September <strong>2010</strong>ÌÌ Complete demobilisation from projectsites by December <strong>2010</strong>ÌÌ Continue to engage with the localcommunityÌÌObtain endorsement of Waikato-TainuiÌÌ Settle final appeals to theEnvironment CourtÌÌ Commence detailed designÌÌ Commence the concept design andresource consent process for completionby 2014ÌÌ Complete work on Phase 1 of theproject by 2025ÌÌÌÌÌÌÌÌComplete regulatory consents processMaintain ongoing stakeholderrelationships with affected partiesContinue with detailed design andprocurement strategy for long-lead itemsOptimise RCM modelsÌÌ Modify and align RCM models to suitCMMS requirementsÌÌ Develop RCM asset hierarchy forRosedale Wastewater Treatment Plant andassociated water and wastewater pumpingstations as part of integrationÌÌ Progress replacement CMMSimplementationÌÌ Communicate with the Auckland Councilregarding input to finalise the draftimplementation planÌÌ Develop a water demand managementplan and prepare long-term infrastructuredevelopment plans for delivering watersupply and wastewater services throughto 2062ÌÌ Complete work on Upper Huia DamÌÌ Continue rehabilitation (The capacity ofPond 2 for rehabilitation by biosolids willlast until 2013)ÌÌ Obtain approval of landscaping plansfrom ARC and MCC6
WATERCARE SERVICES LIMITED <strong>ANNUAL</strong> <strong>REPORT</strong> <strong>2010</strong>Opposite: Left: Reticulation Serviceperson Trevor Pimlott services an air valve on the Waikato watermain.Middle: A kingfisher watches the demolition of the ageing sewer that crosses Hobson Bay.Right: Data Technician Sarah Muir and Water Resources Manager Deborah Corneby look at rain level data for the Lower Nihotupu Dam.Initiative Sustainability Impacts Outcome to Date OutlookEnergy Focus:Increasing internalpower-generationfacilities and minimisingenergy consumptionWater DemandManagement:Coordinate regionalmanagementInternal power-generation facilities meet44 per cent of <strong>Watercare</strong>’s total energyneeds. Capturing biogas for energygeneration minimises damage to theatmosphere because – if released –it is 21 times more damaging thancarbon dioxideHydro generation also provides acarbon free contribution of electricityfrom energy stored in the watersupply damsWater use per capita declined by 6.1per cent across the region comparedwith the base year of 2004 due to theeconomic downturn and LNO waterdemand management initiatives such asleak controlÌÌ Improved availability of hydroelectric generatorand signed off completion of the project with theMinistry for the EnvironmentÌÌ Developed optimisation tool to help identify whenbiogas cogeneration engines should be started andstopped to minimise energy costsCompleted feasibility study on wind powerÌÌÌÌInvestigated Electricity Commission incentiveprogrammes for motor replacement and power'interruptibility'ÌÌ Furthered development of the regional demandforecasting model to include a cost-benefit analysisof demand management initiativesÌÌ Identified a future target of 15 per cent reductionin water demand by 2025ÌÌOptimise engine running routinesÌÌ Identify opportunities to deploy pump efficiencymonitoring and control routines together withcondition monitoringÌÌ Review opportunities for implementingreal-time energy optimisation toolsÌÌ Monitor power prices to determine when windgeneratedpower becomes financially feasibleÌÌ Replace selected motors under the motorbounty scheme run by the ElectricityCommissionÌÌ Obtain operating data to determine viabilityof the Electricity Commission powerinterruptibility schemeÌÌ Use survey results to target areas forimplementing water demand managementand communications strategiesÌÌ Undertake further surveys to improve<strong>Watercare</strong>’s understanding of demand driversGraduate EngineeringProgramme: To supportGraduates in gainingchartered status andraise <strong>Watercare</strong>’s profileas an employerProject Improve:Staff generate ideasthrough the ContinuousImprovement schemeThe programme will enable engineeringgraduates to gain widespreadexperience and exposure during theirearly career with <strong>Watercare</strong>. The TrioProgramme involves young engineersfrom <strong>Watercare</strong>, McConnell Dowell andGHD undertaking experience in a rangeof significant projects at each companyThe scheme is delivering improvementsto business practices through thegeneration of efficiency, effectivenessand health and safety ideasÌÌ Graduate Trio Programme continues and sixGraduate Engineers gained Certified ProfessionalEngineer statusÌÌ Continued support of graduate engineering groupactivitiesÌÌ IPENZ mentors’ group formally establishedÌÌ Professional Development Partner Status renewedÌÌ Implemented several ideas from staff includinga contractor tracking system at plants and a trolleyfor sewer maintenance workÌÌ Fortnightly presentations to senior management onall aspects of business performance were suspendedin <strong>2010</strong> to concentrate on Project One workÌÌÌÌÌÌÌÌContinuous improvement of programmeDevelopment of quarterly reporting frameworkto facilitate experience recording for graduatesRefinement of Graduate Trio ProgrammeExtend renewal period for graduate engineersin the programmeÌÌ Project Improve’s fortnightly presentations willresume in 2011ÌÌ Continue to encourage and recognise ideasfrom staff consistent with company values e.g.'efficient' – more for lessEngaging with thecommunityMidge Control: At theMangere WastewaterTreatment PlantOdour Control: From theMangere WastewaterTreatment Plant andthe wastewater networkTree Planting: Ina range of areasthroughout the GreaterAuckland area<strong>Watercare</strong> CoastalWalkway: 13-kilometrepublic walking trackMaster Planning:Planning to ensurefacilities andinfrastructure canmeet the needsof a growing regionThe company engages incommunication with stakeholdersusing a variety of mediaThe programme reduces midgepopulations and habitats, andconsequently minimises nuisancemidge outbreaks in the local communityOdour control measures minimise theimpact of odour on the local communityThe projects support community-ledtree planting initiativesThe public track links important publicreserves to the north (Ambury Farm Park)and south (Otuataua Stonefields) of theMangere Wastewater Treatment PlantMaster plans involve a comprehensivereview of major facilities to ensurethey are able to meet future capacityrequirements and predicted regulatoryrequirements in a cost-effective mannerÌÌ Increased the number of schools participating inAdopt A Stream programmeContinued to provide Rain Forest Express serviceÌÌÌÌEstablished a Consumer Advisory Group to consulton customer and community issues in preparationfor integrationÌÌ Conducted regular field surveys of midge speciesand numbersÌÌ Implemented proactive measures based onmonitoring results including targeted control ofjuvenile midge stages prior to hatchingÌÌWorked with the ARC to revise resource consentsrelated to midge control. Based on research andnew information, the monitoring requirements wererelaxed resulting in significant cost savingsÌÌ Completed odour buffer land adjacent to GreenwoodRoad, MangereÌÌ Managed odorous processes and maintainedeffective operation of biofilter odour bedsÌÌ Extended fixed deodoriser dispensing fence to coverwider area with two standby mobile deodoriser unitsImplemented the monthly boundary odour surveyÌÌÌÌÌÌÌÌÌÌContinued riparian planting with the WaikatoRiverCare TrustContinued riparian planting on public and privateproperty in the Waitakere and Hunua rangesPlanted 4km of riparian margin in Orurangi CreekContinued native tree-planting programmes for localschools through Trees For SurvivalÌÌ Planted over 1,400 native plants in 2009/10 toimprove planting density and replace failuresÌÌ The Huia Water Treatment Plant Master Plan isbeing preparedÌÌ The Mangere Wastewater Treatment Plant MasterPlan is being preparedÌÌ Continue Adopt A Stream programme and<strong>Watercare</strong>-led science lessonsÌÌ Continue the Rain Forest Express serviceÌÌ Continue with stakeholder newsletters asappropriateÌÌ Implement retail services as part of integrationincluding the development of a customer centrebased at East TamakiÌÌ Establish customer centres around the regionin preparation for integrationÌÌ Continue the intensive midge controlprogrammeÌÌContinue the monthly boundary odour surveyÌÌ Continue the odour monitoring programmeÌÌ Assess the plant odour control systemperformanceÌÌ Manage community relations regarding odoursÌÌ Continue to manage the riparian plantingproject for the Waikato RiverCare TrustÌÌ Undertake a revegetation trial at ArdmoreWater Treatment Plant on the edge of thesludge placement areaÌÌ Continue riparian planting in the Waitakereand Hunua rangesÌÌ Continue support of Trees For SurvivalprogrammeÌÌ Ongoing maintenance of plantsÌÌÌÌÌÌContinue with the Huia Master PlanContinue work on the Mangere Master PlanCommence work on the Water andWastewater Network Master Plansustainability impacts7
WATERCARE SERVICES LIMITED <strong>ANNUAL</strong> <strong>REPORT</strong> <strong>2010</strong>Chairman and Transition Chief Executive's Report Graeme HawkinsChairman Ian PartonTransition Chief Executive“<strong>Watercare</strong> is about to enter a challenging new era as the provider of water and wastewaterser vices to the people of Auckland. A great deal of ef for t has gone into ensuring the costsof integration were accommodated within existing budgets, maintaining our minimum costcommitment and reducing the risk of future price shocks.”Graeme Hawkins, Chairman“Over the last 12 months, the company has made many important steps towards becoming the integrated waterservices company for Auckland while at the same time managing services over a record dry spell and continuingto deliver important projects on time and within budget.”Ian Parton, Transition Chief Executivechairman and transition chief executive's report8This past year has been one of the most significant in <strong>Watercare</strong>’shistory as the company has prepared to integrate the assets andservices of the region’s local network operators (LNOs). On 1 November<strong>2010</strong>, <strong>Watercare</strong> will assume responsibility as the water servicescompany for the people of Auckland 1 and will gain close to 430,000new customers. It will become one of the largest infrastructurecompanies in New Zealand with assets in excess of $6 billion,annual turnover exceeding $500 million and 650 staff.The logistics and scale of work required to bring together the region’swater and wastewater service providers with their different asset, billingand financial systems and processes have been significant. In order tomanage the change process a team of <strong>Watercare</strong> and LNO experts werebrought together to form ‘Project One’. Over the past 12 months, theprimary focus of Project One has been on making certain the people,processes and procedures are in place to ensure levels of service aremaintained to all customers from 1 November <strong>2010</strong>.The executive management team has been established and therecruitment of staff for the integrated company is well advanced.One of the most significant areas of work was the development of acommon asset management and billing system to replace the variousLNO systems. This new system was built and configured and is nowundergoing testing. A new customer centre was established at theManukau Water premises and regional operations hubs were identifiedfor managing regional services.In keeping with the scale and significance of Project One, we werecareful to ensure that rigorous project management and reportingpractices were followed. These included independent audits ofthe programme office, the key work-streams and tasks as well asa readiness audit for 1 November. Rigorous project managementdiscipline and project governance has kept Project One on trackand within budget, with a minimal amount of disruption offeringthe greatest opportunity for success.1. United Water will continue to retail water to customers in the Papakura area under an existing franchise agreement;however <strong>Watercare</strong> will own the assets.We would like to thank Gary Swift for his contribution as Acting ChiefExecutive from June 2009 to December 2009. Gary stepped up to takeon the role after Mark Ford left to become Executive Chairmanof the Auckland Transition Agency. Gary's leadership helped to preparethe organisation for a period of significant change associated withintegration while also ensuring business continuity was maintained.It is particularly pleasing to note that the whole company has workedto manage and reprioritise the timing of expenditure to ensure theintegration costs could be accommodated within existing budgets whilstmaintaining our minimum cost commitment. Our staff have maintaineda high level of commitment to the change process as well as to theongoing delivery of high-quality water and wastewater services. It isheartening to have such passionate and committed people who willbe fundamental to the success of the integrated business.The change process affected the composition of the <strong>Watercare</strong> boardtoo. In January <strong>2010</strong> the board said farewell to Terry Kayes whoseterm as a director for the company ended. Ian Parton resigned also,to take up the role of Transition Chief Executive for the company.In March, Ross Keenan, Chairman of Metrowater, and Peter Drummond,a Manukau Water director, both joined the <strong>Watercare</strong> board, bringing
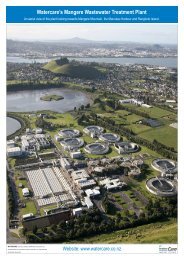
WATERCARE SERVICES LIMITED <strong>ANNUAL</strong> <strong>REPORT</strong> <strong>2010</strong>Water Network Operator Merrik Pirake (rear) and reticulation servicemen Phillip Pirake and Trevor Pimlott shut down the North Shore Watermainin preparation for upgrade work on the Auckland Harbour Bridge.9
WATERCARE SERVICES LIMITED <strong>ANNUAL</strong> <strong>REPORT</strong> <strong>2010</strong>Auckland Transition Agency Executive Chairman Mark Ford sounds a horn to signal the start of demolition work being undertaken as part of Project Hobson. He is joined by AucklandCity Councillor Douglas Armstrong (far left), <strong>Watercare</strong> Chairman Graeme Hawkins, Auckland Regional Council Chairman Mike Lee and <strong>Watercare</strong> Transition Chief Executive Ian Parton.chairman and transition chief executive's reportextensive experience in the retail water and wastewater sector. In theinterests of transparency, independent observer Jane Latimer andAuckland Transition Agency representative Brian Monk attended boardmeetings also over the transition period.Over the past year, demands on the board have increased significantly.Directors moved to fortnightly meetings in <strong>2010</strong> to manage theinformation and decision workload associated with integration.Furthermore, an amendment to the Trade Waste Bylaw, as a resultof integration, created additional demands on directors’ time.The company undertook a comprehensive strategic planning processas it prepared for integration and developed a strategic framework,new vision and company values. The strategic framework will helpto coordinate and drive decision-making to address the challengesassociated with being the water and wastewater services company forthe people of Auckland.Regionally-focused initiatives began to be developed, such as thepreparation of a Regional Asset Management Plan which covers a 20-year period and will represent <strong>Watercare</strong>’s tactical plan for managingWeblinksFigure:Directors’ meeting attendance Fig. 8the company’s infrastructure cost-effectively to achieve it's longtermgoals. A regional plan offers the opportunity for the integratedmanagement of bulk and local networks to provide future prospectsfor regional prioritisation and coordination of initiatives to deliverefficiencies and cost savings. Long Term Infrastructure Plans (50-yearplans) and Facility Plans (five-year plans) also are being developed insupport of the regional plan.Despite the extra work created by integration, the company maintainedits focus on the delivery of some significant projects. This yearconstruction work was completed on Project Hobson, with thewastewater storage tunnel and high-capacity pump station enteringfull-time operation. Already, the number of wet-weather overflowsoccurring in Hobson Bay has reduced. Work to demolish the ageingsewer that bisects the bay has begun. This will enhance the areaboth in terms of aesthetics and recreational opportunities.Good progress was made on the Hunua No. 4 Trunk WatermainProject. <strong>Watercare</strong> worked cooperatively with other agencies andstakeholders to maximise opportunities to construct sectionsin conjunction with other works. Most significant has been theconstruction of the section suspended under the new ManukauHarbour Bridge. Such cooperation minimises future public disruptionand maximises efficiencies of working together for public benefit.Regulatory consents and notices have been applied for and a hearingis scheduled for August <strong>2010</strong>. Consultation with people most affectedby the alignment and construction of the watermain continues.10
Chairman and Transition Chief Executive's Report continuedWATERCARE SERVICES LIMITED <strong>ANNUAL</strong> <strong>REPORT</strong> <strong>2010</strong>The proposal to rehabilitate a former quarry on Puketutu Island withtreated biosolids progressed after the consents were declined in 2009.<strong>Watercare</strong> worked constructively and cooperatively with iwi to resolveoutstanding issues and is now looking to settle the appealsto the Environment Court which will allow the project to proceed.The company's relationship with iwi is important to the success ofthese types of projects. In 2009, a Memorandum of Relationship withTainui was signed that recognises both parties’ roles and the desireto work together to build a strong, balanced and enduring relationship.The team working on the Central Interceptor Project, which involvesthe development a large-diameter tunnel to store and move wastewaterfrom parts of Auckland and Waitakere to the Mangere WastewaterTreatment Plant for processing, continued to make good progresson the design and consenting phase.On top of the usual project workload and additional demandsof preparing for integration, the Auckland region faced the driest fourmonthperiod (January to April) in 100 years of records for the Waitakerecatchment and 50 years of records for the Hunua catchment. In response,<strong>Watercare</strong> maximised production from the Waikato Water Treatment Plantto preserve lake storage and ran a ‘use water wisely’ publicity campaign toreduce demand. As a result of these actions, combined with high rainfallover winter 2009, the region avoided mandatory water restrictions. Waterlevels in the storage dams returned to normal in May.The record dry spell highlighted some of the challenges we face indelivering high-quality undisrupted water to a region which continuesto grow. Over the year planning work progressed on the timing ofthe next Waikato Water Treatment Plant upgrade to take and treatadditional water from the Waikato River and a decision was made toincrease plant capacity in 2012. While the additional water sourcedfrom the river remains within the limits of the current resourceconsent, future water sources for Auckland will be more costly to bothsource, treat and distribute than our gravity-fed dam supplies.This year <strong>Watercare</strong> achieved an operating surplus from trading of$9.1 million. This was primarily due to maintaining tight control overoperating costs and increased revenue as a result of good water salesover the summer drought period.<strong>Watercare</strong> actively uses interest rate swaps to manage its interest costsfrom borrowing. As a result of the revaluation of these interest rateswaps to market values, which is required under current accountingstandards and tax rate changes to the depreciation of buildings,the reported net loss after tax was $27.7 million.We would like to thank our existing customers – the councils andLNOs – for their cooperation and support through this period ofsignificant change. Furthermore, we would like to also acknowledgeour shareholders for their support over the transition period.We look forward to continuing the productive relationships withthe new shareholder, the Auckland Council, following integration.As we move into a new era of local government, the company remainscommitted to delivering outstanding services at an affordable price.Our focus on business efficiency and minimising costs will continuewhile ensuring reliable services are delivered to our customers.We will also continue our commitment to being a good corporatecitizen and to integrated reporting that reflects the important role weplay in contributing to the health and well-being of our communities.On 30 August <strong>2010</strong> the company announced the price for water effectivefrom 1 July 2011 at $1.30 (including 15% GST) for 1,000 litres. It wasparticularly pleasing for the board to note that the long awaited benefitsfrom industry integration in Auckland were able to be delivered at such anearly date, a great tribute to management and staff involved. <strong>Watercare</strong>pricing and its tariff structure will be the subject of discussions with thenew Auckland Council and will come into force on 1 July 2012, the dateat which the new property rating system for the region commences.This will be the last annual report we complete in our current roles aswe both finish our terms with <strong>Watercare</strong> in the current financial year.It is with tremendous pride that we review the company’s performanceover my eight years as Chairman and Ian’s ten years, first as a director,then Deputy Chairman and finally as Transition Chief Executive. We aredelighted to have played a part in the company’s success and thankmanagement, staff and fellow directors for their support over this time.G S HawkinsChairmanI PartonTerry KayesDirector of <strong>Watercare</strong> Services Ltd (2007 to <strong>2010</strong>)Transition Chief ExecutiveTerry was managing director of Tonkin and Taylor Ltd, a specialistenvironmental and engineering consultancy, for 17 years. He joinedthe Board in 2007 and served for three years until his tenureexpired in January <strong>2010</strong>. Terry’s former experience and engineeringexpertise were welcomed by the Board during his term as a director.Over this time Terry made a valuable contribution to the Boardas the company achieved some significant milestones includingthe completion of the Three Waters Strategy, excellent progresson Project Hobson, the Puketutu Island rehabilitation project,the Hunua No. 4 upgrade as well as the early stages in preparationfor integration of the water industry. Terry’s service and commitmentto the success of <strong>Watercare</strong> are gratefully acknowledged.WeblinksStories:Hydraulic jaws take first bite out of ageing sewerStaff in awe of the scale of HobsonHobson’s HeroesConstruction underway on Hunua 4Campaign heats up despite break in dry spellFigure:Organisational structure Fig. 9Chairman and transition Chief executive's Report11
WATERCARE SERVICES LIMITED <strong>ANNUAL</strong> <strong>REPORT</strong> <strong>2010</strong>Directors' Profiles11 Graeme Hawkins, 63BSc BCom ACA FInstDChairmanGraeme Hawkins has extensive experience in senior management roles in the private sector and as a professional director.He has held senior roles in Fletcher Challenge and was the chief executive of Dominion Breweries in the late 1980s.General disclosure of interests: Chairman: Southern Cross Medical Care Society; Southern Cross Health Trust.Director: Biomed Holdings Ltd; Cavalier Corporation Ltd; Stableburn Farms Ltd; Hawkins Consulting Services Ltd;Ports of Auckland Ltd.22 David Clarke, 51BE (Hons) ME BBS MBA MInstD FNZIMDavid Clarke has considerable experience in the areas of biotechnology, IT, health, food and related sectors. He has been theinaugural chair for multiple technology industries and has strong commercial and governance skills. His background includesengineering, finance, marketing and sales. He is a fellow of the New Zealand Institute of Management, a member of the RoyalSociety and member of the Institute of Directors.General disclosure of interests: Chairman: Hawkins Watts Ltd; Optima Corporation Ltd; TRGG Ltd; NZ Institute ofRural Health; Kordia Ltd. Director: Cranleigh Merchant Bankers; Ngai Tahu Tourism Ltd; Hynds Group Ltd; KODE Biotec Ltd.Trustee, South Auckland Foundation (Middlemore/CMDHB).33 Peter Drummond, 57FInstDPeter Drummond is an experienced director and chairman with extensive international business management and marketingexperience. He was chairman of <strong>Watercare</strong> previously and brings extensive knowledge of both the wholesale and retail waterservices industry. Peter rejoined the <strong>Watercare</strong> board in March <strong>2010</strong> and remains a director with Manukau Water. He has alsoserved on the board of Vector, Mid Central Health and Hort Research Ltd as well as a large range of community organisationslike Variety, the children’s charity.General disclosure of interests: Chairman: United Fire Brigade Association; Appliance Connection Ltd;Waitemata Harbour Clean Up Trust; Motat, Variety Medical Missions South Pacific. Director: Manukau Water Limited;NARTA New Zealand Ltd; NARTA International pty Ltd.44 Susan Huria, 50FPRINZ MInstDSusan Huria is a specialist in the Maori sector working with Maori organisations on constitutional reviews, board appointments,support and strategic advice. She has extensive governance, marketing communications and general management experience.Susan was an executive at Auckland International Airport and worked in marketing and communications for 10 years, beforestarting her own management practice in 2000, Huria Anders.General disclosure of interests: Deputy Chair: AgResearch Ltd. Director: Manukau Leisure Services Ltd; Northland PortCompany Ltd; Director and Shareholder: Huria Anders Ltd; Susan Huria (2003) Associates Ltd; Te Ara Tika Properties Ltd.Director: Vermilion Design Ltd; Airways Corporation of New Zealand Ltd. Trustee, First Foundation.55 Ross Keenan, 66BCom FCITDeputy ChairmanRoss Keenan joined the board in March <strong>2010</strong> and is an experienced company director with corporate governance andexecutive experience across a diverse range of companies including airways, tourism, telecommunications, health and propertydevelopment. He has particular knowledge and experience in the retail and wholesale water and wastewater services industryand is currently chairman of Metrowater.General disclosure of interests: Chairman: Metrowater Ltd; Allied Work Force Group Ltd; Ngai Tahu Tourism Ltd.Director: Ngai Tahu Seafood Ltd; Ngai Tahu Holdings Corporation; Touchdown Ltd; Auckland Regional Transport Network Ltd.66 Patrick Snedden, 55BCom BAPatrick Snedden has considerable experience in corporate governance. He is chairman of both the Auckland District HealthBoard and Housing New Zealand Corporation. He also has extensive commercial experience with Maori organisations and hasa sound understanding of the role public sector organisations play in the community.General disclosure of interests: Chairman: Auckland District Health Board; Housing New Zealand Corporation Ltd;Hobsonville Land Company Ltd; Tamaki Plan Development Board; Quality Improvement Committee. Director: SneddenPublishing and Management Consultants Ltd.directors' profiles1277 Jeff Todd, 68CBE BCom FCA FInstDChairman of the Audit and Risk CommitteeJeff Todd is a chartered accountant and company director and was formerly managing partner for New Zealand and thePacific for Price Waterhouse (now PricewaterhouseCoopers). He is a former chairman of the Southern Cross Medical CareSociety, Southern Cross Healthcare Trust and the New Zealand Guardian Trust Company Ltd; and a director of the ReserveBank of New Zealand and the ANZ Banking Group (NZ) Ltd. He has a particular interest in corporate governance and is afellow of the Institute of Directors.General disclosure of interests: Chairman: Dynasty Hotel Group Limited. Deputy Chairman: Sanford Limited. Director:National Research Centre for Growth and Development; Medical Research Foundation. Trustee, Goodfellow Foundation andPostgraduate Medical Society (School of Medicine, University of Auckland); Christian Healthcare Trust. Member, Aotea CentreBoard of Management.NOTES: The company has a deed of indemnity with each director that indemnifies the director in accordance with the company’sconstitution and grants certain rights in respect of access to documents and the maintenance of liability insurance cover.There were no specific disclosures of interests by directors in 2009/10.
WATERCARE SERVICES LIMITED <strong>ANNUAL</strong> <strong>REPORT</strong> <strong>2010</strong><strong>Watercare</strong> Services Limited head office building in Newmarket.13
WATERCARE SERVICES LIMITED <strong>ANNUAL</strong> <strong>REPORT</strong> <strong>2010</strong>Executives' Profiles11 Ian Parton, 64BE (Hons) PhD DistFIPENZ FInstDTransition Chief ExecutiveIan Parton became the Transitional Chief Executive for <strong>Watercare</strong> in January <strong>2010</strong> with the role of overseeing the transition froma wholesale company to the integrated retail provider of water and wastewater services for Auckland from 1 November <strong>2010</strong>. Ianwas previously the Deputy Chairman of <strong>Watercare</strong> and has been a director of the company since 2001. He has a long career inconsulting engineering and was previously Chief Executive of Worley (now AECOM). Ian is a distinguished fellow of the Institutionof Professional Engineers and a fellow of the Institute of Directors.22 Gary Swift, 62BCA CA CTPChief Financial OfficerA chartered accountant and former councillor and Board member of the New Zealand Institute of Chartered Accountants withnearly 30 years’ experience in corporate financial management, Gary’s responsibilities include business information systems,commercial services, procurement, treasury and accounting. He was Acting Chief Executive of <strong>Watercare</strong> between Mark Ford'sdeparture in June 2009 and the appointment of the Transition Chief Executive in January <strong>2010</strong>.Team Results: Maintained the funds from operations to interest rate cover above 2.5 times before any price adjustmentas part of the debt guarantee with shareholders; organised new funding to replace maturing debt and to fund future businessrequirements; achieved financial targets.Outlook: Continue to meet financial targets with a focus on maximising cost effectiveness in the integrated business;optimise funding arrangements; manage implementation of new IT system (SAP); undertake expanded credit managementand accounting associated with the integrated business.33 Tim Munro, 48BE (Hons) MIPENZ CPEng IntPEActing Chief Infrastructure OfficerTim has worked for <strong>Watercare</strong> for 15 years, most recently as Manager Projects. He has managed a number of significantand complex infrastructure projects to completion and has an excellent understanding of the company’s business and assetmanagement requirements. In 2009, he was seconded to the role of Acting Chief Infrastructure Officer while Graham Woodmanaged the integration of water and wastewater services for the Auckland region.Team Results: Oversaw the Fletcher-McConnell Dowell joint venture completion of the pump station constructed as partof Project Hobson and demolition of the old sewer; progressed negotiations regarding the Puketutu Island proposal; continuedplanning for the Central Interceptor Project; completed sections of the Hunua No. 4 Trunk Watermain Project includinglodgement of consents; successfully executed major projects on time and within budget; began preparation of Regional AssetManagement Plan (RAMP).Outlook: Complete Puketutu Island proposal and resolve all appeals; gain consents for the Hunua No. 4 Trunk WatermainProject; progress master plans for water treatment plants; complete the RAMP.4564 Raveen Jaduram, 48ME BE (Hons) FIPENZChief Operating OfficerRaveen was appointed to the role of Chief Operations Officer in early <strong>2010</strong>. He has also retained his role as Chief Executiveat Manukau Water Limited during the transition period to help manage the integration of services to <strong>Watercare</strong>. Raveenhas extensive experience in the New Zealand water industry and has previously held management roles at Metrowater and<strong>Watercare</strong>. He also has significant local government experience, having held various management and engineering positionsat Auckland City, Manukau City and Auckland Regional councils. Raveen is a former president and board member of theNew Zealand Water and Wastes Association, and New Zealand delegate to the Water Environment Federation, USA.Team Results: Met customer contract obligations fully; maintained Ministry of Health ‘Aa’ grades for water treatment andsupply; maintained ISO 9001 and ISO 14001 accreditation, safety and environmental management systems; implementedoperational efficiency gains across water and wastewater operations.Outlook: Maintain service delivery standards to regional customers; continue to comply with requirements of the ResourceManagement Act; maintain optimisation of regional water and wastewater operations; continue introduction of improvedmaintenance strategies to key water and wastewater assets; engage proactively with the infrastructure business unit to ensureoperational issues are fully considered.5 Mark Lawrence, 44Chief Customer OfficerMark Lawrence joined <strong>Watercare</strong> in January <strong>2010</strong> to take up the new position of Chief Customer Services Officer responsible forestablishing and managing the new customer services function of the integrated <strong>Watercare</strong>. Mark has over 20 years’ experiencewithin customer services and over eight years in utility customer services and management. He was most recently with ErgonEnergy in Australia, responsible for frontline customer service to over 650,000 customers.Team Results: Mark is a member of the Project One team preparing for integration and has led the development of the newcustomer business unit. This has involved work to establish the customer centre at Manukau, design of the customer invoiceand contract as well as preparation of new customer processes and the appointment of customer services staff.Outlook: From 1 November <strong>2010</strong>, the Customer Services Business Unit will begin to manage retail services to almost430,000 customers across the Auckland region. The team’s aim is to create as little disruption as possible to new customerswhile helping to also build a customer-focused company that is reliable and easy to do business with.executives’ profiles6 Graham Wood, 53MIM BA(Hons) FIE (Aust) MCIWEM CPEng (Aust) CPEng (UK)Chief Infrastructure Officer (Currently Programme Manager of Project One)Graham Wood is a chartered mechanical engineer with 20 years’ experience in the water industry across four continents. As anexperienced executive and project manager, Graham is currently responsible for Project One, planning for and implementing theintegration of water and wastewater services for the Auckland region. Following integration, Graham will take up his role as ChiefInfrastructure Officer.14
WATERCARE SERVICES LIMITED <strong>ANNUAL</strong> <strong>REPORT</strong> <strong>2010</strong>7 Peter Gaskin, 61Certificate Industrial Relations, Victoria UniversityActing Human Resource ManagerPeter is a human resource contractor and is filling the role of Acting Human Resource Manager. Peter is an HR managementspecialist with over 30 years of experience and an excellent understanding of the water and wastewater services industry havingworked for <strong>Watercare</strong> in the mid 1990s. His responsibilities include human resource planning, health and safety, security,development and employment relations. Peter also led the human resource work stream of Project One coordinating recruitmentof 250 roles associated with integration.Team Results: Continued to focus on health and safety achieving safety targets; maintained high standards of staff trainingand co-operative employment relations. Participated in Project One managing human resource management and recruitmentin preparation for the integrated company’s go live on 1 November <strong>2010</strong>.Outlook: Undertake induction and orientation for new staff. Continue to manage implementation and deployment of HRsystems in the integrated company; continue focus on minimising accidents.8 David Hawkins, 56MPP TTC JPCorporate Relations ManagerA former Auckland Regional Councillor and Mayor of Papakura District Council, David is responsible for government andcommunity relations. During the past year David was seconded by the Auckland Transition Agency to work part time as anadvisor on local government issues.Team Results: Participated in and responded to requests on Auckland Governance legislation. Made submissions to selectcommittees on national legislation including the Infrastructure Bill and the Waikato-Tainui Raupatu Claims (Waikato River)Settlement Bill; made a submission to the Ministry for the Environment on the proposed National Policy Statement – Coastal,the Foreshore and Seabed Legislation review and National Environmental Standards for Ecological Flows and Water Levels.Outlook: Maintain positive relations with local and central government and other stakeholders; contribute to positivecommunity relations.9 Jim Hodges, 62BE MIPENZ CPEngChief EngineerA chartered engineer with 30 years’ experience in the water industry, Jim’s responsibilities include advising the ActingChief Executive on engineering matters, Three Waters Strategic Planning, research, development and innovation, businessimprovement and quality management. Jim is also a member of the Research Council of the Water Environment ResearchFoundation in the United States which guides international research on wastewater and stormwater issues.Team Results: Established Policy Integration Group to look at how best to provide for <strong>Watercare</strong>’s input to new regionalplanning documents. Progressed master planning and research, development and innovation programmes; providedcomprehensive input to central and regional government policy development and resource consent processes; preparedThree Waters Implementation Plan.Outlook: Provide engineering advice to the Chief Executive; continue to promote excellence in all company activities;continue participation in regional and national planning process; advance research, development and innovation.7891010 Clive Nelson, 44MBACorporate Strategy and Communications ManagerA former journalist and newspaper editor with general management experience, Clive’s responsibilities include strategic planning,media relations, publications, education programmes and internal and external communications. Clive has been seconded tothe Auckland Transition Agency and his function is currently being performed by Owen Cook. Clive returns in November <strong>2010</strong>.Team Results: Developed Strategic Framework and Business Plan; Prepared communication material and collateral forProject One related to integration; maintained shareholder and community information channels; and maintained contactwith schools and general public.Outlook: Maintain clear communication channels with stakeholders; contribute to positive community relations around<strong>Watercare</strong>’s operations and projects; further enhance strategic planning processes and communications.1111 David Sellars, 43BCA CARisk and Assurance ManagerDavid is a chartered accountant with experience in banking and audit functions. He has previously been responsible for riskassurance, reporting on the internal control environment and governance of major projects. David has recently been appointedto the new role of Risk and Assurance Manager responsible for Internal Audit, Risk Management and Quality Assurance.Team Results: Completed annual audit plan; reviewed major projects; conducted risk assurance covering <strong>Watercare</strong>’sfinancial, project-related and operational processes.Outlook: Maintain the risk and assurance function, including the risk management framework and systems.governance15
WATERCARE SERVICES LIMITED <strong>ANNUAL</strong> <strong>REPORT</strong> <strong>2010</strong>GovernanceThe board and management of <strong>Watercare</strong> are committed to ensuring thatthe company applies best-practice governance policies and procedures.Background<strong>Watercare</strong> Services Limited (<strong>Watercare</strong>) is a limited liability companyregistered under the Companies Act 1993 which governs the conductof companies in New Zealand. The Local Government Acts of 1974 and2002 define the role and duties of local government organisations inNew Zealand and contain specific provisions for <strong>Watercare</strong>. The companyis defined as a ‘council organisation’ for which the voting rights to appointdirectors are controlled by the shareholding councils. As a consequenceof the legislative framework:ÌÌ <strong>Watercare</strong> must set the bulk prices for water and wastewater servicesin the Greater Auckland area and may arrange such borrowing as itneeds to finance its activities.ÌÌ The company must manage its infrastructure efficiently whilemaintaining prices at minimum levels consistent with maintaining thelong-term integrity of the assets.ÌÌ The company’s shares are held by the six territorial authoritiesidentified under Ownership, below, with the shareholders appointingthe directors through a Shareholders’ Representative Group (SRG).ÌÌ Elected members and employees of local authorities are prohibitedfrom being <strong>Watercare</strong> directors.ÌÌ The company is prohibited from paying a dividend to its owners or anyshareholder; however, a surplus may be returned to customers by wayof rebate, discount or price adjustment.ÌÌ The company’s financial statements must be audited by the Auditor-General, or by an auditor acting on her behalf.Ownership<strong>Watercare</strong>’s shareholding councils are: Auckland City Council (41.6 per cent);Manukau City Council (25.1 per cent); Waitakere City Council (16.7 per cent);North Shore City Council (11.5 per cent); Papakura District Council (3.7per cent); and Rodney District Council (1.4 per cent). Each of the ownersappoints two representatives to the SRG. A shareholders’ agreement sets outthe role of the SRG and the relationships between shareholders.From 1 November <strong>2010</strong>, the existing shareholders will no longer exist and<strong>Watercare</strong> will become a wholly owned subsidiary of the Auckland Council,the new unitary authority replacing the regional and local councils.New Governance LegislationFrom 1 November <strong>2010</strong>, <strong>Watercare</strong> will become the regional provider of waterand wastewater services in Auckland. The legislative framework enabling andgoverning <strong>Watercare</strong>'s new operations is largely found in four Acts:1. Local Government (Tamaki Makaurau Reorganisation) Act 20092. Local Government (Auckland Council) Act 20093. Local Government (Auckland Council) Amendment Act <strong>2010</strong>4. Local Government (Auckland Transitional Provisions) Act <strong>2010</strong>Under the new legislation, the company will continue to operate as acouncil organisation until 2015 and will continue to operate under similarlegislative requirements to those already in place.Board of DirectorsResponsibilitiesThe board is appointed by the shareholders to govern <strong>Watercare</strong> inaccordance with the statutory obligations and with the statement ofcorporate intent (SCI) agreed annually with the shareholders through theSRG. The board is ultimately responsible for all decision-making withinthe company. Operational responsibility is delegated to the chief executiveby way of a formal delegated authority framework. The performance ofthe chief executive is reviewed annually by the board. The SCI lays out theactivities to be undertaken by <strong>Watercare</strong>, sets specific economic, socialand environmental objectives for the company and establishes performancetargets which will be used to measure the company’s performance. The SCIis published on <strong>Watercare</strong>’s website www.watercare.co.nzCorporate Governance CharterThis charter defines the duties and obligations of the board and boardmembers in areas such as fiduciary duty, duty of care, diligence, legal andstatutory duties and conflicts of interest. It incorporates the principles of theNew Zealand Institute of Directors’ Code of Proper Practice for Directors,relevant sections of the New Zealand Exchange Limited (NZX) CorporateGovernance Best Practice Code and the Securities Commission’s nineprinciples of corporate governance.Board Membership and CompositionThe board currently comprises seven independent, non-executive directors.Their profiles and disclosures of interests are published on page 12.Directors, including the chairman, are appointed by shareholders throughthe SRG. Board appointments are for a term of three years in accordancewith the company’s constitution. Retiring directors are eligible forreappointment at the discretion of the shareholders.Board PerformanceThe board undertakes its own internal review of performance annually, bothin relation to the board as a whole and the contribution of individual boardmembers. Due to the impending industry integration and changes to theBoard membership, no review was conducted in <strong>2010</strong>.Board RemunerationThe board remuneration is determined by the SRG after taking external advice.Indemnity and Insurance<strong>Watercare</strong> has executed a deed of indemnity with each director whichindemnifies the director in accordance with the company’s constitutionand grants certain rights in respect of access to documents and themaintenance of liability insurance cover.Board Meetings<strong>Watercare</strong>’s board has 11 scheduled meetings per year. In <strong>2010</strong> the boardmet on a twice monthly basis in order to manage the information andgovernance workload associated with the integration of water and wastewaterservices for the Auckland region. A special meeting was also held in May <strong>2010</strong>in preparation for an amendment to the Trade Wastes Bylaw 1991.Audit and Risk CommitteeThe board is responsible for appointing the members of the Audit andRisk Committee. The committee’s role is to assist the board to fulfil itsresponsibilities in the areas of financial reporting and to provide assuranceregarding compliance with internal controls, policies and procedures.Its responsibilities are established in the Audit and Risk Committee Charterwhich is reviewed annually. The committee has no delegated authority.In carrying out its duties, the committee meets regularly with the externaland internal auditors (both with and without management present) and themanagement of the company. At least one member must have accountingor financial management expertise. The chairman of the board may not bechairman of the Audit and Risk Committee. The current members of theAudit and Risk Committee are: Jeff Todd (Chairman), Graeme Hawkins andRoss Keenan. All <strong>Watercare</strong> directors receive the papers of the Audit and RiskCommittee in advance and all are invited to attend committee meetings.16
WATERCARE SERVICES LIMITED <strong>ANNUAL</strong> <strong>REPORT</strong> <strong>2010</strong>Risk Management<strong>Watercare</strong>’s framework for risk identification, measurement and reportingis well developed, and meets the requirements of the Australian andNew Zealand Standard 4360. There are regular external reviews of<strong>Watercare</strong>’s framework to ensure the company meets and exceeds goodpractice measures in risk management. As part of the risk managementframework, the company has established a Risk Steering Committee whichmeets six times per year to monitor emerging risk and risk-mitigatingactions and strategies. The committee comprises the chief executive,senior management, the internal auditor and the risk manager. Risks thathave serious consequences are in turn directly monitored by the board.External AuditorsThe Auditor-General is the auditor of the company’s financial statements.The Auditor-General has appointed Jamie Schmidt from Deloitte to undertakethe external audit work on behalf of her office, in accordance with theAuditor-General’s Audit Standards, which incorporate New Zealand AuditingStandards. Deloitte has no relationship with the company outside of the auditand related assurance activities it undertakes under its mandate from theAuditor-General. This satisfies the independence requirements of the Auditor-General and the Institute of Chartered Accountants of New Zealand.Transparency in Reporting<strong>Watercare</strong> is committed to transparent reporting. Recognising this,<strong>Watercare</strong> publishes:ÌÌ An annual Statement of Corporate IntentÌÌ An annual Funding PlanÌÌ An annual Asset Management PlanÌÌ An annual report that records performance against guidelines developedunder the United Nations’ Global Reporting G3 Initiative (see page 109)ÌÌ Special project newsletters for interested parties.Additionally, the company’s website www.watercare.co.nz gives an overviewof <strong>Watercare</strong> and provides a live update of current water storage levelsand other data as well as information on education and recreation, majorprojects and publications. Laboratory Services and Trade waste also havededicated sections of the website. Information is presented on workingfor <strong>Watercare</strong> and electronic tenders can be submitted via the website.<strong>Watercare</strong> closely monitors the quality and format of the information thatit reports. Feedback on the annual report from interested parties andprofessional reviewers is incorporated into future reports. Feedback formscan be downloaded from www.watercare.co.nzSetting Standards of Conduct for Staff<strong>Watercare</strong> demands the highest standards of behaviour from its staff. Amongthe company’s policies governing employee behaviour, a specific ethics policyaddresses employees’ responsibilities with regard to contractual relationshipswith suppliers of goods and services to <strong>Watercare</strong>, and conflicts of interest.All contracts managed by staff must be in writing. The policies set out thedelegated authority within the company. All policies governing the conductof staff are published on the company’s intranet. <strong>Watercare</strong>’s projects aresubject to internal probity reviews, and external probity auditors are appointedto provide additional assurance on major projects.Responsiveness to StakeholdersThe Shareholders’ Representative Group (SRG)<strong>Watercare</strong> provides a written quarterly report on its operations to the SRG.Additionally the board and management meet the SRG two times a yearto brief them and supply any further information requested. The Chairmanand Transition Chief Executive also attend regular SRG meetings.Other StakeholdersThe company consults extensively with its shareholders, customers,environmental regulators, special interest groups, advisory groups and thecommunity. The company engages with customers in regular managementmeetings, quarterly operational meetings, regular project meetings andworkshops to set priorities for the development and maintenance of assetsin the Asset Management Plan and to consult on the price path andFunding Plan processes.<strong>Watercare</strong> consults closely with all its communities and aims to build longtermrelationships. Project-specific community liaison groups are convenedas deemed necessary and communication occurs through a wide range ofstakeholder contact mechanisms.Advisory Groups<strong>Watercare</strong> has three standing consultative and advisory committees thatcomment on company plans and projects. They are the EnvironmentalAdvisory Group, the Maori Advisory Group and the Consumer AdvisoryGroup. The Environmental Advisory Group comprises experts who adviseon how the company’s activities impact on the environment. The MaoriAdvisory Group advises <strong>Watercare</strong> on how its plans and operations impacton Maori and on the relationship between the natural environment andMaori. The group also provides advice that enhances the company’srelationship with Maori. The Consumer Advisory Group was establishedin 2009 in response to integration and <strong>Watercare</strong>’s new relationship withcustomers across the region. The group provides independent advice on<strong>Watercare</strong>’s commitment to treat all consumers in a fair and equitablemanner. The reports of the Maori Advisory Group, the EnvironmentalAdvisory Group and the Consumer Advisory Group for 2009/10 can befound on pages 19, 20 and 21.Regulators<strong>Watercare</strong> is subject to regulation in planning, health and environmentalmatters. The principal regulators include: the Auckland Regional Council,Environment Waikato, the city and district councils and the Ministry of Health.The company also engages with these bodies by providing input on the impactsof existing and proposed policy and regulation on <strong>Watercare</strong>’s activities.Regular Independent Reviews<strong>Watercare</strong> validates its planning, operations and reporting with independentconsultants on a regular basis. In addition, the SRG commissions regularexternal reviews of various aspects of company performance. This year,as a result of the extensive work required for integration of the water andwastewater industry, less emphasis has been placed on process reviews.However, <strong>Watercare</strong> has continued to follow best-practice processes whichinclude feedback and continuous improvements from previous reviews.WhistleblowingThe company has a specific policy to receive and deal with informationabout any serious wrongdoing within the company, as required by theProtected Disclosures Act 2000. <strong>Watercare</strong>’s policy prescribes how<strong>Watercare</strong> staff and others would report matters of serious wrongdoing, andprovides contacts to whom such reporting can be made. The policy definesserious wrongdoing and applies to present and past employees, and to anyindividual either seconded to, or working on a contract basis for, <strong>Watercare</strong>.17
WATERCARE SERVICES LIMITED <strong>ANNUAL</strong> <strong>REPORT</strong> <strong>2010</strong>governance18Tukoroirangi Morgan, Chairman Waikato-Tainui Te Arataura and Graeme Hawkins, Chairman of <strong>Watercare</strong>, sign a Memorandumof Relationship that recognises both parties' desire to work together to build a strong, balanced and enduring relationship.
WATERCARE SERVICES LIMITED <strong>ANNUAL</strong> <strong>REPORT</strong> <strong>2010</strong>Advisory Group ReportsMaori Advisory Group1 July <strong>2010</strong>Ko te awa ko au, I am the riverKo au ko te awa, the river is meKia oraI want to share with you the significance of the proverb above and how it relates to the Waikato Tainui Raupatu Claims (WaikatoRiver) Settlement Act <strong>2010</strong> and <strong>Watercare</strong>. The 50/50 governance arrangement with the Crown is an acknowledgement of arelationship that exists between Maori and their river. “I am the river, the river is me” echoes a peoples’ lifelong commitment topreserving its well-being for the benefit of the generations to come.A traditional relationship and practice now firmly back in the hands of the Waikato people in the form of the new Waikato River Authority.This couldn’t have happened at a better time when water demands and costs are high on everyone’s agenda. Having Waikato Maori atthe decision making table gives me a great deal of confidence that water security, supply and quality are in good hands.How does this affect Auckland? Well, for close to a hundred years the Waitakere and Hunua water supply dams have providedAuckland with that all important ingredient of life, potable water. Since 2002, supply has been supplemented by abstraction fromthe Waikato River. While <strong>Watercare</strong>’s current water take consent is sufficient it will not be enough to quench the thirst of a growingsuper city in the future.On 1 November <strong>2010</strong>, when <strong>Watercare</strong> becomes the single largest water and wastewater utility in the country, you will be pleasedto know that Auckland’s future water needs are also in good hands. This is thanks to the signing a Statement of Understandingbetween <strong>Watercare</strong> and the Tainui Maori Trust Board, a member of the new authority, in October 1998. As for the proverb itmarries well with <strong>Watercare</strong>’s commitment to help enhance the well-being of the Waikato River.So to the Waikato and its people, I acknowledge you not once, not twice but thrice.Kia oraWilliam KapeaChairmanMaori Advisory GroupMembersWilliam KapeaGary ThompsonKowhai OlsenPamera WarnerPaul BrownNorma ArlidgeDennis NgatakiTim ManukauBrownie RauwheroCarmen KirkwoodAffiliationNgati WhatuaNgati PaoaTainuiNgati WhatuaTainuiNgati WhatuaTainuiTainuiTainuiTainuiadvisory group reports19
WATERCARE SERVICES LIMITED <strong>ANNUAL</strong> <strong>REPORT</strong> <strong>2010</strong>Advisory Group ReportsEnvironmental Advisory Group1 July <strong>2010</strong>The Environmental Advisory Group has continued to engage in thoughtful discussions with <strong>Watercare</strong> on the environmental effectsof its decisions and to give informed input into its plans, projects and operations.Each of us is well placed to challenge <strong>Watercare</strong>’s thinking, offering insights from our area of individual expertise. Our experienceas advocates in community organisations and in the development of public policy gives us keen insights into areas of public concern.Over the last 12 months, we have been actively engaged in discussions with <strong>Watercare</strong> about how the environmental implicationsof the following can best be addressed:ÌÌ The integration of water and wastewater services in the region as a result of the local government reforms.ÌÌ Plans for the future development of <strong>Watercare</strong>’s wastewater treatment plants and network, including the proposed constructionof a central wastewater interceptor, the proposed rehabilitation of Puketutu Island with biosolids, plans to construct three newpump stations in west Auckland, and plans to review the condition of the rural plants <strong>Watercare</strong> will be responsible for after1 November <strong>2010</strong>.ÌÌ The Three Waters project, integrating the management of water supply, wastewater and stormwater.ÌÌ The role of small-scale wastewater treatment systems.ÌÌ <strong>Watercare</strong>’s response to proposed policy and plan variations that have the potential to affect extraction from the Waikato Riverfor municipal water supply.ÌÌ <strong>Watercare</strong>’s response to national freshwater and coastal policies that have the potential to impact its wastewater operations.ÌÌ Amendments to the Trade Wastes Bylaw.We have also stressed the need to future proof current positive environmental outcomes through the impending regionalgovernance changes.We look forward to another year of working with <strong>Watercare</strong> and to ensuring a focus on environmental sustainability is retainedin the incoming structure. Key challenges we see in the near future include:ÌÌ The need to ensure the management of stormwater is handled in an integrated manner in light of its separation fromwastewater and water supply in the new regional governance structure. While the group acknowledges that <strong>Watercare</strong> inheritsno direct responsibility for stormwater, there is a need to develop stretch targets and effective solutions to its (at times)major environmental impacts. <strong>Watercare</strong> can contribute to this via integration of management across the interface betweenstormwater and those elements of the three waters under its control.ÌÌ Opportunities for reduction of water consumption and realisation of appropriate re-use initiatives.MembersFocusadvisory group reportsPaul WalbranChairmanEnvironmental Advisory GroupPaul Walbran (Chairman)Ken CattAnne FennCarol McSweeneyDr Peter MaddisonJudy BischoffBob TaitWater quality, harbour health and heritageThe water cycleEnvironmental policy and implementationAir quality, ecosystems and botanyEntomology, flora and faunaWater and land use, energyBiosolids20
WATERCARE SERVICES LIMITED <strong>ANNUAL</strong> <strong>REPORT</strong> <strong>2010</strong>Advisory Group ReportsConsumer Advisory Group1 July <strong>2010</strong>The Consumer Advisory Group was established by <strong>Watercare</strong> in 2009 and aims to provide ongoing independent advice to thecompany on its commitment to treat all consumers in a fair and equitable manner.Our group consists of six members who have experience in issues covering social, health and family services, public housing,migration and cultural diversity as well as an understanding of tikanga Maori and Pacific Island affairs. All members are wellplaced to provide <strong>Watercare</strong> with independent advice on the impact of the company’s activities on the consumer.We first met on 24 September 2009 and have continued to meet on a quarterly basis since then.A major focus of our meetings has been the review of new <strong>Watercare</strong> policies and procedures that impact the customer.These include documents such as the customer contract, customer communications plan, the hardship policy, emergency watersupply, leak remissions and the complaints process.As a group, we acknowledge the comprehensive amount of work <strong>Watercare</strong> has undertaken to understand the issues and thewillingness to share information listen and consider feedback.We have welcomed the opportunity to be involved and have offered different perspectives for <strong>Watercare</strong> to consider. In future,we will continue to review relevant policies and procedures, and provide feedback and advice on implementation issues as required.We look forward to a productive ongoing relationship with <strong>Watercare</strong>, helping to ensure the needs of diverse communities areunderstood and considered in the provision of essential water and wastewater services.Sir Paul ReevesChairmanConsumer Advisory GroupMembersSir Paul Reeves (Chairman)Tunumafono Ava FaamoeIan LeaderJohn MurrayPeta Si’ulepaNicole WalkerChancellor, Auckland University of Technology (AUT)Community Worker, First 5 EnterpriseCommunity Relations Manager, AUTSuperintendent/Executive Director, LifewiseStrategic Partnerships Advisor, Waitakere City CouncilBarrister, specialising in the Family Courtadvisory group reports21
WATERCARE SERVICES LIMITED <strong>ANNUAL</strong> <strong>REPORT</strong> <strong>2010</strong>22
WATERCARE SERVICES LIMITED <strong>ANNUAL</strong> <strong>REPORT</strong> <strong>2010</strong>Policy 1Environmental CareTo Minimise the Adverse Impact of the Company’s Operations on the Environment Data Technician Sarah Muir reviews rain level data at Upper Mangatawhiri Dam in the Hunua Ranges.23
WATERCARE SERVICES LIMITED <strong>ANNUAL</strong> <strong>REPORT</strong> <strong>2010</strong>Policy 1Environmental Care<strong>Watercare</strong>’s commitment to protecting the environment is embedded in its business practices and operations. The company is focusedon reducing its carbon footprint by increasingly using water and wastewater to generate electricity through hydroelectric and biogascogeneration facilities. Initiatives in power generation are coupled with practical steps to reduce energy consumption, encourage recyclingand reduce paper use.Policy 1Overallperformanceout of 10<strong>Watercare</strong> at work:Milestone passes in a gush of waterCase StudyOBJECTIVE 15566706070809Minimise emissions and reducecarbon footprintOBJECTIVE 2106.5066.5077087.509Promote cleaner production toindustry and minimise waste810A view from the top of Upper NihotupuDam looking down to where thecompensation valve was opened forthe first time in September, releasingthe flow of water.OBJECTIVE 37.5068.58.5 8.5Minimise the impact of treated biosolidsand effluentOBJECTIVE 48068Promote the preservation of species andprotection of places of significant heritagevalue impacted by operationsOBJECTIVE 56.5066.5Use energy efficiently and, where practical,recover energy from operational activitiesOBJECTIVE 68.506070707707088.50896.5 7088 8.5088.509 109.509 106.509 10909 10Reduce and control odours,overflows, noise and other nuisancesA gush of water signalled the start of a new era for Nihotupu Stream in the Waitakere Ranges.For over 70 years, the stream had been affected by the Upper Nihotupu Dam which had blockedits major tributary and reduced its water level. Now, thanks to the installation of a compensationvalve, flows are making it past the dam.Headworks Engineer Suzanne Naylor opened the new valve for the first time on 30 September2009, releasing water into the plunge pool at the base of the dam’s spillway which flows into thestream below. She says the compensation flows are significant for the local community.“When new resource consents were granted in 2005, one thing the public and council werereally concerned about was making sure we released flow continuously from the dam to mimicwhat would happen if it wasn’t there,” says Suzanne.“This valve has the ability to release 30, 60 or 90 litres of water a second, depending on thecombined water levels in all of <strong>Watercare</strong>’s dams – if they are full, more will be released becauseit assumes greater rainfall and higher natural water levels.”<strong>Watercare</strong>’s Project Engineer Neil Jacka managed the upgrade. He says the work also includedthe installation of a free discharge valve to enable <strong>Watercare</strong> to drain the lake in an emergency.This valve can be used to flush water downstream during the summer months as well, as Neilexplains: “In summer, the low stream flows and increased sunlight can cause algae growthwhich reduces the available oxygen in the water, affecting the fish. With the free dischargevalves we can mimic the summer storms that naturally flush away the algae, and thereforeimprove aquatic life.”The work was undertaken as part of the Western Dams Upgrade Project. Compensation and freedischarge valves have also been installed at Lower Huia, Lower Nihotupu and Waitakere damsand work has commenced at Upper Huia Dam.24
WATERCARE SERVICES LIMITED <strong>ANNUAL</strong> <strong>REPORT</strong> <strong>2010</strong>Atmospheric Emissions – Carbon Reduction<strong>Watercare</strong> continued its work to reduce atmospheric emissions of carbon.The company has now achieved an 86 per cent reduction in carbon dioxide (CO 2)equivalent emissions since 1990, largely as a result of improved wastewatertreatment processes. The single largest contributing factor since 1990 has beenthe decommissioning of the oxidation ponds and sludge lagoons at the MangereWastewater Treatment Plant. Other company initiatives such as collecting methanefor electricity generation and optimising the efficiency of hydro generation at waterstorage dams has also helped to reduce reliance on the use of external energy.The slight increase in CO 2production this year was due to the greater quantity ofwastewater treated as a result of a growing population. Furthermore, operationalrequirements of the plant resulted in a need for increased volumes of natural gas.<strong>Watercare</strong> has continued to review its approach to measuring greenhouse gasemissions to ensure consistency with best practice as methods for carbonaccounting develop.Management of Carbon Footprint<strong>Watercare</strong> is continuing to measure its performance against 10 initiatives of practicalvalue to minimise the company’s carbon footprint. The company is seeking ways toreduce its carbon footprint and is working with customers and suppliers in this area.Some projects identified as part of the future capital works programme beyond <strong>2010</strong>will also provide opportunities to lower greenhouse gas emissions and in the processreduce our carbon footprint. Re-roofing of the digesters at the Mangere WastewaterTreatment Plant and the proposed development of a biogas storage unit will help toreduce gas emissions and the unnecessary flaring of gas. These initiatives will helpto increase the volume of biogas captured and the amount of electricity generatedat the plant.A graph of <strong>Watercare</strong>’s greenhouse gas emissions from 1990 to today, withprojections to 2050 and the company’s long-term target, is shown below.Biogas UtilisationBiogas is a by-product of the wastewater treatment process and comprisesapproximately 60 per cent methane. If it escapes into the atmosphere,it is 21 times more damaging than CO 2.At the wastewater treatment plant, biogas is captured and used to run four gasengines that this year met 56 per cent of the plant’s energy needs. <strong>Watercare</strong>is looking to increase the amount of energy produced using biogas. This will beachieved through the construction of biogas holders to reduce the quantity of gasthat flares, and by re-roofing the digesters to reduce gas emissions. These initiativesare included in future capital works programmes beyond <strong>2010</strong>.<strong>Watercare</strong>’s greenhouse gas emissions 1990-<strong>2010</strong>, with projections and targets to 2050Greenhouse gas emissions (tonnes CO 2e)120,000100,00080,00060,00040,00020,00001990Decommissioningof oxidation pondsKyoto target5% reduction 2008-2012Further capitalworks to reduceemissionsScope 1: Fossil fuels, nitrogen compounds and methane releasesScope 2: Energy imports and exports<strong>Watercare</strong>1990 levelStep changein energy useto meet futuregrowth asidentified inAMPAspirational Global Target(50% reduction from 1990 levels by 2050)<strong>Watercare</strong> 2009 Level (22% of 1990 levels)<strong>Watercare</strong> 2050 Level (10% of 1990 levels)2000 <strong>2010</strong> 2020 2030 2040 2050YearWeblinksFigures:Sustainability accounting analysis Fig. 10<strong>Watercare</strong>’s greenhouse gas emissions Fig. 11Initiatives to reduce greenhousegas emissions Fig. 12Significant gaseous emissions by weight Fig. 13<strong>Watercare</strong>’s ecological footprint Fig. 14Sources of emissions Fig. 15Objective 1 Minimise Emissions and Reduce Carbon FootprintA. Atmospheric emissions – carbon reduction (nwoodley@water.co.nz)% CO 2equivalent reduction from 1990 levels 0.5 10% 20% 30% 40% 50% 60% 70% 80% 90% 100%B. Carbon footprint management (nwoodley@water.co.nz) 0.5 0.5 0.5 0.5 0.5 0.5DevelopobjectiveIdentifytargetsInfluencesuppliersInfluencecustomersVerify carbonaccountingIdentify studiesand opportunitiesImplementstudiesImplementopportunitiesStaff educationand initiativesExternalrecognitionC. Biogas utilisation (stan@water.co.nz)% of WTP energy supplied by methane capture 0.5 10% 20% 30% 40% 50% 60% 70% 80% 90% 100%TargetTargetTargetG3EN16-20<strong>2010</strong>8.5/102006 2007 2008 20097 8.5 8.5 8.5<strong>2010</strong>7/102006 2007 2008 20091.5 2 5 7<strong>2010</strong>5.5/102006 2007 2008 20095.5 5.5 5.5 6Impact on key areas:SocialEconomicEnvironmentalMinimise emissions and reducecarbon footprintOverall performance scores out of 102006 2007 2008 20095 5 6 6<strong>2010</strong>725
WATERCARE SERVICES LIMITED <strong>ANNUAL</strong> <strong>REPORT</strong> <strong>2010</strong>Trade Waste Control<strong>Watercare</strong> works with approximately 580 customers in administering the TradeWaste Bylaw. The company sets out to:ÌÌ Preserve safe working conditions in the sewer network and the MangereWastewater Treatment PlantÌÌ Protect the integrity of the wastewater treatment processÌÌ Ensure the longevity of the sewer network and the reticulation assetsÌÌ Enhance the potential for the reuse of treated biosolidsÌÌ Assist in ensuring that wastewater treatment plant discharges meet consentrequirements.As the regulator, <strong>Watercare</strong> is responsible for enforcing trade waste compliance.The number of customers complying with consent conditions in 2009/10 hasimproved. Trade waste staff have been continuing to work closely with industry toeducate customers on their waste discharges, improvement of treatment processes,and reduction of waste volumes.<strong>Watercare</strong> is seeking an amendment to the Trade Wastes Bylaw in order to achieveequitable charging for trade waste services following the integration of wastewaterservices in Auckland on 1 November <strong>2010</strong>.RecyclingThe quantity of recyclable waste going to landfill increased slightly this year.It was identified that the integration project may divert staff attention resultingin more non-<strong>Watercare</strong> staff in the workplace and less recycling. In response,waste minimisation signage and bin labelling was increased and standardised.This year around 70 per cent of the waste sent to landfill is incapable of beingrecycled, consistent with last year, according to independent analysis by Waste Not.WeblinksStoriesZero waste expandsFigures:Trade waste customers Fig. 16Trade waste sampling programme Fig. 17Key trade waste substances Fig. 18Materials and chemicals Fig. 19Biosolids metal levels Fig. 20Wastewater treatment plant effluent discharge Fig. 21Treated wastewater standards Fig. 22Solids disposal Fig. 23Weight of hazardous substances in waste Fig. 24Trade Waste Compliance Advisor Hamish Jones gathers a sample at ChemWaste in Onehunga,Auckland; pictured with ChemWaste’s Technical Operations Manager Colin Jowett.This leaves 30 per cent of waste which is still suitable for composting or reuse.Planning is underway to promote waste minimisation measures to new staff joining<strong>Watercare</strong>. The waste minimisation initiative is led by employees who volunteer toparticipate in the company’s Zero Waste programme.Paper Use<strong>Watercare</strong> paper use per employee remained unchanged, with 12.2 reams of paperconsumed per office-based employee this year, despite the increased staff andworkload involved with integration of the water industry.Paper use is measured against the Ministry for the Environment’s benchmarkof 11 reams of paper per office-based employee per year.Objective 2 Promote Cleaner Production to Industry and Minimise WasteA. Trade waste control (progers@water.co.nz)% customer compliance with consent conditions 91% 92% 93% 94% 95% 96% 97% 98% 99% 100%B. Recycling (rgallagher@water.co.nz)% waste going to landfill that could be recycled 90% 80% 70% 60% 50% 40% 30% 20% 10% 0%C. Paper use (rgallagher@water.co.nz)Number of paper reams used per office-based employee 28 26 24 22 20 18 16 14 12 10TargetTargetTarget<strong>2010</strong>7/102006 2007 2008 20097 5 5 6<strong>2010</strong>7/102006 2007 2008 20095.5 6.5 7.5 7.5<strong>2010</strong>9/10MINISTRY FOR THEENVIRONMENT BENCHMARK2006 2007 2008 20096.5 7.5 8.5 9Impact on key areas:SocialEconomicEnvironmentalPromote cleaner production to industryand minimise wasteOverall performance scores out of 102006 2007 2008 20096.5 6.5 7 7.5<strong>2010</strong>826
WATERCARE SERVICES LIMITED <strong>ANNUAL</strong> <strong>REPORT</strong> <strong>2010</strong>Species Preservation InitiativesCompensation valves have been installed at most of the <strong>Watercare</strong> dams whichenable the release of continuous flows downstream, while free discharge valvesallow flushing flows to occasionally be released to simulate floods and help removeany algae build-up downstream. The valves also increase <strong>Watercare</strong>’s ability tocontrol lake levels, including the capability to control the release of water in theevent of an emergency such as a major earthquake.Native fisheries management works continued within various <strong>Watercare</strong>catchments to ensure that necessary migratory paths of native fish species arenot interrupted by the dams. This involves capturing juvenile galaxiid species(whitebait) and young migrating eels (elvers) from the downstream river systemsand transferring them upstream. Adult migrating eels are also caught within thedams and transferred to suitable locations downstream to carry on to the sea inorder to complete their life cycles.WeblinksStories:Green conscious upgrade scoops awardA million trees and countingFirst eels released in Huia DamGuardians of the westEnvironmental awards roll inFigures:Protected areas of high ecological value Fig. 25Significant biodiversity impacts Fig. 26Environmental Planner Andrew Kantorhelps a pupil from Clevedon Schoolwith planting being undertaken as partof the Trees For Survival programme.<strong>Watercare</strong> is an ongoing sponsor of theprogramme which has been providinghands-on environmental education toschools, promoting the growing of nativetrees and shrubs, since 1991.Habitat Improvement Schemes<strong>Watercare</strong> continues to support the Waikato RiverCare initiative and tree-plantingactivities for local schools through its sponsorship of the Trees For Survivalprogramme. With the Trees For Survival programme, schools within the Wairoa Rivercatchment area are supplied with resources to plant trees and to educate theirstudents on the relationship between the forest and the catchment environment.Growing units have been established at Hunua, Paparimu, Ararimu, Ardmore andClevedon schools. <strong>Watercare</strong> also supports Waikato RiverCare to achieve the society’sgoal of planting 240 kilometers of the Waikato River’s banks in native plant species.The company undertook riparian planting around its water supply sources.In the vicinity of the Mangere Wastewater Treatment Plant, <strong>Watercare</strong> maintains13 kilometres of coastal walkway and associated planting. This area includessignificant bird roost areas where more than 30 different species have been observed.Environmental Management<strong>Watercare</strong>’s specialist in-house environmental team is involved in the developmentof local, regional and national environmental policies. The company, as part of theWaikato River Municipal Users Group, is responding to a variation to EnvironmentWaikato’s regional plan. The group is involved in seeking to protect priorityallocation of Waikato River water for domestic and municipal water supply.The in-house team manages resource consent processes on projects and advisescolleagues on policies that affect the business to ensure environmental issues arean integral and consistent part of the decision-making process. Consents for the newMt Wellington Watermain, Redoubt Road reservoirs, the Waitakere Dam raw watermainreplacement, the extension of the South Western Interceptor and for methoprene usefor the control of midges at the Mangere Wastewater Treatment Plant were obtained thisyear. Consent applications for the proposed Hunua No. 4 Trunk Watermain were lodgedthis year. Other ongoing projects include the proposed rehabilitation of a former quarryon Puketutu Island with biosolids, the proposed Central Interceptor and the regionalwastewater network consents. With integration on 1 November <strong>2010</strong>, other regionalprojects that require consenting will also be dealt with by the team in the coming year.The team has continued to develop a staff training programme and has been workingwith other business units to increase awareness of resource management issues.Objective 4 Promote the Preservation of Species and Protection of Places of Significant Heritage Value Impacted by OperationsA. Species preservation initiatives (snaylor@water.co.nz) Bird roostmanagementplanBird populationsmonitoredAdequate birdroost capacityMacroinvertebratemonitoringTrout managementplanFlushing flowrelease – southerndamsFish passagesover weirs –southern damsFish trap andhaul – southerndamsFish trap and haul– western damsFlushing flowrelease – westerndamsB. Habitat improvement schemes (snaylor@water.co.nz) 0.5 0.5Rural: TreesFor SurvivalsponsorshipFreshwater:Downstream waterquality monitoring– southern damsFreshwater:Residual flowsmaintained –southern damsFreshwater:Downstream waterquality monitoring– western damsIncrease inmarine diversityCoastal: ProjectscompleteFreshwater:Riparian plantingprogrammeat damsFreshwater:Residual flowsimplemented –western damsUrban:Restorationprojects planned(Meola Creek)Urban: Restorationprojects complete(Hobson Bay)C. Environmental management (ashanks@water.co.nz) <strong>Watercare</strong> hassought EAG's inputon potential impactsof operations<strong>Watercare</strong> aims toavoid/minimiseenvironmentalimpactsNew initiativesemployed tominimise environmentalimpact<strong>Watercare</strong>'sdecision-makingreflects consultationwith EAG<strong>Watercare</strong>'saccreditation ofenvironmentalmanagement systemDemonstrateproactiveapproach to theenvironmentEnvironmental issuesmade an integral andconsistent part of alldecision-makingStrive for continuousimprovementin environmentalmanagementShow leadershipin managementof environmentalreportingStaff trained/exposed toenvironmentalissuesTargetTargetTargetG3EN14G3EN14G3EN14<strong>2010</strong>10/102006 2007 2008 20096.5 7.5 8 9<strong>2010</strong>9/102006 2007 2008 20097.5 7.5 8 8.5<strong>2010</strong>10/102006 2007 2008 20099.5 9.5 9.5 10Impact on key areas:SocialEconomicEnvironmentalPromote the preservation of species and protection of places of significant heritagevalue impacted by operationsOverall performance scores out of 102006 2007 2008 20098 8 8.5 9<strong>2010</strong>9.528
WATERCARE SERVICES LIMITED <strong>ANNUAL</strong> <strong>REPORT</strong> <strong>2010</strong>Water Energy Efficiency<strong>Watercare</strong> aims to use energy efficiently in the treatment and delivery of water.This year, 27 gigawatt-hours were used in the production and delivery of around139 billion litres of water. The index used to monitor water energy efficiency is thekilowatt-hours of energy consumed per cubic metre of water delivered. In 2009/10this increased from 0.18 to 0.20 kilowatt-hours per cubic metre of water. Theincrease was due to very dry weather during the first four months of <strong>2010</strong> whichforced <strong>Watercare</strong> to increase production and pumping from the Waikato WaterTreatment Plant at Tuakau. Water from this source is more expensive to treat andtransport than from the gravity-fed dams. Around 3.7 per cent of all energy usedby the company was produced by five hydroelectric generators at the dams.Wastewater Energy EfficiencyEnergy consumption for the collection and treatment of wastewater was 0.75kilowatt-hours per cubic metre of wastewater treated, which was on target.Over the year, some 84 gigawatt-hours were used to collect and treat 111 billionlitres of wastewater. A total of 56 per cent of the energy required by the MangereWastewater Treatment Plant was generated by the cogeneration biogas facility.Energy Management ProgrammeThe Energy Focus programme oversees all energy management and improvementinitiatives throughout <strong>Watercare</strong>. In 2009/10, this programme included the completionof the optimisation of the hydroelectric generators at Cosseys and Wairoa dams toimprove their availability. <strong>Watercare</strong>’s five generators are projected to produce 7,000megawatt-hours of electricity annually – which is equivalent to the amount of energyrequired to power approximately 800 homes. The Energy Focus team continuesto investigate options and technologies for improving the internal generation andutilisation of electricity. Work has commenced this year on the development of areal-time model to evaluate the most cost-effective option for providing energy to theMangere Wastewater Treatment Plant, taking into account the cost of electricity andavailability of biogas at any time of day and season of the year.This year, generating energy at <strong>Watercare</strong> sites using wind sources was explored.After the initial review of 10 sites was carried out last year, two were shortlisted forfurther modelling and economic assessment. While it was determined that it is noteconomic to harness energy from wind with current electricity pricing, the priceenvelopes at which investment becomes economically viable is now understood.Initial reviews into the viability of participating in the national initiative to implementload interruptibility have commenced. This scheme identifies loads that can beturned off to support Transpower in maintaining national grid stability. This workis ongoing and provides potential opportunity for financial benefit as well ascontributing to national security of supply.The Waikato Water Treatment Plant in Tuakau, south of Auckland. The plant ran at full capacityduring the dry summer and autumn months, producing 75 million litres of water a day.WeblinksFigures:Electricity used summary Fig. 27Travel and transport Fig. 28Direct energy consumption by primary source Fig. 29Indirect energy consumption by primary source Fig. 30Energy efficiency Fig. 31Energy summary Fig. 32Energy savings Fig. 33Objective 5 Use Energy Efficiently and, where Practical, Recover Energy from Operational ActivitiesA. Water energy efficiency (scrisford@water.co.nz)kWh electricity consumed per cubic metre water delivered 0.50 0.45 0.40 0.35 0.30 0.25 0.20 0.15 0.10 0.05B. Wastewater energy efficiency (scrisford@water.co.nz)kWh electricity consumed per cubic metre wastewater treated 0.5 1.9 1.7 1.5 1.3 1.1 0.9 0.7 0.5 0.3 0.1C. Energy management programme (scrisford@water.co.nz) 0.5 0.5 0.5 0.5 0.5 0.5 0.5Energymanagementsystem policiesand targetEnergy savingsopportunitiesregisterImpact on key areas:SocialEconomicEnvironmentalExternal supply is100% renewableInternal supply50% of ownconsumptionStaff trainingimplementedEnergymanagementsystem expanded(software)Energy efficiencycriteria standardsBenchmarkfor energyconsumptionReal-time energyoptimisationimplementedEnergy KPIsoptimisedUse energy efficiently and, where practical, recover energyfrom operational activitiesOverall performance scores out of 10Target Target TargetG3EN5-7G3EN5-7G3EN5-7<strong>2010</strong>7/102006 2007 2008 20097 7 6.5 7.5<strong>2010</strong>6.5/102006 2007 2008 20096.5 6.5 6.5 7<strong>2010</strong>6.5/102006 2007 2008 20095.5 5.5 6.5 6.52006 2007 2008 20096.5 6.5 6.5 7<strong>2010</strong>6.529
WATERCARE SERVICES LIMITED <strong>ANNUAL</strong> <strong>REPORT</strong> <strong>2010</strong>Midge ComplaintsMidge breeding at the Mangere Wastewater Treatment Plant was kept undercontrol and no midge complaints were received during the year. The result can beattributed to a year-round monitoring and management programme that focuseson controlling midge breeding grounds around the plant and on reducing midgebreeding grounds in the community through public awareness initiatives. Effectiveresponse continues to be required particularly when warm, wet weather createsconditions in which midges thrive.Odour Complaints at the Mangere Wastewater Treatment PlantThere were six verified odour complaints received during the year compared to 11 in2008/09. All complaints were responded to in a timely manner. Odour control measurescontinue to be an important focus at the plant and include the use of covers and odourfilter beds as well as stationary and mobile deodoriser spraying units.a five-year period. Project Storm 2, the award winning initiative completed in 2008 toidentify improvements in <strong>Watercare</strong>’s network model, was used to support the need forcapacity upgrade projects where required to help reduce the risk of overflows. <strong>Watercare</strong>continues to invest in the wastewater network to reduce both the number and impactof overflow events. The short-term target is to have fewer than six dry-weather overflowsannually; however, the stretch target indicated in the ruler is for zero.Combined System Storm/Wastewater OverflowsThe completion of Project Hobson was a substantial achievement in terms of workto reduce combined storm and wastewater overflows. The new tunnel and pumpstation that were constructed are capable of storing wet-weather flows and therebyreducing the risk of combined overflows into Hobson Bay. The project will result inimprovements to the local environment and increase the recreational opportunities inthe bay, once the demolition of the old sewer is completed in the final quarter of <strong>2010</strong>.Wastewater OverflowsThree dry-weather overflows occurred in <strong>Watercare</strong>’s wastewater network. Two incidentswere from pump stations and the third from a sewer the result of breakages andleaks. All incidents were responded to in a timely and appropriate manner to minimiseadverse environmental effects. A debrief occurred in all instances as part of continuouslearning to identify and avoid future occurrences. The three dry-weather overflowswere one more than last year, yet still represent the company’s best performance overWeblinksFigures:Overflows from wastewater collection system Fig. 34Odour, midge and noise complaints Fig. 35Wastewater pump station overflows Fig. 36Sewer overflows Fig. 37Objective 6 Reduce and Control Odours, Overflows, Noise and other NuisancesA. Midge complaints (stan@water.co.nz)Number of complaints 45 40 35 30 25 20 15 10 5 0B. Odour complaints at the Mangere Wastewater Treatment Plant (stan@water.co.nz)Number of complaints 0.5 36 32 28 24 20 16 12 8 4 0C. Wastewater overflows excluding storms and power failures (charbour@water.co.nz)Number of overflows 0.5 18 16 14 12 10 8 6 4 2 0D. Combined sewer overflow management programme (charbour@water.co.nz) 0.5 Prioritise risksfor social,economic andenvironmentalimpactsOverflowscountedOverflowsmodelledReal-timemonitoringCompare acrossregionCompleteregional visionImplement shorttermoverflowmanagementprojectsImplementmedium-termoverflowmanagementprojectsImplement Fulllong-term overflow implementation ofmanagement overflow regionalprojects visionTarget Target Target Target<strong>2010</strong>10/102006 2007 2008 200910 7 9.5 10<strong>2010</strong>8.5/102005 2006 2007 200810 9.5 7.5 6<strong>2010</strong>8.5/102006 2007 2008 20096.5 5 8 9<strong>2010</strong>8.5/102006 2007 2008 20096.5 7 7 8Impact on key areas:SocialEconomicEnvironmentalReduce and control odours, overflows, noise andother nuisancesOverall performance scores out of 102006 2007 2008 20098.5 7 8 8.5<strong>2010</strong>930
WATERCARE SERVICES LIMITED <strong>ANNUAL</strong> <strong>REPORT</strong> <strong>2010</strong>Lower Nihotupu Dam in the Waitakere Ranges was completed in 1948. The storage lake has the capacity to hold 4.6 billion litres of water which is treated at Huia Water Treatment Plant.31
WATERCARE SERVICES LIMITED <strong>ANNUAL</strong> <strong>REPORT</strong> <strong>2010</strong>32
WATERCARE SERVICES LIMITED <strong>ANNUAL</strong> <strong>REPORT</strong> <strong>2010</strong>Policy 2Health, Safety and Well-BeingTo be an Industry-Best Workplace Maintenance servicemen from the Managere Wastewater Treatment Plant visit the pump station that was constructed as part of Project Hobson with Health and SafetyManager Mike Wilson. From left: Senior Instrumentation Technician Charlie Claxton, Instrumentation Technician Nick Van Burick, Electrician Robin Allan and Mike Wilson.33
WATERCARE SERVICES LIMITED <strong>ANNUAL</strong> <strong>REPORT</strong> <strong>2010</strong>Policy 2Health, Safety and Well-Being<strong>Watercare</strong>’s team approach to the culture of workplace safety continues, including working with contractors to achieve best practice.Staff identify and manage hazards; they look out for each other and ensure safe practices are in place before work commences. They alsoactively participate in the company’s Health and Safety Committee work and in the prompt reporting and management of non-lost-timeinjuries to ensure best-practice outcomes.Policy 2Overallperformanceout of 10<strong>Watercare</strong> at work:Tagging welcomed at ArdmoreCase StudyOBJECTIVE 71097.59.590607Provide staff with safe workingconditionsOBJECTIVE 80809 108.586.59706Maintain a working environment thatpromotes staff productivity andwell-beingOBJECTIVE 96.5060780708Develop staff to their full potential70809 108.5709 10Water Treatment Plant OperatorGraham Head is congratulated by<strong>Watercare</strong> Transition Chief ExecutiveIan Parton.Water Treatment Plant Operator Graham Head proved simple ideas can be the mosteffective with his contractor tracking system that won <strong>Watercare</strong>’s 2009 Overall ContinuousImprovement Award.Graham’s system, which uses a board with corresponding numbers and tags to quickly andclearly show which contractors are working on site, has improved safety measures at theArdmore Water Treatment Plant. Staff can scan the board for a quick and easy headcount.“Safety is a huge part of our work out here. It’s a big place with a lot of contractors coming andgoing,” says Graham.“I actually got the idea after the Beaconsfield mining incident in Australia. When those freedminers walked out after being rescued, the first thing they did was hang up their tags on thetracking board. Those tags were the only reason people knew they were missing, and it mademe think: why couldn’t this work for us?“We’ve been using the system for some time now and it’s working well. Someone willoccasionally take their tag home but that’s cleared up with a head check and a phone call.”The system has been successfully replicated also at the Waikato Water Treatment Plant.34
WATERCARE SERVICES LIMITED <strong>ANNUAL</strong> <strong>REPORT</strong> <strong>2010</strong>Lost TimeThree lost-time injuries were recorded for the year. Following investigation of eachincident, the company reviewed and modified procedures to prevent reoccurrence.The procedures involved the use of semi-portable equipment, access to valvechamber operations and following documented procedures. The duration of the losttimeinjuries was two days, four days, and eight days respectively.Lost-Time Injury Frequency RateThe lost-time injury frequency rate is an industry standard that measures thenumber of lost-time injuries per million hours worked and allows for comparisonsacross different industries. <strong>Watercare</strong>’s injury frequency rate of 3.52 remains belowthe internal target of fewer than five and the InfoHRM 2009 benchmark* of 11.3.This year, the company held 463 health and safety inductions which wereattended by 2,731 internal and external people. Additionally, 563 health and safetyinspections were completed which is 201 more than the target set for the year.Lost-Time Severity RateThe severity rate measures the number of days lost from injury per 200,000 hoursworked. <strong>Watercare</strong> has an injury severity rate of 3.75 which has increased froma rate of 2.20 last year. This reflects the increased severity of the lost-time injuriesas noted above.Trade Waste Compliance Advisor Hamish Jones signs in on arrival at ChemWastein Onehunga, Auckland.Zero Harm WorkplaceThis year <strong>Watercare</strong> joined the Business Leaders Forum “Zero Harm Workplaces”initiative. This initiative, led by the Prime Minister and Minister of Labour, has theobjective of making workplaces “Zero Harm”. Business leaders who have embracedthe initiative and signed, The Pledge, have committed to taking responsibility forhealth and safety and sharing resources to make health and safety everyone’sresponsibility. The Chief Executive has visited <strong>Watercare</strong> offices to inform staffof the commitment the company has made.* <strong>Watercare</strong> uses benchmarking reports from InfoHRM. InfoHRM is an internationalbenchmarking organisation offering a comprehensive range of human resourcemetrics across a number of New Zealand and Australian organisations.WeblinksFigures:Lost-time injury frequency rate Fig. 38Health and safety notes Fig. 39Objective 7 Provide Staff with Safe Working ConditionsA. Lost time (mwilson@water.co.nz)Number of lost-time injuries 0.5 18 16 14 12 10 8 6 4 2 0B. Lost time – injury frequency rate (mwilson@water.co.nz)Number of lost-time injuries per year x 1,000,000/hours worked 36 32 28 24 20 16 12 8 4 0infohrm benchmarkC. Lost time – severity rate (mwilson@water.co.nz)Number of days lost x 200,000/hours worked 36 32 28 24 20 16 12 8 4 0Target Target Target<strong>2010</strong>8.5/102006 2007 2008 200910 9.5 8 9<strong>2010</strong>9/102006 2007 2008 200910 9.5 8.5 9.5<strong>2010</strong>9/102006 2007 2008 200910 8.5 6 9.5Impact on key areas:SocialEconomicEnvironmentalProvide staff with safeworking conditionsOverall performance scores out of 102006 2007 2008 200910 9 7.5 9.5<strong>2010</strong>935
WATERCARE SERVICES LIMITED <strong>ANNUAL</strong> <strong>REPORT</strong> <strong>2010</strong>Unplanned AbsenteeismUnplanned absenteeism increased slightly to 1.77 per cent which is still significantlybelow the InfoHRM 2009 benchmark of 2.55 per cent. There were no absences asa result of industrial action or absence without leave.Staff WellnessAs a measure of staff wellness, <strong>Watercare</strong> reports the percentage of staff hourslost through illness. During 2009/10 the number of hours lost through staff illnessincreased marginally to 1.77 per cent of available hours compared to 1.69 per centof available hours in 2008/09.<strong>Watercare</strong> provides a comprehensive occupational health service to all staff.This year the service included:ÌÌ Medical consultation. The company’s medical team provides a broad rangeof health checks and consultations for employees.ÌÌ Health seminars. There were 18 seminars on various health related topicspresented to 311 staff.ÌÌ Influenza immunisation. The company provides free influenza vaccinationsannually and a total of 48 per cent of staff members were immunised.This is considered to be a high uptake relative to similar workplaces.ÌÌ All staff required to work in any wastewater environment have mandatoryvaccination for Hepatitis A and B, Tetanus, Typhoid, TwinRx and flu.ÌÌ Skin checks. The company’s medical team offer a regular programme of freeskin checks and sunscreen is readily available at all <strong>Watercare</strong> locations.ÌÌ Rehabilitation programmes. <strong>Watercare</strong> works closely with ACC in providingcomprehensive rehabilitation and return-to-work programmes for both workrelatedand non-work-related injuries.ÌÌ Employee Assistance Programme. In 2009 the <strong>Watercare</strong> implementeda comprehensive Employee Assistance Programme providing all employeeswith access to a wide range of confidential counselling services.Staff TurnoverStaff turnover reduced to historically low levels this year reflecting a very slowemployment environment. This was primarily due to the global economicdownturn but was also affected by the uncertainty of job security in the leadup to the integration of water and wastewater services for the Auckland region.The annualised turnover is expected to return to normal levels of 10 to 12 per centas the economy improves and the changes associated with integration settle.WeblinksStories:Round the Bays <strong>2010</strong>On the trail to successFigures:Voluntary staff turnover Fig. 40Unscheduled absences Fig. 41Objective 8 Maintain a Working Environment that Promotes Staff Productivity and Well-beingA. Unplanned absenteeism (bchappell@water.co.nz)% of unscheduled hours absent 3.2% 3.0% 2.8% 2.6% 2.4% 2.2% 2.0% 1.8% 1.6% 1.4%INFOHRM BENCHMARKB. Staff wellness (bchappell@water.co.nz)% of hours absent due to illness 3.2% 3.0% 2.8% 2.6% 2.4% 2.2% 2.0% 1.8% 1.6% 1.4%C. Staff turnover (bchappell@water.co.nz)Voluntary leavers as a % of permanent staff – deviation from target range 9% 8% 7% 6% 5% 4% 3% 2% 1% 0%Target Target Target<strong>2010</strong>8/102006 2007 2008 20098.5 9.5 7.5 8.5<strong>2010</strong>8/102006 2007 2008 20098.5 9.5 7.5 8.5<strong>2010</strong>5/10infohrmBENCHMARK2006 2007 2008 20099 5.5 4.5 10Impact on key areas:SocialEconomicEnvironmentalMaintain a working environment that promotesstaff productivity and well-beingOverall performance scores out of 102006 2007 2008 20098.5 8 6.5 9<strong>2010</strong>736
WATERCARE SERVICES LIMITED <strong>ANNUAL</strong> <strong>REPORT</strong> <strong>2010</strong>TrainingThe company invested an average of $1,395 per employee for educational anddevelopment purposes during 2009/10, providing an average of 25 hours oftraining per employee.The Engineering Graduate Group, established in 2007 to support the developmentof young engineers, continued with six graduates achieving chartered status during2009/10. Also maintained was the regular seminar series introduced in 2008 whereengineering staff present their experiences and learnings from projects in whichthey have been involved.In addition, training and development at operator level also maintained momentumwith a further six staff completing formal qualifications during 2009/10 in eitherwater or wastewater treatment or water reticulation.External and Internal AppointmentsThis is a measure of the way in which positions are filled, by internal promotionand developmental moves or by external appointment. <strong>Watercare</strong> aims to developstaff and offer internal transfers and promotions wherever appropriate. This yearthe ratio of external to internal appointments is 2.4 (24 external appointments,10 internal appointments) which is a reduction on the 2008/09 achievementof 1.3, partially due to increases in appointments from outside of <strong>Watercare</strong> dueto integration.As a result of integration, all vacancies since November 2009 have been advertisedwithin <strong>Watercare</strong>, the LNOs and councils unless the necessary skills and experiencewere unavailable. If appointments from these organisations are considered ‘internal’then the 2009/10 ratio drops significantly to 1.3.Reticulation Serviceperson Mihaka Williams undertakes training that was designed to teach staffwho work in reservoirs about how their bodies react when submerged in very cold water.Employment Equity and Diversity<strong>Watercare</strong> continues to seek the best candidates for all jobs and has a diverse rangeof employees. The <strong>Watercare</strong> workforce is represented by over 35 different nationalities.WeblinksStories:Idea of the yearScrap-heap innovation makes task easy at MangereHard work pays offChartering along the path to successGood news arrives by postFigures:Investment in staff Fig. 42Staff service profile Fig. 43Staff demographics Fig. 44Average staff numbers Fig. 45Workforce by employment type, contract and region Fig. 46Objective 9 Develop Staff to their Full PotentialA. Training (bchappell@water.co.nz)Training/study hours per employee 0.5 INFOHRM BENCHMARK3 6 9 12 15 18 21 24 27 30B. External and internal appointments (bchappell@water.co.nz)Ratio of external/internal appointments 0.5 3.25 3.00 2.75 2.50 2.25 2.00 1.75 1.50 1.25 1.00C. Employment equity and diversity (bchappell@water.co.nz) 0.5 0.5 0.5Measureand monitordemographicindicatorsAccreditedemployer withNZISFreedom ofassociationpromotedRemunerationexternallybenchmarkedTargetedemployeedevelopmentprogrammesidentifiedExit interviewresultsincorporated intomanagementdecision-makingSalaries assessedon performanceINFOHRM BENCHMARKAddressdemographictrendsTargetedemployeedevelopmentprogrammes inplacePerformance anddevelopmentreview PADRextended toall staffTarget Target TargetG3LA11,HR3G3HR4,9<strong>2010</strong>8.5/102006 2007 2008 20097 8.5 8.5 9<strong>2010</strong>4.5/102006 2007 2008 20095.5 7.5 4.5 8.5<strong>2010</strong>8.5/102006 2007 2008 20097.5 7.5 8.5 8.5Impact on key areas:SocialEconomicEnvironmentalDevelop staff to their full potentialOverall performance scores out of 102006 2007 2008 20096.5 8 7 8.5<strong>2010</strong>737
WATERCARE SERVICES LIMITED <strong>ANNUAL</strong> <strong>REPORT</strong> <strong>2010</strong>38
WATERCARE SERVICES LIMITED <strong>ANNUAL</strong> <strong>REPORT</strong> <strong>2010</strong>Policy 3Stakeholder RelationshipsTo be Responsive to Stakeholder Requirements <strong>Watercare</strong> offers the people of Auckland and visitors to the region the opportunity to venture deep into the Waitakere Ranges aboardthe Rain Forest Express. Approximately 12,000 people enjoy the experience each year.39
WATERCARE SERVICES LIMITED <strong>ANNUAL</strong> <strong>REPORT</strong> <strong>2010</strong>Policy 3Stakeholder Relationships<strong>Watercare</strong> engages with the people of Auckland in many ways: from providing free tap water in recyclable cups to runners at theannual Round the Bays fun run, to encouraging visitors to travel to the Upper Nihotupu Dam on the company’s narrow-gauge railway,the Rain Forest Express. <strong>Watercare</strong> staff are in regular contact with customers, shareholders, regulators and people who live and worknear the sites of the company’s projects and operations. Project newsletters and the company website keep the public up to date withlatest developments and <strong>Watercare</strong> staff members meet regularly with Maori, customer and environmental advisory groups.Policy 3Overallperformanceout of 10<strong>Watercare</strong> at work:Water-wise campaign tackles record-breaking dry spellCase StudyOBJECTIVE 108.58.59 8.58.50607Maintain open communication,educational initiatives and recreationalopportunitiesOBJECTIVE 110809 109999906Participate in relevant public policyinitiatives and consultation with thecommunity and stakeholdersOBJECTIVE 12100607100708100809 10101009 10Comply with statutory requirementsNetworks Manager Mark Bourne isinterviewed by Josh Heslop for theSunrise programme on Channel Three.<strong>Watercare</strong> actively responded to the recording-breaking dry spell in the first four monthsof <strong>2010</strong> with a widespread ‘use water wisely’ campaign, targeting the people of Auckland,coupled with the prudent management of all water sources.While the region entered summer with dams that were nearly full, water storage levelsfell rapidly and dropped below normal as everyone enjoyed week after week of sunny,warm days.As a result, the region faced a situation whereby if the dry spell had continued throughwinter, mandatory water restrictions may have been required over the summer of <strong>2010</strong>/11.Therefore <strong>Watercare</strong> sought to raise awareness of the situation in the community andto encourage sensible water use through the use of simple and consistent messages.By achieving voluntary savings earlier, the community could avoid or at least delayany restrictions.To achieve this, Network Manager Mark Bourne liaised frequently with broadcast andprint media, keeping them up to date on dam levels and rainfall as well as the company’soperational response mechanisms and plans.Mark’s media reach was supplemented by advertisements which ran in the New ZealandHerald and suburban newspapers, and by updates to the corporate website.The company liaised with the LNOs to ensure they gave their customers the sameconsistent information.40
WATERCARE SERVICES LIMITED <strong>ANNUAL</strong> <strong>REPORT</strong> <strong>2010</strong>Provision of Information Channels<strong>Watercare</strong> maintains a wide variety of stakeholder contact mechanisms.These include: regular project newsletters for communities affected by thecompany’s projects and operations; communications to media; the Annual WaterQuality Report to customers; the annual Asset Management Plan; the AnnualReport; and the website www.watercare.co.nz. This year the company publishedtwo, rather than four, issues of its external publication ‘Interflow’ as it focusedinternal resources on integration projects.<strong>Watercare</strong> ensured both company and LNO staff were informed of integrationplanning and progress through project newsletters and a publication called ‘YourSource’. In addition, monthly update meetings were held with Newmarket-basedstaff. These messages were communicated to all staff via the intranet basednewsletter, ‘The Font’.Staff members participate in industry forums, make presentations to industryseminars and community groups, and guest-lecture at tertiary institutions.The company runs an education programme – Adopt a Stream – that offers primaryand intermediate-school pupils lessons about water quality, the water cycle,conservation and the environment. The programme is fully resourced with waterquality testing kits, information packs and worksheets, and the coordinator,a trained teacher, educates school groups in the field and in the classroom.<strong>Watercare</strong> ran a ‘use water wisely’ campaign that involved media briefings,advertising and website updates in response to very low rainfall in the first fourmonths of <strong>2010</strong>. Refer to the policy case study on page 40 for further details.Provision of Recreational Channels<strong>Watercare</strong> provides access to land adjacent to its facilities in the Waitakere andHunua ranges and on the Manukau Harbour for recreational use. Walking tracks aremaintained in both the Waitakere and Hunua ranges and fishing by boat is allowedby permit at Mangatangi and Mangatawhiri dams. The <strong>Watercare</strong> Coastal Walkway,adjacent to the Manukau Harbour, remains a popular recreational facility. This yearsaw the opening to the public of a walkway across land planted with native plantsadjacent to Greenwood Road, Mangere.The company continued to operate the Rain Forest Express, the narrow-gaugerailway built to service the Upper Nihotupu Dam in around 1912. The line, whichis still used for maintenance purposes, has carried more than 150,000 passengerssince it was opened to the public and is a popular attraction for tourists and locals.<strong>Watercare</strong> has provided ongoing support the Oxfam Water for Survival event eachyear by offering access to the Nihotupu Tramline for a charity walk.A pupil from Hunua School carries out turbidity testing on a water sample, under the supervisionof Adopt A Stream programme coordinator Sally Smith. Each year, Sally helps over 7,000 pupilscarry out hands-on field studies of their local waterways and teaches them about the water cycleand the fundamental relationship between water and all living things.WeblinksStories:TV3 takes the plungeRecord year for Adopt A StreamFigures:Rain Forest Express passengers and trips Fig. 47Communications with stakeholders Fig. 48Community impact of operations Fig. 49Objective 10 Maintain Open Communication, Educational Initiatives and Recreational OpportunitiesA. Provision of communication channels (rhughes@water.co.nz) 0.5 Public liaisonB. Provision of recreational facilities (rhughes@water.co.nz) Specific eventsponsorshipMedia liaisonRain ForestExpressInternalnewsletterBirdwatchinghidesWebsiteFishing accessBrochuresWalking tracks:Western damsProjectnewslettersWalking tracks:Southern damsEducationalprogrammesWalking tracks:Wastewater plantforeshorePublic awarenesscampaignWalking tracks:Adjacent toGreenwood Road,MangereQuarterly externalmagazineWater ForSurvivalsponsorshipDirect mailWalking tracks:Puketutu IslandTargetTargetG3S01<strong>2010</strong>8.5/102006 2007 2008 20098 8 9 9<strong>2010</strong>9/102006 2007 2008 20098.5 8.5 8.5 7.5Impact on key areas:SocialEconomicEnvironmentalMaintain open communication, educationalinitiatives and recreational opportunitiesOverall performance scores out of 102006 2007 2008 20098.5 8.5 9 8.5<strong>2010</strong>8.541
WATERCARE SERVICES LIMITED <strong>ANNUAL</strong> <strong>REPORT</strong> <strong>2010</strong>Participation in Policy Initiatives and Statutory Submissions<strong>Watercare</strong> had a particularly busy year with regard to participation in thedevelopment of relevant legislation and policy initiatives to ensure the effectivedelivery of regional water and wastewater services.The company made submissions to:ÌÌ The proposed National Environmental Standards on Ecological Flows andWater Levels.ÌÌ The review of the National Policy Statement – Coastal. The policy statesobjectives and policies to achieve the purpose of the Resource Management Actin relation to New Zealand’s coastal environment.ÌÌ The Foreshore and Seabed Legislation Review.ÌÌ The Infrastructure Bill.ÌÌ Waikato-Tainui Raupatu Claims (Waikato River) Settlement Bill.ÌÌ The company also participated in and responded to requests on the AucklandGovernance legislation:1. Local Government (Tamaki Makaurau Reorganisation) Act 20092. Local Government (Auckland Council) Act 20093. Local Government (Auckland Council) Amendment Act <strong>2010</strong>4. Local Government (Auckland Transitional Provisions) Act <strong>2010</strong>In addition, <strong>Watercare</strong> made submissions to a number of district and regionalplan reviews, and designations.The company also convened a Policy IntegrationGroup to look at how best to provide for <strong>Watercare</strong>’s interests in the new regionalplanning documents. The group is looking at how the company’s engineering andasset needs can be accommodated most effectively within a complex regulatoryframework. The group has worked to provide input to the regional planning processbeing developed for the new Auckland Council. This includes the development ofthe Spatial Plan, Infrastructure Plan and the supporting regional framework.External ConsultationAs a result of preparation for integration, <strong>Watercare</strong> has had a much closerrelationship with the LNO staff over the past year with some staff participating inProject One to plan for and deliver integration. The organisations worked togetherin response to the dry-weather conditions that prevailed in early <strong>2010</strong>. In addition,the Auckland Water Group continued to meet on a monthly basis to work on issuesof mutual interest and to share information.Environmental Planning Manager Garry Maskill reviews documents regarding the proposalto rehabilitate Puketutu Island with treated biosolids.Work with the industrial trade waste customers continued through regular visits andthrough the forum of the Employers and Manufacturers Association. This year thelevel of consultation increased as <strong>Watercare</strong> worked to prepare an amendment tothe Trade Wastes Bylaw required as a result of integration.Consultation resumed in preparation for obtaining resource consents for the HunuaNo. 4 Trunk Watermain Project; a critical infrastructure project to improve thesecurity of the water supply and to meet future demand requirements.Similarly, consultation has also been held regarding other major <strong>Watercare</strong>projects. Communication with parties who are interested in <strong>Watercare</strong>’s proposalto rehabilitate a former quarry on Puketutu Island with biosolids was maintainedin order to settle outstanding matters of concern.Community liaison group meetings continued with neighbours of the MangereWastewater Treatment Plant and Huia Water Treatment Plant.WeblinksStories:Digging into the past<strong>Watercare</strong> to help people in difficulty paying their water billFigure:Public policy participation Fig. 50Objective 11 Participate in Relevant Public Policy Initiatives and Consultation with the Community and StakeholdersA. Participate in policy initiatives and statutory submissions (bevans@water.co.nz) 0.5 0.5Identification ofrelevant issuesAssessimplications for<strong>Watercare</strong>/waterindustryCommitmentto addressingissuesAnalysis andreview of optionsConsultationFormulatepolicies orpositionsLodgesubmissionsRepresentationsto decisionmakersReview keyoutcomesIncorporateoutcomes intopolicies andproceduresB. External consultation (bevans@water.co.nz) 0.5 0.5 0.5Project-specific:EnvironmentalgroupsProject-specific:Tangata whenuaProject-specific:ShareholdersProject-specific:CustomersGeneral: AffectedpartiesGeneral:ShareholdersGeneral: CustomersGeneral:EnvironmentalgroupsGeneral: TangatawhenuaGeneral:PublicTargetTargetG3S05<strong>2010</strong>9/102006 2007 2008 20099 9 9 9<strong>2010</strong>8.5/102006 2007 2008 20098.5 8.5 8.5 8.5Impact on key areas:SocialEconomicEnvironmentalParticipate in relevant public policy initiatives andconsultation with the community and stakeholdersOverall performance scores out of 102006 2007 2008 20099 9 9 9<strong>2010</strong>942
WATERCARE SERVICES LIMITED <strong>ANNUAL</strong> <strong>REPORT</strong> <strong>2010</strong>44
WATERCARE SERVICES LIMITED <strong>ANNUAL</strong> <strong>REPORT</strong> <strong>2010</strong>Policy 4Customer ServiceTo Provide High-Quality Products and Meet Customer Service Level Requirements Trade Waste Technical Specialist Richard Rollins delivers samples to Receptionist Nina Gasson. <strong>Watercare</strong>’s laboratory carries out water,wastewater, environmental solids and air quality analyses for the company as well as four local authorities and private industry.45
WATERCARE SERVICES LIMITED <strong>ANNUAL</strong> <strong>REPORT</strong> <strong>2010</strong>Policy 4Customer Service<strong>Watercare</strong> supplies A-grade water to its primary customers – six LNOs – who onsell it to more than 1.2 million consumers. <strong>Watercare</strong>’s LaboratoryServices business unit processes more than 13,000 samples per month for a wide range of clients and continues to introduce initiatives to improveturnaround times. Additionally, the company fulfils a regulatory role in administering the Trade Waste Bylaw that maintains the integrity of thewastewater collection system and treatment process.Policy 4OBJECTIVE 13Overallperformanceout of 10<strong>Watercare</strong> at work:<strong>Watercare</strong> prepares billing systemto serve over 430,000 customersCase Study8.59.59.5 9.59.506070809 10Continually improve service deliveryto customersChief Customer Officer MarkLawrence (left) and Jake Ballediscuss the new <strong>Watercare</strong> bill design.<strong>Watercare</strong>’s aim for integration is for its customers to notice as little change as possible.However, this is easier said than done as there are different service structures in place acrossthe region. The residential billing system alone involves different meter reading intervals, tariffs,incentives or penalties, and distribution methods.The challenge of building a billing system and of designing a bill template that canaccommodate these differences is being tackled by software and integration project teams.Suzanne Burrell, who is overseeing this piece of work, says the software team is working very hard tomake sure the migration of customer information from the LNOs to <strong>Watercare</strong> is correct. It will makesure the information from the LNOs is captured in the same way to enable consistent reporting.<strong>Watercare</strong> recognises that the customer information needs to be 100 per cent accurate fromthe outset, especially given the billing system will generate several thousand bills per day.Jake Balle, who is designing the bill, says that as with the billing system, the bill has to caterfor the different billing nuances of each LNO.“Some will have a wastewater component, others will not” explains Jake. “The templatemust accommodate a number of permutations and be able to display the informationin a sensible way.”The key to effective bill design is the quality of the information presented, not the quantity.“We are aiming to make good use of the space on the bill,” says Jake. “As a monopolyprovider, we will have an obligation as water stewards to try and influence customer behaviourfor the better on a conservation front. Therefore, the bill is likely to include a graphic thatcompares a household’s water consumption to other households of a similar size.”Conveying relevant information in a clear and logical manner is very important as researchindicates that around 75 per cent of our customers will have contact with us only via the bill.46
WATERCARE SERVICES LIMITED <strong>ANNUAL</strong> <strong>REPORT</strong> <strong>2010</strong>Customer SatisfactionThis year, in light of government decisions on Auckland governance includingthe integration of the Auckland water and wastewater industry, and the move toretail distribution, the company liaised with its shareholders and made a decisionto cancel the customer satisfaction survey for <strong>2010</strong>. New customer satisfactionsurveys will be developed in due course to meet the needs of the retail organisation.Public Health Grading – Treatment and Distribution<strong>Watercare</strong> continues to meet the requirements of the Drinking Water Standardsfor New Zealand and remains committed to working with its customers and theMinistry of Health on the development of the revised standards. The company alsomaintains its ‘A’ grade rating for treatment plants and ‘a’-grade rating for the watersupplynetwork as agreed with its customers.Caretaker Dave Hodgson checks Lower Huia Dam’s water level using a piezometer.WeblinksFigures:Drinking water standards compliance Fig. 52Typical analysis of Auckland’s drinking water Fig. 53Customer satisfaction feedback Fig. 54Product life cycle health and safety impact assessmentFig. 55Product information disclosure Fig. 56Ethics and business integrity Fig. 57Objective 13 Continually Improve Service Delivery to CustomersA. Customer satisfaction feedback* (bevans@water.co.nz)% LNO customers that rate <strong>Watercare</strong> as ‘very good’ or ‘excellent’ 0.5 B. Public health grading – treatment (cwatson@water.co.nz) Treatment plant‘D’ grade10 20 30 40 50 60 70 80 90 100*No customer satisfaction survey was conducted in <strong>2010</strong> as a result of the impending integration of the Auckland water services industryTreatment plant‘C’ gradeTreatment plant‘B’ gradeTreatment plant‘A’ gradeC. Public health grading – distribution (cwatson@water.co.nz) Water distributionnetwork ‘d’ gradeWater distributionnetwork ‘c’ gradeWater distributionnetwork ‘b’ gradeWater distributionnetwork ‘a’ gradeTarget Target TargetG3PR1, 52006 2007 20085.5 8.5 8.5<strong>2010</strong>10/102006 2007 2008 200910 10 10 10<strong>2010</strong>10/102006 2007 2008 200910 10 10 10Impact on key areas:SocialEconomicEnvironmentalContinually improve service delivery to customersOverall performance scores out of 102006 2007 2008 20098.5 9.5 9.5 9.5<strong>2010</strong>9.547
WATERCARE SERVICES LIMITED <strong>ANNUAL</strong> <strong>REPORT</strong> <strong>2010</strong>48
WATERCARE SERVICES LIMITED <strong>ANNUAL</strong> <strong>REPORT</strong> <strong>2010</strong>Policy 5Asset ManagementTo Manage and Maintain the Long-Term Integrity of Assets Each year, one of the digesting tanks at the Mangere Wastewater Treatment Plant is taken out of service for three months while the condition of the roof and wall jointsis assessed and the pumps and valves are overhauled. Here Wayne Poemare of Hydra-Care NZ Ltd is working to empty a tank before its inspection.49
WATERCARE SERVICES LIMITED <strong>ANNUAL</strong> <strong>REPORT</strong> <strong>2010</strong>Policy 5Asset Management<strong>Watercare</strong> remains committed to supplying water and wastewater services that meet the needs of its customers while ensuring that these services areeconomically viable, environmentally sound and socially responsible. The company’s asset management programme and the capital expenditure that drivesit are motivated by three factors: growth, asset renewal and service level improvement. Project Hobson, the replacement of an ageing and unsightly sewerbisecting Hobson Bay with a three-kilometre-long tunnel, is a high-profile example of that process. The increased capacity of the replacement asset catersfor Auckland’s continued population growth as well as achieving improved environmental standards by significantly reducing overflows.Policy 5Overallperformanceout of 10<strong>Watercare</strong> at work:Construction under way on Hunua No. 4Case StudyOBJECTIVE 146.57.56.5 6.56.50607Ensure that capital projects haverobust business cases and aredelivered to planOBJECTIVE 150809 1077.58 8.5906Lead the development of an integratedsolution for the management of water,wastewater and stormwater servicedemandOBJECTIVE 168.50699 9.5Achieve continuous improvementin maintaining assetsOBJECTIVE 1760607076.50708087.5 80809 109.509 10809 10Achieve continuous improvementin sustainable business performanceA section of the Hunua No. 4Watermain is lifted into positionunder the Manukau Harbour Bridge.<strong>Watercare</strong>’s approach to the Hunua No. 4 Trunk Watermain Project demonstrates itscommitment to the people of Auckland.The $250 million project involves laying a 28-kilometre-long watermain from Manukau toEpsom via Mangere and Onehunga. Principal Engineer Andy Spittal says that while work onmost of the route is not scheduled to begin until 2012, work on the section that crosses theharbour was carried out in 2009/10 as part of the New Zealand Transport Agency’s (NZTA)Manukau Harbour Crossing Project.“This is a good example of <strong>Watercare</strong> working with other authorities to benefit the peopleof Auckland,” explains Andy. “It minimises the period of disruption caused by constructionand is good for our bottom line – helping us to maintain our position as a least-costprovider of water and wastewater services.”Andy says the watermain – which will carry 3,000 litres of water a second – will not onlycater for population growth but also increase the security of the water supply.“There are water supply risks that exist because of the degree of reliance on existingreticulation infrastructure,” he says. “At the moment, it’s impossible to shut the older linesdown for more than a few hours.“By duplicating sections of the existing Hunua 1, 2 and 3 watermains, the Hunua 4 willenable those mains to be taken out of service to carry out essential maintenance.”The company has applied for regulatory approvals and entered the detailed design phasefor the rest of the watermain.50
WATERCARE SERVICES LIMITED <strong>ANNUAL</strong> <strong>REPORT</strong> <strong>2010</strong>Capital Expenditure Variance with Asset Management PlanThe Asset Management Plan (AMP) represents indicative expenditure over a 20-yearhorizon. The plan is published annually and is available at www.watercare.co.nz.The capital expenditure budget for the 2009/10 year was set at 69 per cent of theAMP: $138.4 million. The actual expenditure of $120.1 million was 60 per centof the AMP and 87 per cent of the budget. The year’s variance was due to thereprioritisation of expenditure in a number of areas as detailed below:ÌÌ Deferment of the company’s information system upgrade pending the outcomeof the discussions as part of the integration of the water and wastewaterservices industry under <strong>Watercare</strong>: $8.6 million.ÌÌ Deferment of odour buffer and water reservoir land purchases due to changingmarket conditions and project reprioritisation: $8.3 million.ÌÌ Indefinite deferment of the Papakura Water Treatment Plant upgrade because itis more effective over the long term to upgrade the Waikato Water Treatment Plant:$12.2 million.ÌÌ Revised delivery Programme for the Northern Waitakere Wastewater Servicingproject to ensure capital is used efficiently to meet development needs as theyoccur: $8.9 million.ÌÌ Revised delivery programme for the Titirangi Reservoir expansion: $6.8 million.ÌÌ Revised delivery programme for the South Western Interceptor extension: $6.6 million.ÌÌ Delays to the Mt Wellington Water Supply Project until the developer hasobtained consent: $6.4 million.ÌÌ Extended tender selection process for the wastewater treatment plant centrifugeand alkaline stabilisation project, delaying expenditure: $3.3 million.ÌÌ Commencement of the construction of Huia Water Treatment Plant disinfectionsystem upgrade. Project value: $2.8 million.ÌÌ Pipe relocation works to Auckland Harbour Bridge and Victoria Park.Project value: $8.4 million.ÌÌ Commencement of the construction of the Waitakere No. 2 replacementwatermain. Project value: $5.8 million.ÌÌ Commenced construction of the NorSGA wastewater system. Project value:$29.7 million.ÌÌ Project One to integrate regional water and wastewater services was includedin this years’ AMP.Overall Performance in WSAA Asset Management Benchmarking<strong>Watercare</strong> benchmarks its asset management processes against a frameworkdeveloped by the Water Services Association of Australia (WSAA). WSAA-accreditedauditors conduct a formal audit process every five years. During intervening years,<strong>Watercare</strong> undertakes a self-assessment using the same framework. In <strong>2010</strong>,<strong>Watercare</strong> chose not to carry out a self-assessment, given staff demands for theimpending integration of Auckland’s water industry. In preparation for integration,<strong>Watercare</strong> is currently working with the LNOs on the development of a regionalasset management plan that will help prioritise and manage regional infrastructureinvestment over the next 20 years.Major initiatives in 2009/10 were:ÌÌ Completion of construction work on Project Hobson – a project to replacethe ageing sewer that bisects Hobson Bay with a three-kilometre-long tunnel.Project value: $118 million.ÌÌ Continued consultation on the proposal to rehabilitate a former quarry onPuketutu Island with treated biosolids. Project value: $32 million.ÌÌ Rehabilitation of a number of sewers by relining. Project value: $2.6 million.ÌÌ Continued construction of upgrades to the Mt Wellington water supply network.Project value: $16 million.ÌÌ Modelling and route selection for the Hunua No. 4 Trunk Watermain, togetherwith the construction of the section under the new Manukau Harbour Bridge.Project value: $250 million.ÌÌ Continued construction of the New Lynn Sewer Overflow Mitigation Project.Project value: $8.8 million.ÌÌ Completed construction on the extension of the Mangere South Branch Sewerdiversion resulting in increased capacity. Project value: $7.1 million.ÌÌ Rehabilitation works to the Hunua No. 1 Watermain. Project value: $5.1 million.ÌÌ Construction of the Ardmore Alum and Polymer Upgrade Project to enhance thesecurity of the Ardmore Water Treatment Plant. Project value: $3.5 million.Western SuperintendentPriyan Perera discussesprogress on thechlorine disinfectionupgrade at the HuiaWater Treatment Plantwith Senior EngineerMatthew Tolcher.WeblinksStories:Hydraulic jaws take first bite out of ageing sewerStaff in awe of the scale of HobsonHobson’s HeroesConstruction underway on Hunua 4Ageing tunnel undergoes repair workArdmore upgrade completeKeeping the eastern suburbs flowingWatermain eases past the finish lineModel balancing actFigures:Capital expenditure programmes Fig. 58Infrastructure investments provided for public benefit Fig. 59Objective 14 Ensure that Capital Projects have Robust Business Cases and are Delivered to PlanA. Capital expenditure variance with Asset Management Plan (tmunrow@water.co.nz)% variance 45% 40% 35% 30% 25% 20% 15% 10% 5% 0%B. Overall performance in WSAA asset management benchmarking* (jlayyee@water.co.nz)% achievement on WSAA evaluation 0.5 60% 63% 66% 69% 72% 75% 78% 81% 84% 87%WSAA BENCHMARKMeDIANWSAA BENCHMARKMAXIMUM* No WSAA benchmarking was undertaken in <strong>2010</strong> as a result of the impending integration of the Auckland water services industry.Target Target<strong>2010</strong>4/102006 2007 2008 20096.5 8 6.5 42006 2007 2008 20098 8.5 8.5 8.5Impact on key areas:SocialEconomicEnvironmentalEnsure that capital projects have robust businesscases and are delivered to planOverall performance scores out of 102006 2007 2008 20096.5 7.5 6.5 6.5<strong>2010</strong>6.551
WATERCARE SERVICES LIMITED <strong>ANNUAL</strong> <strong>REPORT</strong> <strong>2010</strong>Regional Planning<strong>Watercare</strong>’s capital planning process is driven by the requirements of its customersand the region. The company follows a rigorous asset management planningprocess in consultation with the LNOs and incorporates assumptions for populationgrowth, asset life, changing household and industrial demand, the future securityof supply, level of service and regulatory compliance. <strong>Watercare</strong> and the LNOshave shared population forecasts and integrated computer models of the trunk andlocal water and wastewater pipe systems. As a result, <strong>Watercare</strong> has developed itspreferred long-term master plans to deliver the most cost-effective water suppliesand wastewater services for the Auckland region. These plans include water useprojections to 2050, yet retain a high level of flexibility, allowing for changes inpopulation and in patterns of consumption and conservation.This year, the Project Storm 2 model used as the basis of capacity analysisrequirements in the asset management plan (AMP) won several industry awards,demonstrating innovation and value in <strong>Watercare</strong>’s asset management function.Three Waters PlanningThe Three Waters Planning Project – which began in 2004 – was a cooperativeeffort between <strong>Watercare</strong> and the LNOs of the Auckland region. The project involvedcomprehensive analyses to identify opportunities to improve the region’s efficiencyin the planning and delivery of the three core water services, drinking water,wastewater and stormwater, through to 2100 and beyond. A Three Waters StrategicPlan was published in December 2008 and a Draft Three Waters ImplementationPlan was prepared in June <strong>2010</strong>. The draft requires input from the new AucklandCouncil before it can be finalised. Three important strategic outcomes of theprocess to date are the setting of a target to reduce the 2004 per capita waterdemand by 15 per cent by 2025, the identification of the Waikato River as the mainsource of water to provide for future regional growth and the identification of theMangere and Rosedale wastewater treatment plants as the main facilities to meetregional needs through to 2100. The next steps in three waters planning includefurther development of a water demand management plan and preparation of longterminfrastructure development plans for delivering water supply and wastewaterservices through to 2062. In the meantime, investigations and planning for thenew Central Interceptor are progressing.Hunua No. 4 Watermain Project Manager Andy Spittal and Project Engineer Sharon Danksdiscuss progress on the installation of pipe under the Manukau Harbour Bridge.Objective 15 Lead the Development of an Integrated Solution for the Management of Water,Wastewater and Stormwater Service DemandA. Regional planning (pjaggard@water.co.nz) 0.5Involve LNOsin assetmanagementplanningAddress allissues raised byLNOsAgree waterdemand savingstargetsAgree demandsavings initiativesProgresswastewaternetwork consentsin an integratedmannerDevelop jointwater modelsProgress jointwater sourceoptions reviewAgree on aregional vision forwater, wastewaterand stormwaterDevelop jointwastewatermodelsDevelopregionallycoordinatedimplementationplansB. Three Waters development (jhodges@water.co.nz) 0.5 0.5 0.5 0.5Recognise needfor integrated,sustainablewater servicesFacilitate ThreeWaters visionConsultation andenhancementof Three WatersvisionLeadingdevelopment ofThree WatersStrategic PlanSupportdevelopment ofregional water,wastewater andstormwatermaster plansPromotedevelopment andimplementationof regional landuse policies<strong>Watercare</strong> trunkmaster plans(water andwastewater)Pilot integratedregional planningand investmentprogrammeCompleteintegrated water,wastewater andstormwatermaster plansImplementationof <strong>Watercare</strong> trunkmaster plansTarget Target<strong>2010</strong>9.5/102006 2007 2008 20098 8.5 9 9<strong>2010</strong>8/102006 2007 2008 20095.5 6 7 8Impact on key areas:SocialEconomicEnvironmentalLead the development of an integrated solution for the managementof water, wastewater and stormwater service demandOverall performance scores out of 102006 2007 2008 20097 7.5 8 8.5<strong>2010</strong>952
WATERCARE SERVICES LIMITED <strong>ANNUAL</strong> <strong>REPORT</strong> <strong>2010</strong>Maintenance Management Systems<strong>Watercare</strong>’s maintenance team continued to deliver consistent maintenancepractices to improve plant performance, extend the life of assets and minimiseoperating costs. A key component of the project has been the implementationof reliability centred maintenance (RCM). RCM is a framework that identifies theoptimum time to maintain or replace assets based on operational performance,cost, health and safety, and the environment. The roll-out of RCM across theorganisation has been completed and the focus is now on progressing theoptimisation of risk-based maintenance programmes, which aims to optimisethe RCM models to determine the most efficient and cost effective maintenanceprogramme. The RCM programme is used to assist with budgeting and support ofthe development of the AMP.Maintenance Optimisation and Development<strong>Watercare</strong>’s maintenance management strategy was consistently appliedthroughout the company. Optimisation of the RCM programme is progressingto deliver the most efficient and cost-effective maintenance programme.Work started on the replacement of the existing computerised maintenancemanagement system (CMMS). The new system will allow the RCM maintenanceplans to link directly to maintainable assets within the CMMS. This will providegreater functionality resulting in improved maintenance activities.Each year, one of the digesting tanks at the Mangere Wastewater Treatment Plant is taken outof service for three months while the condition of the roof and wall joints is assessed and thepumps and valves are overhauled. Here Process Controller Jonathan Piggot monitors the cleanoutof a tank before its inspection.Objective 16 Achieve Continuous Improvement in Maintaining AssetsA. Maintenance management systems (psoakell@water.co.nz) All assetsrecorded inasset registerB. Maintenance optimisation development (psoakell@water.co.nz) DevelopmaintenancephilosophyAssets registercomputerisedand availableto staffDevelop actionplanAsset financialinformationrecordedDevelopmaintenancevision andstrategyKey assetshave assignedmaintenanceprogrammesImplementmaintenancevision andstrategyMaintenanceprogrammesrecorded in assetregisterEstablishworkflowmanagementMaintenanceprogramme basedon criticalityImplementworkflowmanagementMaintenanceundertakenaccording to planEvaluateeffectiveness withkey performanceindicatorsMaintenancehistory recordedfor key assets50% of RCMstrategyimplementedConsistentmaintenancepracticescompany-wide100% ofRCM strategyimplementedMaintenanceprogrammeprioritised usingRCMComputerisedmaintenancemanagementsystemTarget Target<strong>2010</strong>10/102006 2007 2008 20099.5 9.5 9.5 10<strong>2010</strong>9/102006 2007 2008 20097.5 8 8.5 9Impact on key areas:SocialEconomicEnvironmentalAchieve continuous improvement in maintaining assetsOverall performance scores out of 102006 2007 2008 20098.5 9 9 9.5<strong>2010</strong>9.553
WATERCARE SERVICES LIMITED <strong>ANNUAL</strong> <strong>REPORT</strong> <strong>2010</strong>Management Systems<strong>Watercare</strong>’s management systems were independently audited by Telarc SAI in the last12 months against the appropriate standards: Environmental Management System(ISO 14001); Quality Management System (ISO 9001); and for the Health and SafetyManagement System (AS/NZS 4801).Sustainable Management of External Suppliers<strong>Watercare</strong> applies sustainable practices to the way in which it procures productsand services, consistent with the Auditor-General’s guidelines on procurement.The company continued to be an active member of the New Zealand BusinessCouncil for-Sustainable Development.<strong>Watercare</strong>’s supplier selection and evaluation process has had the evaluationweighting for sustainability adjusted to both highlight and increase the focuson sustainability.The company maintains its focus on the use of sustainable resources but alsosupports the use of contractors who have demonstrated sustainability policies andpractices, including the management of waste streams. The code of conduct forsuppliers helps to stress the importance of <strong>Watercare</strong>’s sustainability guidelines forall of the company’s suppliers.The development and implementation of a code of ethics was postponed this yeardue to procurement resource limitations and work demands associated with thepreparation for integration of the Auckland water and wastewater industry.Continual Business ImprovementThe Project Improve programme continued to deliver benefits. Launched in 2002,the programme was developed as a framework for the identification, capture andsharing of improvement ideas. The concept of a structured programme has helpedto foster innovation and the development of an improvement culture within thecompany. Initiatives such as RCM, maintenance mobility via the use of informationtechnology, research programmes, and business intelligence reporting are just someexamples of initiatives that have been developed through the programme.A Continuous Improvement feedback system is used to recognise and celebrateimprovement ideas by <strong>Watercare</strong> staff. Among the ideas that received recognitionand cash rewards were a contractor tracking system (refer page 34), a trolley forsewer maintenance work and a value-excercising ratchet.Tikanga MaoriQuarterly meetings are held with the Maori Advisory Group to advise <strong>Watercare</strong>management on Tikanga Maori and other significant Maori issues that have thepotential to impact on the company’s projects and operations. <strong>Watercare</strong> alsocontinues to maintain relationships with local Maori in the region. The company iscurrently consulting with local Maori concerning the proposed Hunua No. 4 TrunkWatermain, various works relating to the volcanic cones, the Pakuranga WastewaterRising Main and activities associated with the Mangere Wastewater Treatment Plantand Puketutu Island.WeblinksStories:Digging into the pastFigures:Major suppliers and contractors Fig. 60Suppliers’ spend by industry and sector Fig. 61Objective 17 Achieve Continuous Improvement in Sustainable Business PerformanceA. Management systems (vnaidoo@water.co.nz) ISO 9001 and14001: TradewasteISO 17025:LaboratoryservicesISO 9001 and14001: Waterheadworks,treatment plantsand reticulationISO 9001and 14001:WastewaterreticulationISO 9001and 14001:Wastewatertreatment plantISO 9001 and14001: ProjectDelivery ManualACC tertiarylevel forworkplace safetymanagementAS/NZS 4801:2001 Healthand SafetyManagementSystemCompany-wideISO 14001certificationCompany-wideISO 9001certificationB. Sustainable management of external suppliers (mwray@water.co.nz) 0.5 0.5 0.5 0.5 0.5Develop a codeof conduct forsuppliersIntegrate codeof conductinto supplierselection processTrial assessmentcriteria withselected existingsuppliersAdoption ofsustainableprocurementpolicyStaff awarenesstrainingprogrammeAssess all existingtop and preferredsuppliersCode adopted bytop and preferredsuppliersReview supplierconformance tothe codeImplementinitiativesto improveconformanceProcurementpolicy recognisedas industry bestC. Continual business improvement (bevans@water.co.nz) 0.5 0.5 0.5 0.5First-generationprojectsidentified bystaffFormal projectgovernance inplaceStaff continuousimprovementfeedbackprocedures inplaceBusinessimprovementprogramme inoperationStaff rewardinitiatives inplaceFuture-generationprojects identifiedFirst-generationprojectsimplementedCompleted projectoutcomes showdemonstrablechanges in staffbehaviourResearch,developmentand innovationprogrammeinitiatedFuture-generationprojects initiatedD. Tikanga Maori (Maori Advisory Group assessment) (ashanks@water.co.nz) 0.5 0.5<strong>Watercare</strong> hassought Maoriopinion onpotential impacts ofoperations<strong>Watercare</strong>aims to avoid/minimise adverseimpacts on Maorivalues<strong>Watercare</strong>’sdecisionmakingreflectsconsideration ofMaori values<strong>Watercare</strong>’sadoptionof culturalprotocols forrelevant projects<strong>Watercare</strong>demonstrates aproactive approachto Maori issues<strong>Watercare</strong>recognisesthe traditionalconcept ofkaitiakitanga<strong>Watercare</strong> seekstangata whenuaguidance in activities<strong>Watercare</strong> seeksfeedback fromMaori on itsconsultativeprocessKey staff trained/exposed toMaori valuesMaori culturalinitiativesactioned/incorporatedTarget Target Target Target<strong>2010</strong>8/102006 2007 2008 20098 8 8 8<strong>2010</strong>7.5/102006 2007 2008 20090.5 2 5.5 7<strong>2010</strong>8/102006 2007 2008 20096 6.5 8 8<strong>2010</strong>9/102006 2007 2008 20098.5 8.5 8.5 8.5Impact on key areas:SocialEconomicEnvironmentalAchieve continuous improvement in sustainablebusiness performanceOverall performance scores out of 102006 2007 2008 20096 6.5 7.5 8<strong>2010</strong>854
WATERCARE SERVICES LIMITED <strong>ANNUAL</strong> <strong>REPORT</strong> <strong>2010</strong>Project Manager Mike Sheffield overlooks the dry well in the high-capacity pump station that was constructed in Orakei as part of Project Hobson.55
WATERCARE SERVICES LIMITED <strong>ANNUAL</strong> <strong>REPORT</strong> <strong>2010</strong>56
WATERCARE SERVICES LIMITED <strong>ANNUAL</strong> <strong>REPORT</strong> <strong>2010</strong>Policy 6Economic PerformanceTo Manage the Business Efficiently at Minimum Prices Management Accountant Avinesh Lata, Financial Controller Richard O’Connor, Chief Financial Officer Gary Swift and Treasury ManagerJason Isherwood discuss the funding plan.57
WATERCARE SERVICES LIMITED <strong>ANNUAL</strong> <strong>REPORT</strong> <strong>2010</strong>Policy 6Economic Performance<strong>Watercare</strong> is driven to manage its business efficiently and to deliver value-for-money water and wastewater services to its customers. The companyis required to operate, maintain, replace and develop assets over the long term to meet required delivery standards and foreseeable future needsat minimum cost. Savings continue to be made through strategic procurement practices and by actively pursuing cost-reduction opportunitiesacross the company, such as energy-saving initiatives actively promoted by <strong>Watercare</strong> staff.Policy 6Overallperformanceout of 10<strong>Watercare</strong> at work:Spring-clean for service reservoirsCase StudyOBJECTIVE 18887 880607Ensure that financial strategies areconsistent with achieving economicefficiency, inter-generational equityand optimal cost of capitalOBJECTIVE 190809 105.5068076.5 7.5086.509 10Ensure that the costs of providingservices are consistent with leadingpracticeKirk Hannaford from DiveCodiscusses the equipment used toclean out the Birkenhead Reservoirwith Water Quality and ContractsController Chris Watson and NetworkEngineer Ian Winson.Commercial divers gave the reservoirs that supply drinking water to Birkenhead and itssurrounding suburbs a thorough spring-clean in September 2009.Wearing weighted boots that enabled them to walk on the bottom of the reservoir, they useda vacuum hose to suck up sediment. This was only the third time <strong>Watercare</strong> had used the diversto clean company reservoirs. Since then, a further two have been cleaned using this method.Water Quality and Contracts Controller Chris Watson, who developed the new method with theOperations team, says it is more resource efficient than traditional methods and enables allreservoirs to be cleaned regularly.“In the past we were not able to clean some reservoirs because traditional cleaning methodstook too long,” says Chris. “We had to drain the water, hose, disinfect, refill and test thereservoirs: a process that took around two months.”The new method cuts down the cleaning time to around one week and results in significantlyless water loss. Chris says the divers wear dry-suits and helmets that allow them to work in fullreservoirs without compromising water quality.“All of their gear is reserved for this purpose and is meticulously disinfected before use,”he explains. “The reservoir is isolated while the divers carry out the cleaning. The water is thentested prior to it being returned to service.”The method was first trialled on the Redoubt Road North Reservoir in February 2009. Chris saysthey tested various suction heads and suction speeds to determine the most effective equipment.“The vacuum system selected minimises the amount of water sucked up with the sediment,” he says.The extracted water and sediment is treated on site using a mobile membrane plant. It separates outthe sediment and treats the water to an acceptable standard for discharge to the stormwater system.Chris says that the new method reduces the time and number of people required to clean eachreservoir and significantly lowers the risk of a water quality incident as all of the reservoirs cannow be cleaned on a regular basis.58
WATERCARE SERVICES LIMITED <strong>ANNUAL</strong> <strong>REPORT</strong> <strong>2010</strong>Contracts with CustomersCurrent contracts for the supply of bulk water and the collection, treatment anddisposal of wastewater have been in place since 1 July 2008.The bulk wastewater contracts have been extended until 31 October <strong>2010</strong> whenintegration will occur and the LNOs will no longer exist. At that time, <strong>Watercare</strong>will begin a new relationship with over 430,000 new customers across theAuckland region. The exception will be United Water which will continue to provideretail water and wastewater services to the Papakura area under an existingfranchise agreement. <strong>Watercare</strong> will negotiate a new wastewater contract withUnited Water and, when the water contract expires, a new water contract too.A contract will also be negotiated with the Waikato District Council, effective from1 November <strong>2010</strong>, for the provision of wastewater services to the townshipof Tuakau. Wastewater from Tuakau will be treated at Pukekohe.Savings Through Efficient Procurement<strong>Watercare</strong>’s improvement in strategic procurement continued, ensuring efficiencyand savings are maximised through the use of standardised equipment, by reducingsupply risks and conducting regular reviews. Good progress was made over the pastyear with the following reviews completed: midge control, cogenerator maintenance,electrical consumables, centrifuge maintenance, A4 paper, fire protection systems,treatment chemicals, smart purchasing, compressor maintenance, primarysedimentation tank maintenance and steel pipe supply. The reviews resulted insavings for the year of over $2.2 million, greater than the two per cent target.The strategic focus for the coming year will be on developing synergies followingthe integration of retail water and wastewater services.Funds from Operations to Interest RatioThe funds from operations (FFO) to interest cover was 2.93 times for the year ending30 June <strong>2010</strong>, higher than the required target of 2.50 times. The higher-than-targetedFFO reflects the lower interest costs than budget due to lower debt. This situationis the result of lower capital expenditure than budgeted and the savings achievedin operating costs as well as lower average interest rates than budgeted. The higherachievement will be taken into account when setting prices in subsequent years.Objective 18 Ensure that Financial Strategies are Consistent with Achieving EconomicEfficiency, Inter-Generational Equity and Optimal Cost of CapitalA. Contracts with customers (bevans@water.co.nz) 0.5 No contracts inplace or beingnegotiatedContracts expirewithin 12 monthsand no plans tore-establishContracts expirewithin 12 monthsand beingrenegotiatedOne-yearcontractsnegotiatedThree-yearcontractsnegotiatedFive-yearcontractsnegotiated10-year contractsnegotiatedContractshave pricingestablished on arolling three-yearbasisContractshave pricingestablished on arolling five-yearbasisContractshave pricingestablished on arolling 10-yearbasisB. Funds from operations to interest ratio (jisherwood@water.co.nz)Ratio 2.05 2.10 2.15 2.20 2.25 2.30 2.35 2.40 2.45 2.50C. Savings through efficient procurement* (mwray@water.co.nz) 0.5Establish spendcategories forbenchmarkingand reporting*Against budgetDevelop andimplement acategory reviewplanDevelopprocurementsystems formarket reviewImplement processfor reviewingand monitoringpreferred suppliersAchieve savingsof 0.5% ofoperatingexpenditureAdopt aprocurementpolicy for useof preferredsuppliersAchievesavings of 1%of operatingexpenditureAchieve savingsof 1.5% ofoperatingexpenditureAchievesavings of 2%of operatingexpenditureRecognisetop-performingsuppliersTarget TargetTarget<strong>2010</strong>5.5/102006 2007 2008 20095 5 5 5.5<strong>2010</strong>10/102006 2007 2008 200910 10 4 10<strong>2010</strong>9.5/102006 2007 2008 20094.5 5.5 6.5 9Impact on key areas:SocialEconomicEnvironmentalEnsure that financial strategies are consistent with achieving economicefficiency, inter-generational equity and optimal cost of capitalOverall performance scores out of 102006 2007 2008 20098 8 7 8<strong>2010</strong>859
WATERCARE SERVICES LIMITED <strong>ANNUAL</strong> <strong>REPORT</strong> <strong>2010</strong>Interest CostThe company underperformed relative to its interest cost benchmark. The actualweighted average interest rate for the year excluding credit margins and fees was6.06 per cent, versus the benchmark rate of 5.04 per cent. The lower benchmarkreflects the impact of lower 90-day bank bill rates, which comprise 35 per centof the benchmark. <strong>Watercare</strong>’s exposure to lower floating rates has reduced dueto higher levels of fixed rate cover. Despite this, interest costs were lower thanbudgeted due to lower debt levels; the result of lower than budgeted capitalexpenditure as well as lower interest rates than budgeted.Performance of Actual Operating Expenditureagainst Budget TargetsOperating costs, excluding interest and depreciation, were $4.07 million (4.4per cent) lower than budget. Savings were largely achieved in asset operations,particularly in lower than projected chemical use, and also in professional servicesdue to the business’ focus on integration.Plant Operator Nigel Prentice opens an isolation valve at the Mangere Wastewater TreatmentPlant using a valve-exercising ratchet designed by him and Shift Engineers John Sutherlandand Allan Julian. Their tool makes the opening and closing of these valves easy, whereasit used to take time and muscle power. The innovation was recognised with a ContinuousImprovement Award.WeblinksFigures:Revenue by customer Fig. 62<strong>Watercare</strong> wholesale price and water retailers’ average domestic priceFig. 63Financial implications of climate change Fig. 64Interest rate performance Fig. 65Capital expenditure projections vs actual 2008/09 Fig. 66Capital expenditure projections vs actual 2007/08 Fig. 67Objective 19 Ensure that the Costs of Providing Services are Consistent with Leading PracticeA. Interest cost (jisherwood@water.co.nz)% 6.7% 6.5% 6.3% 6.1% 5.9% 5.7% 5.5% 5.3% 5.1% 4.9%Target<strong>2010</strong>4/10TREASURY BENCHMARKB. Performance of actual operating expenditure against budget targets (ro’connor@water.co.nz)% movement against budget 0.54% 3% 2% 1% 0% -1% -2% -3% -4% -5%Target2006 2007 2008 20098 7.5 5.5 7.5<strong>2010</strong>9.5/102006 2007 2008 20092.5 8.5 7.5 7.5Impact on key areas:SocialEconomicEnvironmentalEnsure that the costs of providing servicesare consistent with leading practiceOverall performance scores out of 102006 2007 2008 20095.5 8 6.5 7.5<strong>2010</strong>6.560
WATERCARE SERVICES LIMITED <strong>ANNUAL</strong> <strong>REPORT</strong> <strong>2010</strong>FINANCIAL <strong>REPORT</strong>For the year ended 30 June <strong>2010</strong>Aerial view of the Mangere Wastewater Treatment Plant.ContentsHistorical financial summaryand key statistics 62Financial commentary 63Responsibility for the financialstatements and statementof service performance 68Report of the Auditor-General 69FINANCIAL STATEMENTSSegment comprehensive income 70Statement of comprehensive income 71Statement of changes in equity 71Segment financial position 72Segment statement of cash flows 72Statement of financial position 73Statement of cash flows 74Statement of accounting policies 75NOTES TO THEFINANCIAL STATEMENTS1. Revenue 812. Price adjustment 813. Operating expenses 814. Depreciation and amortisation 825. Finance costs 826. Revaluation of derivativefinancial instruments 827. Tax 828. Property, plant and equipment 839. Intangibles 8710. Inventories 8711. Trade and other receivables 8712. Borrowings 8813. Deferred tax liability 8914. Trade and other payables 9015. Provisions 9016. Accrued expenses 9017. Capital 9118. Revaluation reserves 9119. Retained earnings 9320. Cash flows 9321. Commitments 9422. Contingencies 9423. Financial assets and liabilities 9524. Related parties 10025. Remuneration 10126. Retirement benefit plans 10227. Events occuring after year-end 102STATEMENT OF SERVICEPERFORMANCEEconomic policy 103Environmental policy 105Social policy 106G3 cross-reference table 109IndexIBCGlossaryIBC61
WATERCARE SERVICES LIMITED <strong>ANNUAL</strong> <strong>REPORT</strong> <strong>2010</strong>Historical Financial Summary and Key Statisticsas at 30 June <strong>2010</strong>2001 2002 2003 2004 2005* 2006 2007 2008 2009 <strong>2010</strong>$000 $000 $000 $000 $000 $000 $000 $000 $000 $00062FINANCIAL PERFORMANCEOperating revenue 156,978 160,397 163,627 165,240 166,628 167,899 168,983 167,345 184,629 198,116Price adjustment - - - (15,711) (10,000) - - - - -Operating expenses 95,120 109,197 137,628 133,470 137,713 144,070 159,196 165,763 170,427 189,002Operating surplus/(deficit) before: 61,858 51,200 25,999 16,059 18,915 23,829 9,787 1,582 14,202 9,114Gain/(Loss) on disposal and provision forredundant property, plant and equipmentand other restructuring costs (11,792) - (3,287) (3,102) (3,254) (1,026) (7,719) (4,793) (11,589) (6,140)Contributions towards cost of constructingproperty, plant and equipment 610 3,790 1,428 259 1,111Revaluation of derivative financial instruments - - - - (2,673) 2,561 3,021 (3,222) (16,599) (20,483)Decommissioning of oxidation ponds (4,623) (5,442) (2,770) - - - - - - -Operating surplus/(deficit) before tax 45,443 45,758 19,942 12,957 12,988 25,974 8,879 (5,005) (13,727) (16,398)Current tax 3,766 4,814 1,611 2,478 (25) 2,079 (28) -Deferred tax 17,443 14,540 10,516 8,508 4,303 7,909 3,639 (2,208) (3,363) 11,311Net surplus/(deficit) after tax 24,234 26,404 7,815 1,971 8,710 15,986 5,268 (2,797) (10,364) (27,709)FINANCIAL POSITIONNon-current assetsProperty, plant and equipment 1,266,663 1,338,191 1,569,273 1,571,546 1,585,453 1,959,687 1,977,280 2,025,034 2,357,369 2,413,113Intangibles** 13,539 18,429 18,844 16,375 14,374Investments 13,674 12,574 14,425 15,714 17,456 - - - - -Other financial assets - - - - - - - 5,579 12,220 5,284Inventory 1,386 1,877 2,022 1,921 1,821 2,378 2,797 2,640 2,599 3,237Future tax benefit - - - - - - - - - -1,281,723 1,352,642 1,585,720 1,589,181 1,604,730 1,975,604 1,998,506 2,052,097 2,388,563 2,436,008Current assets 18,179 15,930 18,823 19,823 18,121 33,535 35,491 19,414 114,101 34,782Total assets 1,299,902 1,368,572 1,604,543 1,609,004 1,622,851 2,009,139 2,033,997 2,071,511 2,502,664 2,470,790Non-current liabilitiesBorrowings 129,000 229,000 229,000 129,000 200,000 200,000 200,000 200,000 350,000 416,500Deferred tax 6,111 20,651 31,167 39,675 256,090 377,656 347,502 342,348 420,666 402,049Financial liabilities - - - - - - - 4,460 27,725 40,298Payables, provisions and accruals 30,665 21,313 10,864 9,420 972 926 1,194 880 966 1,053165,776 270,964 271,031 178,095 457,062 578,582 548,696 547,688 799,357 859,900Current liabilitiesBank overdraft 227 115 - 458 44 148 132 111 - 446Borrowings 187,869 143,894 130,293 241,954 175,713 161,505 174,174 207,349 204,560 109,225Payables, provisions, accruals andfinancial liabilities 51,772 32,937 29,590 25,835 29,760 23,149 26,179 41,219 47,796 48,606239,868 176,946 159,883 268,247 205,517 184,802 200,485 248,679 252,356 158,277Total liabilities 405,644 447,910 430,914 446,342 662,579 763,384 749,181 796,367 1,051,713 1,018,177EquityCapital 260,693 260,693 260,693 260,693 260,693 260,693 260,693 260,693 260,693 260,693Revaluation reserves 629,608 629,449 863,754 848,488 575,826 843,712 873,086 862,745 1,043,205 1,071,655Retained earnings 3,957 30,520 49,182 53,481 123,753 141,350 151,037 151,706 147,053 120,265Total equity 894,258 920,662 1,173,629 1,162,662 960,272 1,245,755 1,284,816 1,275,144 1,450,951 1,452,613Total funds employed 1,299,902 1,368,572 1,604,543 1,609,004 1,622,851 2,009,139 2,033,997 2,071,511 2,502,664 2,470,790CASH FLOW SUMMARYNet cash flows - operations 51,241 65,837 60,131 54,669 65,627 66,777 70,370 59,208 81.297 87,118Net cash flows - investing (151,810) (121,750) (46,349) (66,854) (69,972) (52,673) (83,023) (92,362) (138,387) (138,739)Net cash flows - financing 100,457 56,025 (13,601) 11,661 4,759 (14,208) 12,669 33,175 57,411 50,965Net change in cash flows (112) 112 181 (524) 414 (104) 16 21 321 (656)Bank/(overdraft) at start of year (115) (227) (115) 66 (458) (44) (148) (132) (111) 210Bank/(overdraft) at end of year (227) (115) 66 (458) (44) (148) (132) (111) 210 (446)KEY STATISTICSDebt to capitalisation (book value) 25% 28% 23% 23% 27% 22% 23% 24% 28% 27%Debt to capitalisation (historical cost) 53% 55% 53% 53% 48% 47% 48% 50% 58% 58%Funds flow from operations to interest ratio 5.6 4.1 3.9 3.6 3.5 3.7 3.6 2.9 2.9 2.9EBITDA total interest ratio 5.8 4.3 4.0 3.7 3.5 3.7 3.6 2.9 2.9 2.9EBITDA interest expense ratio 15.7 7.9 4.2 3.9 3.8 3.8 3.7 3.4 3.9 3.5Total liabilities to total assets 31% 33% 27% 28% 41% 38% 37% 38% 42% 41%Secured liabilities to total assets 2% 2% 2% 2% 2% 0% 0% 0% 0% 0%Return on average equity 2.7% 2.9% 0.8% 0.2% 0.8% 1.5% 0.4% (0.2%) (0.8%) (2.0%)Economic value added/(deducted) ($000) (54,342) (75,395) (75,237) (109,876) (93,980) (99,499) (123,577) (130,737) (128,769) (134,659)Capital expenditure ($000) 167,393 118,080 42,810 66,209 70,651 64,489 86,416 120,174 129,860 123,324Number of employees 355 355 352 335 329 343 363 363 381 387*The company adopted NZ IFRS with effect from 1 July 2005 and has restated the comparative information for the year ended 30 June 2005 in accordance with NZ IFRS.**Intangibles have been disclosed separately from the June 2006 financial year onwards.
Financial CommentaryFOR THE YEAR ENDED 30 June <strong>2010</strong>WATERCARE SERVICES LIMITED <strong>ANNUAL</strong> <strong>REPORT</strong> <strong>2010</strong>The financial result for the year was a net deficit after tax of $27.7 million, compared with a budgeted net surplus of $0.17 million (2009 – Net deficitafter tax of $10.4 million). The deficit was primarily due to the revaluation of the company’s interest rate swap contracts to market value and the changein deferred tax due to the reduction of the tax depreciation rates to zero on buildings with useful lives greater than 50 years.Key PointsÌÌ On 1 November <strong>2010</strong> the company will acquire the water and wastewater businesses conducted by Metrowater Limited, Manukau Water Limited,North Shore City Council, Waitakere City Council, Rodney District Council and Franklin District Council in accordance with the Local Government(Tamaki Makaurau Reorganisation) Act 2009, the Local Government (Auckland Council) Act 2009 and the Local Government (Auckland Law Reform)Act <strong>2010</strong>. The company will provide total water and wastewater services to the Auckland region from that date and as a result, the assets, liabilities,revenues and costs of the company will increase significantly.ÌÌ The company’s Standard & Poor’s corporate credit ratings remained unchanged at A– long-term and A–2 short-term. However the company’s longtermdebt rating was lowered during the year from AA to AA-, a similar reduction to that of Auckland City’s due to the upcoming amalgamationof the existing councils in Auckland.ÌÌ No price adjustment was paid in the <strong>2010</strong> year (2009 - $nil).ÌÌ Under NZ IFRS, the company has chosen to revalue its interest rate and foreign exchange currency hedging contracts to fair value. These resultedin a decrease in current year operating surplus from trading operations by $20.5 million (2009 - decrease in operating surplus from tradingoperations by $16.6 million).ÌÌ Replacement revolving credit and commercial paper standby facilities were established with the BNZ in December 2009. The $25 million revolvingcredit facility and $150 million commercial paper standby facility are both due to mature in December 2011.ÌÌ A $50 million medium-term note issue was completed in December 2009, with ANZ acting as the lead manager. The new medium-term notes werefor a term of 5 years, and the proceeds were used to fund capital expenditure.ÌÌ Operating costs were 4.4% lower than budget due to savings in asset operating costs and overheads.ÌÌ The deferred taxation liability has been adjusted to reflect the budget change reducing the corporate tax rate from 30% to 28% and the reductionof the tax depreciation rates to zero on buildings with useful lives greater than 50 years.ÌÌ This financial commentary includes the budget for the <strong>2010</strong> year and notes on significant variances.Statement of Comprehensive IncomeFOR THE YEAR ENDED 30 JUNE <strong>2010</strong><strong>2010</strong> <strong>2010</strong> <strong>2010</strong> 2009Actual Budget Variance to Budget Actual$000 $000 % $000Net (deficit)/surplus after tax (27,709) 169 N/A (10,364)Other comprehensive income, net of tax 29,371 - 100.0% 186,171Total comprehensive income for the year, net of tax 1,662 169 883.4% 175,807The statement of comprehensive Income also includes other comprehensive income of $29.3 million as a result of the change in deferred tax dueto the reduction in the corporate tax rate from 30% to 28%.Total comprehensive income for the year of $1.67 million after tax, compared with budgeted comprehensive income of $0.17 million after tax,represents a favourable variance of $1.50 million.Other material variances include the negative revaluation of financial instruments of $20.5 million and depreciation of $0.9 million. The unfavourablevariances were partially offset by favourable variances in operating costs of $4.0 million and loss on disposal and restructuring costs associated withthe acquisition of the retail water and wastewater businesses in the Auckland region of $5.4 million.The 2009 comprehensive income included $194.4 million, representing the impact of the triennial revaluation of property, plant and equipmentto fair value.<strong>2010</strong> <strong>2010</strong> <strong>2010</strong> 2009Actual Budget Variance to Budget Actual$000 $000 % $000RevenueWater 71,962 71,767 0.3% 65,335Wastewater 106,922 106,922 - 100,870Trade waste 11,763 11,584 1.5% 11,667Other 7,469 7,111 5.0% 6,757Operating revenue 198,116 197,384 0.4% 184,62963
WATERCARE SERVICES LIMITED <strong>ANNUAL</strong> <strong>REPORT</strong> <strong>2010</strong>Financial Commentary continuedWater revenue was $71.96 million for the year, 0.3% higher than the budget of $71.77 million due to slightly increased water sales volumes.The increase in water revenue from the prior year by 10.1% was due to the increase in price.Wastewater revenue was $106.9 million for the year, in line with the budget. The increase over 2009 revenue of $100.87 million was due to theincrease in price.Trade waste revenue was $11.7 million for the year and was higher than the budget by 1.5% due to increased production for some customers.Other revenue was $7.47 million for the year and was 5.0% above budget due to interest on a higher level of funds invested than budgeted and highermiscellaneous revenue.<strong>2010</strong> <strong>2010</strong> <strong>2010</strong> 2009Actual Budget Variance to Budget Actual$000 $000 % $000Price adjustmentWater - - - -Wastewater - - - -Trade waste - - - -- - - -Price adjustments are unbudgeted discretionary payments. The directors determine the amount, and the distribution between customer groups,after having regard to the financial position of the company and future expenditure requirements. The directors decided that no price adjustmentwould be made for <strong>2010</strong> (2009 – $nil).<strong>2010</strong> <strong>2010</strong> <strong>2010</strong> 2009Actual Budget Variance to Budget Actual$000 $000 % $000Operating expensesWaterAsset operating costs 13,019 12,992 (0.2%) 10,821Maintenance 7,660 6,583 (16.4%) 7,638Other expenses 17,628 19,875 11.3% 17,95338,307 39,450 2.9% 36,412WastewaterAsset operating costs 22,467 24,436 8.1% 21,958Maintenance 11,615 11,911 2.5% 14,051Other expenses 16,345 16,999 3.8% 15,05850,427 53,346 5.5% 51,067TotalAsset operating costs 35,486 37,428 5.2% 32,779Maintenance 19,275 18,494 (4.2%) 21,689Other expenses 33,973 36,874 7.9% 33,01188,734 92,796 4.4% 87,479Asset operating costs for the year were 5.2% below budget. The main driver for the favourable variance was as a result of savings in chemical costs dueto lower prices and dose rate optimisation at the treatment plants. Additionally energy costs were lower than budget due to the delayed commissioningof pump station 64 (Project Hobson). Savings in other asset costs were due to biosolids production volume being down and the budgeted costs for otherprojects being deferred due to the focus on planning for the integration with the region’s retail water businesses.Maintenance costs were 4.2% higher than budget. The unfavourable variance was primarily due to equipment overhauls at the wastewater treatmentplant and equipment failures at Waitakere, Waikato and Huia. The unfavourable variance also includes the cost of pipeline breaks at Church Streetand Boston Road and watermain failures due to damage caused by external contractors and electrical instrumentation and mechanical faults atpump stations.Other expenses for the year were 7.9% lower than budget primarily due to the professional services focus on integration and ERP systems projectsmeaning business as usual programmes were delayed. Other main areas of savings include lower recruitment costs and reduced travel, trainingand advertising due to the increased focus on cost control. Additionally environmental policy work is being conducted in-house rather than usingexternal consultants.64
Financial Commentary continuedWATERCARE SERVICES LIMITED <strong>ANNUAL</strong> <strong>REPORT</strong> <strong>2010</strong><strong>2010</strong> <strong>2010</strong> <strong>2010</strong> 2009Actual Budget Variance to Budget Actual$000 $000 % $000DepreciationWater 34,680 32,735 (5.9%) 30,608Wastewater 34,075 35,105 2.9% 27,27368,755 67,840 (1.3%) 57,881Depreciation for <strong>2010</strong> was 1.3% over budget primarily due to the loading of demolition cost estimates against the respective assets and acceleratingthe life of the asset to the date of the demolition completion date. The assets to be demolished include the Khyber 2 Reservoir, New Lynn Outfall tank,McLaughlins Mountain Reservoir and Ardmore Pumps. Previously demolition costs had been expensed within the period they were incurred.<strong>2010</strong> <strong>2010</strong> <strong>2010</strong> 2009Actual Budget Variance to Budget Actual$000 $000 % $000Finance costsWaterPaid and payable 10,846 10,629 (2.0%) 7,654Capitalised on asset construction (1,060) (3,271) 67.6% (940)9,786 7,358 (33.0%) 6,714WastewaterPaid and payable 26,502 29,446 10.0% 25,346Capitalised on asset construction (4,775) (5,224) 8.6% (6,993)21,727 24,222 10.3% 18,353TotalPaid and payable 37,348 40,075 6.8% 33,000Capitalised on asset construction (5,835) (8,495) 31.3% (7,933)31,513 31,580 0.2% 25,067Total finance costs of $31.5 million were 0.2% below budget. The lower interest costs were due to lower interest rates and lower debt due to lower capitalexpenditure than budgeted. This was partially offset by the amount of interest capitalised to assets under construction being lower than budget by$2.7 million.<strong>2010</strong> <strong>2010</strong> <strong>2010</strong> 2009Actual Budget Variance to Budget Actual$000 $000 % $000TaxCurrent tax - - - -Deferred tax 11,311 72 N/A (3,363)11,311 72 N/A (3,363)The deferred tax balance reflects the change in deferred tax due to the reduction of the tax depreciation rates to zero on buildings with useful livesgreater than 50 years. No tax was payable on the trading result for the year.<strong>2010</strong> <strong>2010</strong> <strong>2010</strong> 2009Actual Budget Variance to Budget Actual$000 $000 % $000Other comprehensive incomeGain on revaluation and impairment of property, plant and equipment and adjustments (557) - - 267,852Income tax relating to comprehensive income 29,928 - - (81,681)29,371 - - 186,171Other comprehensive income reflects the change in deferred tax due to the reduction in the corporate tax rate from 30% to 28%.65
WATERCARE SERVICES LIMITED <strong>ANNUAL</strong> <strong>REPORT</strong> <strong>2010</strong>Financial Commentary continuedStatement of Financial PositionAS AT 30 JUNE <strong>2010</strong>The company is in a strong financial position with net equity of $1,453 million at year-end. The net equity increased by $1.6 million from 30 June 2009.<strong>2010</strong> <strong>2010</strong> <strong>2010</strong> 2009Actual Budget Variance to Budget Actual$000 $000 % $000Propert y, pl ant and equipmentWater 1,366,844 1,376,049 (0.7%) 1,330,249Wastewater 1,046,269 1,059,139 (1.2%) 1,027,1202,413,113 2,435,188 (0.9%) 2,357,369The analysis by business group for the movements in property, plant and equipment for <strong>2010</strong> is:Water Wastewater Total$000 $000 $000Net additions 66,403 55,142 121,545Asset revaluation (before tax) - - -Impairment - (557) (557)Depreciation (32,925) (32,319) (65,244)33,478 22,266 55,744The increase for property, plant and equipment during the year was a result of the normal capital expenditure programme. Significant capitalexpenditure projects in the year included work on the new Hobson Bay sewer tunnel and pump station and work on the new Hunua Number 4trunk watermain.<strong>2010</strong> <strong>2010</strong> <strong>2010</strong> 2009Actual Budget Variance to Budget Actual$000 $000 % $000Intangible AssetsWater 6,552 8,319 (21.2%) 7,703Wastewater 7,822 9,381 (16.6%) 8,67214,374 17,700 (18.8%) 16,375The decrease in intangible assets during the year is due to the effect of amortisation.<strong>2010</strong> <strong>2010</strong> 2009Actual Budget Variance to Budget ActualBorrowings$000 $000 % $000525,725 546,017 3.7% 554,560Borrowings at year-end were 3.7% lower than budget, primarily due to lower than budgeted capital expenditure. Borrowings include commercial paperof $99.2 million, $16.5 million drawn under a revolving credit facility, a related party loan of $10 million, medium-term notes of $300 million anda bank loan of $100 million.<strong>2010</strong> <strong>2010</strong> <strong>2010</strong> 2009Actual Budget Variance to Budget ActualDeferRed tax liability$000 $000 % $000402,049 424,138 (5.2%) 420,666The deferred tax liability primarily comprises temporary differences between the revalued property, plant and equipment and the values recognised fortax purposes plus differences in the company’s depreciation rates and those permitted by the Inland Revenue Department. At 30 June <strong>2010</strong>, deferredtaxation was lower than budget, principally due to the budget change reducing the corporate tax rate from 30% to 28%.66
Financial Commentary continuedWATERCARE SERVICES LIMITED <strong>ANNUAL</strong> <strong>REPORT</strong> <strong>2010</strong>Statement of Cash FlowsFOR THE YEAR ENDED 30 JUNE <strong>2010</strong>The Local Government Act 1974 precludes the company from paying a dividend. As such, all of the company’s cash flow from operations is availablefor either capital expenditure or debt repayment. Borrowings increase as a result of any shortfall between operating cash flows and capital expenditure.<strong>2010</strong> <strong>2010</strong> <strong>2010</strong> 2009Actual Budget Variance to Budget ActualNet cash flows from operating activities$000 $000 % $00087,118 81,262 7.2% 81,297Net operating cash flows at $87.1 million were 7.2% higher than budget for <strong>2010</strong>, predominantly due to lower operating costs.<strong>2010</strong> <strong>2010</strong> <strong>2010</strong> 2009Actual Budget Variance to Budget ActualNet cash flows from investing activities$000 $000 % $000(138,739) (158,928) 12.7% (138,387)The net cash flow from investing activities was 12.7% lower than budget due to delays in some capital expenditure projects.<strong>2010</strong> <strong>2010</strong> <strong>2010</strong> 2009Actual Budget Variance to Budget ActualNet cash flows from financing activities$000 $000 % $00050,965 77,666 (34.4%) 57,411The net cash flow from financing activities shows a net increase in borrowings in <strong>2010</strong> from the prior year. The increase in debt resulted from the higherlevel of capital expenditure relative to the operating cash flows.The audited financial statements are set out on pages 70 to 102.67
WATERCARE SERVICES LIMITED <strong>ANNUAL</strong> <strong>REPORT</strong> <strong>2010</strong>Responsibility for the Financial Statementsand Statement of Service PerformanceFinancial StatementsWe have ensured that the financial statements fairly reflect the financial position of the company as at 30 June <strong>2010</strong> and its financial performanceand cash flows for the year ended on that date.We have ensured that the accounting policies used by the company accord with New Zealand Equivalents to International Financial Reporting Standards.This includes the early adoption of accounting standards issued by the New Zealand Institute of Chartered Accountants, to the extent that they do notconflict with an existing accounting standard and the information is available.We believe proper accounting records have been kept enabling the financial position of the company to be determined and that the financial statementsfully comply with the Financial Reporting Act 1993.We consider adequate steps have been taken to safeguard the assets of the company and to prevent and detect fraud and other irregularities.Statement of Service PerformanceWe are responsible for establishing a Statement of Corporate Intent, which sets targets and other measures by which the company’s performancecan be judged in relation to its objectives.We consider the results reported in the statement of service performance fairly reflect the achievements for the year ended 30 June <strong>2010</strong>.We have pleasure in presenting the financial statements and the statement of service performance for <strong>Watercare</strong> Services Limited for the year ended30 June <strong>2010</strong>, which were approved and authorised for release on 17 September <strong>2010</strong>.For and on behalf of management:I M PartonTransition Chief Executiveg W SwiftChief Financial OfficerFor and on behalf of the Board:G S HawkinsChairmanr B KeenanDeputy ChairmanD J Clarke P S Drummond S M HuriaDirector Director DirectorP N SneddenDirectorJ G ToddDirector68
Audit ReportWATERCARE SERVICES LIMITED <strong>ANNUAL</strong> <strong>REPORT</strong> <strong>2010</strong>TO THE READERS OF WATERCARE SERVICES LIMITED’S FINANCIAL STATEMENTS AND PERFORMANCE INFORMATIONFOR THE YEAR ENDED 30 JUNE <strong>2010</strong>The Auditor-General is the auditor of <strong>Watercare</strong> Services Limited (thecompany). The Auditor-General has appointed me, Jamie Schmidt, usingthe staff and resources of Deloitte, to carry out the audit of the financialstatements and performance information of the company, on her behalf,for the year ended 30 June <strong>2010</strong>.Unqualified opinionIn our opinion:ÌÌ The financial statements of the company on pages 70 to 102:– comply with generally accepted accounting practice in New Zealand;– give a true and fair view of:– the company’s financial position as at 30 June <strong>2010</strong>; and– the results of its operations and cash flows for the year endedon that date.ÌÌ The performance information of the company on pages 103 to 108gives a true and fair view of the achievements measured against theperformance targets adopted for the year ended 30 June <strong>2010</strong>.ÌÌ Based on our examination the company kept properaccounting records.The audit was completed on 17 September <strong>2010</strong>, and is the date at whichour opinion is expressed. The basis of our opinion is explained below. Wealso outline the responsibilities of the Board of Directors and the Auditor,and explain our independence.Basis of OpinionWe carried out the audit in accordance with the Auditor-General’s AuditingStandards, which incorporate the New Zealand Auditing Standards.We planned and performed the audit to obtain all the information andexplanations we considered necessary in order to obtain reasonableassurance that the financial statements and performance informationdid not have material misstatements, whether caused by fraud or error.Material misstatements are differences or omissions of amounts anddisclosures that would affect a reader’s overall understanding of thefinancial statements and performance information. If we had foundmaterial misstatements that were not corrected, we would have referredto them in our opinion.The audit involved performing procedures to test the informationpresented in the financial statements and performance information.We assessed the results of those procedures in forming our opinion.Audit procedures generally include:ÌÌ determining whether significant financial and management controls areworking and can be relied on to produce complete and accurate data;ÌÌ verifying samples of transactions and account balances;ÌÌ performing analyses to identify anomalies in the reported data;ÌÌ reviewing significant estimates and judgements made by the Boardof Directors;ÌÌ confirming year-end balances;ÌÌ determining whether accounting policies are appropriate andconsistently applied; andÌÌ determining whether all required disclosures are adequate.We did not examine every transaction, nor do we guarantee completeaccuracy of the financial statements and performance information.We evaluated the overall adequacy of the presentation of informationin the financial statements and performance information. We obtained allthe information and explanations we required to support our opinion above.Responsibilities of the Board of Directors and the AuditorThe Board of Directors is responsible for preparing the financialstatements in accordance with generally accepted accounting practicein New Zealand. The financial statements must give a true and fair viewof the financial position of the company as at 30 June <strong>2010</strong> and theresults of its operations and cash flows for the year ended on that date.The Board of Directors is also responsible for preparing performanceinformation that gives a true and fair view of service performanceachievements for the year ended 30 June <strong>2010</strong>. The Board of Directors’responsibilities arise from the Financial Reporting Act 1993 and the LocalGovernment Act 1974.We are responsible for expressing an independent opinion on the financialstatements and performance information and reporting that opinion to you.This responsibility arises from section 15 of the Public Audit Act 2001.IndependenceWhen carrying out the audit we followed the independence requirements ofthe Auditor-General, which incorporate the independence requirements of theNew Zealand Institute of Chartered Accountants. Other than the audit and ITassurance and control work, which are compatible with those independentrequirements, we have no relationship with or interests in the company.Jamie SchmidtDeloitteOn behalf of the Auditor-GeneralAuckland, New Zealand69
WATERCARE SERVICES LIMITED <strong>ANNUAL</strong> <strong>REPORT</strong> <strong>2010</strong>Segment Comprehensive IncomeFOR THE YEAR ENDED 30 JUNE <strong>2010</strong>Water Wastewater Total<strong>2010</strong> 2009 <strong>2010</strong> 2009 <strong>2010</strong> 2009$000 $000 $000 $000 $000 $000RevenueBulk water and wastewater 71,962 65,335 106,922 100,870 178,884 166,205Trade waste - - 11,763 11,667 11,763 11,667Interest income 384 284 384 285 768 569Other 3,333 3,044 3,368 3,144 6,701 6,188Operating revenue 75,679 68,663 122,437 115,966 198,116 184,629less Price adjustment - - - - - -Total revenue 75,679 68,663 122,437 115,966 198,116 184,629less Operating ExpensesAsset operating costs 13,019 10,821 22,467 21,958 35,486 32,779Maintenance costs 7,660 7,638 11,615 14,051 19,275 21,689Employee benefit expenses 7,352 7,658 7,283 6,423 14,635 14,081Other expenses 10,276 10,295 9,062 8,635 19,338 18,930Total operating expenses 38,307 36,412 50,427 51,067 88,734 87,479Depreciation and amortisation 34,680 30,608 34,075 27,273 68,755 57,881Finance costs 9,786 6,714 21,727 18,353 31,513 25,067Total expenses 82,773 73,734 106,229 96,693 189,002 170,427Operating surplus (deficit) from trading operations (7,094) (5,071) 16,208 19,273 9,114 14,202Gain/(Loss) on disposal and provision for redundantproperty, plant and equipment and other restructuring costs (4,100) (860) (2,040) (10,729) (6,140) (11,589)Contributions towards cost of constructingproperty, plant and equipment 275 259 836 - 1,111 259Revaluation of derivative financial instruments (6,805) (4,980) (13,678) (11,619) (20,483) (16,599)Operating surplus (deficit) before tax (17,724) (10,652) 1,326 (3,075) (16,398) (13,727)less TAXCurrent tax - - - - - -Deferred tax 3,362 (3,196) 7,949 (167) 11,311 (3,363)Tax expense (credit) 3,362 (3,196) 7,949 (167) 11,311 (3,363)Net deficit after tax (21,086) (7,456) (6,623) (2,908) (27,709) (10,364)Other comprehensive incomeGain on revaluation and impairment of property,plant and equipment and adjustments - 144,229 (557) 123,623 (557) 267,852Income tax relating to comprehensive income 18,633 (45,424) 11,295 (36,257) 29,928 (81,681)Total comprehensive income (deficit) for the year, net of tax (2,453) 91,349 4,115 84,458 1,662 175,807The financial statements should be read in conjunction with the accounting policies and notes on pages 75 to 102.70
Statement of Comprehensive IncomeFOR THE YEAR ENDED 30 JUNE <strong>2010</strong>WATERCARE SERVICES LIMITED <strong>ANNUAL</strong> <strong>REPORT</strong> <strong>2010</strong><strong>2010</strong> 2009Notes $000 $000RevenueRevenue Note 1, page 81 198,116 184,629less Price adjustment Note 2, page 81 - -Total revenue 198,116 184,629less Operating expensesAsset operating costs 35,486 32,779Maintenance costs 19,275 21,689Employee benefit expenses 14,635 14,081Other expenses 19,338 18,930Total operating expenses Note 3, page 81 88,734 87,479Depreciation and amortisation Note 4, page 82 68,755 57,881Finance costs Note 5, page 82 31,513 25,067Total expenses 189,002 170,427Operating surplus from trading operations 9,114 14,202Gain/(Loss) on disposal and provision for redundant property, plant and equipment and other restructuring costs (6,140) (11,589)Contributions towards cost of constructing property, plant and equipment 1,111 259Revaluation of derivative financial instruments Note 6, page 82 (20,483) (16,599)Operating deficit before tax (16,398) (13,727)less TaxCurrent tax Note 7, page 82 - -Deferred tax Note 7, page 82 11,311 (3,363)Tax expense (credit) 11,311 (3,363)Net deficit for the year attributable to equity holders (27,709) (10,364)Other Comprehensive IncomeGain on revaluation and impairment of property, plant and equipment and adjustments (557) 267,852Income tax relating to other comprehensive income 29,928 (81,681)Total comprehensive income for the year, net of tax attributable to equity holders 1,662 175,807Statement of Changes in EquityFOR THE YEAR ENDED 30 JUNE <strong>2010</strong>Issued and paid-up capital Asset revaluation reserve Retained earnings Total<strong>2010</strong> 2009 <strong>2010</strong> 2009 <strong>2010</strong> 2009 <strong>2010</strong> 2009Notes $000 $000 $000 $000 $000 $000 $000 $000Balance at 1 July 260,693 260,693 1,043,205 862,745 147,053 151,706 1,450,951 1,275,144Net deficit for the year - - - - (27,709) (10,364) (27,709) (10,364)Tax rate adjustment (30% to 28%) Note 18, page 91 - - 29,761 - - - 29,761 -Transferred to retained earnings on disposal ofproperty, plant and equipment Note 18, page 91 - - (1,315) (8,159) 1,315 8,159 - -Transfer to retained earnings on disposal of property,plant and equipment – net of deferred tax Note 18, page 91 - - 394 2,448 (394) (2,448) - -Deferred tax on asset impairment Note 18, page 91 - - 167 3,512 - - 167 3,512Impairments – property, plantand equipment Note 18, page 91 - - (557) (11,708) - - (557) (11,708)Gain on revaluation of property, plantand equipment (net) Note 18, page 91 - - - 194,367 - - - 194,367Total comprehensive income (deficit) for the year, net of tax - - 28,450 180,460 (26,788) (4,653) 1,662 175,807Balance at 30 June 260,693 260,693 1,071,655 1,043,205 120,265 147,053 1,452,613 1,450,951The financial statements should be read in conjunction with the accounting policies and notes on pages 75 to 102.71
WATERCARE SERVICES LIMITED <strong>ANNUAL</strong> <strong>REPORT</strong> <strong>2010</strong>Segment Financial PositionAS AT 30 JUNE <strong>2010</strong>Water Wastewater Total<strong>2010</strong> 2009 <strong>2010</strong> 2009 <strong>2010</strong> 2009$000 $000 $000 $000 $000 $000ASSETSLand 49,290 49,291 25,872 25,871 75,162 75,162Buildings 26,766 27,313 70,298 61,404 97,064 88,717Pipelines 471,993 472,568 390,405 378,275 862,398 850,843Tanks, tunnels, roads and reservoirs 376,970 381,622 238,183 163,370 615,153 544,992Dams 188,132 189,925 969 983 189,101 190,908Machinery 149,953 155,757 260,104 242,722 410,057 398,479Motor vehicles 442 308 344 206 786 514Office equipment 1,390 1,580 1,561 1,886 2,951 3,466Work in progress 101,908 51,885 58,533 152,403 160,441 204,288Property, plant and equipment 1,366,844 1,330,249 1,046,269 1,027,120 2,413,113 2,357,369Intangibles 6,552 7,703 7,822 8,672 14,374 16,375Other financial assets – non-current 1,849 3,491 3,435 8,729 5,284 12,220Short-term deposits 5,000 25,144 5,000 64,656 10,000 89,800Inventories – non-current 173 410 3,064 2,189 3,237 2,599Other current assets 10,810 9,352 13,972 14,949 24,782 24,301Total assets 1,391,228 1,376,349 1,079,562 1,126,315 2,470,790 2,502,664LIABILITIESBorrowings – non-current 133,280 100,000 283,220 250,000 416,500 350,000Deferred tax 236,508 251,780 165,541 168,886 402,049 420,666Other financial liabilities – non-current 14,104 7,921 26,194 19,804 40,298 27,725Provisions – non-current 533 483 520 483 1,053 966Current liabilities 65,086 71,716 93,191 180,640 158,277 252,356Total liabilities 449,511 431,900 568,666 619,813 1,018,177 1,051,713Equity 941,717 944,449 510,896 506,502 1,452,613 1,450,951Total equity and liabilities 1,391,228 1,376,349 1,079,562 1,126,315 2,470,790 2,502,664Segment Statement of Cash FlowsFOR THE YEAR ENDED 30 JUNE <strong>2010</strong>Water Wastewater Total<strong>2010</strong> 2009 <strong>2010</strong> 2009 <strong>2010</strong> 2009$000 $000 $000 $000 $000 $000Net cash flows – operating activities 31,928 41,963 55,190 39,334 87,118 81,297Net cash flows – investing activities (73,705) (56,393) (65,034) (81,994) (138,739) (138,387)Net cash flows – financing activities 40,377 14,481 10,588 42,930 50,965 57,411Net change in cash flows (1,400) 51 744 270 (656) 321The financial statements should be read in conjunction with the accounting policies and notes on pages 75 to 102.72
Statement of Financial PositionAS AT 30 JUNE <strong>2010</strong>WATERCARE SERVICES LIMITED <strong>ANNUAL</strong> <strong>REPORT</strong> <strong>2010</strong><strong>2010</strong> 2009Notes $000 $000ASSETSNon-currentProperty, plant and equipment Note 8, page 83 2,413,113 2,357,369Intangibles Note 9, page 87 14,374 16,375Other financial assets Note 23, page 95 5,284 12,220Inventories Note 10, page 87 3,237 2,599Total non-current assets 2,436,008 2,388,563CurrentCash and bank balances - 210Short-term deposits Note 23, page 95 10,000 89,800Trade and other receivables Note 11, page 87 19,047 17,853Other financial assets Note 23, page 95 162 1,595Prepaid expenses 3,306 2,483Inventories Note 10, page 87 2,267 2,160Total current assets 34,782 114,101Total assets 2,470,790 2,502,664LIABILITIESNon-currentBorrowings Note 12, page 88 416,500 350,000Deferred tax Note 13, page 89 402,049 420,666Other financial liabilities Note 23, page 95 40,298 27,725Provisions Note 15, page 90 1,053 966Total non-current liabilities 859,900 799,357CurrentBank overdraft 446 -Borrowings Note 12, page 88 109,225 204,560Trade and other payables Note 14, page 90 8,299 8,134Other financial liabilities Note 23, page 95 1,026 1,485Provisions Note 15, page 90 6,264 6,156Accrued expenses Note 16, page 90 33,017 32,021Total current liabilities 158,277 252,356Total liabilities 1,018,177 1,051,713EQUITYCapital Note 17, page 91 260,693 260,693Revaluation reserves Note 18, page 91 1,071,655 1,043,205Retained earnings Note 19, page 93 120,265 147,053Total equity 1,452,613 1,450,951Total equity and liabilities 2,470,790 2,502,664The financial statements should be read in conjunction with the accounting policies and notes on pages 75 to 102.73
WATERCARE SERVICES LIMITED <strong>ANNUAL</strong> <strong>REPORT</strong> <strong>2010</strong>Statement of Cash FlowsFOR THE YEAR ENDED 30 JUNE <strong>2010</strong><strong>2010</strong> 2009Notes $000 $000OPERATING ACTIVITIESCash (including GST received) was provided from:Customers 221,039 205,315Dividends 49 33Interest 583 124221,671 205,472Cash (including GST paid) was applied to:Price adjustment - -Employees and suppliers 101,998 99,780Finance costs 32,555 24,395134,553 124,175Net cash flows – operating activities Note 20, page 93 87,118 81,297INVESTING ACTIVITIESCash was provided from:Contributions to fund property, plant and equipment 1,111 -Sale of property, plant and equipment 25 5311,136 531Cash was applied to:Purchase and construction of property, plant and equipment 134,040 130,985Interest capitalised on construction of property, plant and equipment Note 5, page 82 5,835 7,933139,875 138,918Net cash flows – investing activities (138,739) (138,387)FINANCING ACTIVITIESCash was provided from:Short-term deposits 85,000 -Revolving credit facility (net) Note 20, page 93 21,300 -Proceeds from medium-term notes issue 50,000 200,000Proceeds from bank loan - 100,000Commercial paper issued (net) Note 20, page 93 44,665 -200,965 300,000Cash was applied to:Short-term deposits - 85,000Repay medium-term note issue 150,000Repay revolving credit facility (net) Note 20, page 93 - 10,150Repay commercial paper (net) Note 20, page 93 - 147,439150,000 242,589Net cash flows – financing activities 50,965 57,411Net change in cash flows (656) 321Bank balance (overdraft) at beginning of year 210 (111)Bank balance (overdraft) at the end of the year (446) 2102009 comparative figures adjusted in line with current year disclosure to show investing activities GST inclusive.The financial statements should be read in conjunction with the accounting policies and notes on pages 75 to 102.74
Statement of Accounting PoliciesFOR THE YEAR ENDED 30 JUNE <strong>2010</strong>WATERCARE SERVICES LIMITED <strong>ANNUAL</strong> <strong>REPORT</strong> <strong>2010</strong>Reporting EntityThe financial statements are for <strong>Watercare</strong> Services Limited, a council organisation as defined in the Local Government Act 2002 incorporated anddomiciled in New Zealand. As the company does not have any subsidiaries or associates, it is not required to prepare group financial statements.The company’s registered office and principal place of business is at 2 Nuffield Street, Newmarket, Auckland 1023.Statement of Compliance<strong>Watercare</strong> Services Limited is a public benefit entity (PBE) as defined under the New Zealand Equivalents to International Financial Reporting Standards(NZ IFRS). The financial statements and accounting policies comply with the specific recognition, measurement and disclosure requirements of NZ IFRSin relation to PBEs and New Zealand Generally Accepted Accounting Practice (NZGAAP).Statutory Base<strong>Watercare</strong> Services Limited is a company registered under the Companies Act 1993 and is a reporting entity as defined by the Financial ReportingAct 1993. The financial statements have been prepared in accordance with the requirements of the Financial Reporting Act 1993, the Local GovernmentActs 1974 and 2002 and the Companies Act 1993.Measurement BaseThe financial statements have been prepared on the historical cost basis, modified by the revaluation of land and buildings, certain infrastructuralassets and derivative instruments as described in specific accounting policies below.Functional and Presentation CurrencyThe financial statements are prepared in New Zealand dollars and all values are rounded to the nearest $1,000.Key Management DecisionsThe key areas where management has exercised its judgment in the preparation of these financial statements relate to the assessment of thereplacement cost of property, plant and equipment and their useful lives (also refer to accounting policy 8 on property, plant and equipment andaccounting policy 9 on intangibles below).Accounting PoliciesThe financial statements have been prepared in accordance with NZ IFRS and NZGAAP. The accounting policies that materially affect the measurementof financial performance, financial position and cash flows are set out below.1. SegmentsSegmental information is based on two segments, bulk water and wastewater services reflecting the company’s legislative requirements.The segment financial performance, financial position and cash flows are shown on pages 70 and 72. Revenues and expenses are apportionedto each segment on a direct basis plus an allocation of non-specific and overhead costs proportional to each segment’s staffing levels.All operations are carried out within New Zealand. There are no material transactions between the two operating segments.2. Goods and Ser vices Tax (GST)The statements of financial performance and the statement of financial position are stated excluding GST, with the exception of receivables andpayables, which include GST. The net amount of GST recoverable from or payable to, the Inland Revenue Department is included as part ofreceivables or payables in the statement of financial position. Cash flows are included in the statement of cash flows including GST except thatthe GST component of cash flows arising from investing and financing activities, which is recoverable from, or payable to, the Inland RevenueDepartment, is disclosed as an operating cash flow.3. Operating revenueOperating revenue shown in the statement of comprehensive income is the amount received and receivable for goods and services supplied tocustomers in the ordinary course of business. Revenue mainly comes from selling bulk water and providing wastewater services within the greaterAuckland region and is recognised on delivery of the goods or services.Interest income is recognised using the effective interest rate method.4. Finance costsFinance costs directly attributable to the construction of new plant and equipment are capitalised as part of the costs of the new plant andequipment. Finance costs not directly attributable as part of the costs of the new plant and equipment are recognised as an expense in the periodin which they are incurred.5. Business integration costsCosts associated with planning the integration of the water and the wastewater businesses in the Auckland region are expensed in the periodin which they are incurred except for related capital projects (also refer Note 27 on page 102).6. LeasesThe company leases certain property, plant and equipment where the lessor effectively retains substantially all the risks and benefits of ownership.Amounts payable under the terms of these leases are recognised as an expense spread evenly over the term of the lease.75
WATERCARE SERVICES LIMITED <strong>ANNUAL</strong> <strong>REPORT</strong> <strong>2010</strong>Statement of Accounting Policies continuedFOR THE YEAR ENDED 30 JUNE <strong>2010</strong>7. Research and developmentResearch costs are expensed as incurred. Development expenditure on individual projects is capitalised and recognised as an asset when it meetsthe definition and criteria for capitalisation as an asset and it is probable that the company will receive future economic benefits from the asset.Assets which have finite lives are stated at cost less accumulated amortisation and are amortised on a straight-line basis over their useful lives.8. Property, plant and equipmentClasses of assetsProperty, plant and equipment is allocated to classes, being:ÌÌ LandÌÌ BuildingsÌÌ PipelinesÌÌ Tanks, tunnels, roads and reservoirsÌÌ DamsÌÌ MachineryÌÌ Motor vehiclesÌÌ Office equipmentÌÌ Work in progressInitial recognitionThe cost of purchased property, plant and equipment is the initial purchase price plus directly attributable costs of bringing the assetsto the location and condition necessary for their intended use.Constructed assets are initially recorded at the cost of construction (including materials and direct labour), finance costs and other direct costs.These are initially recorded as work in progress until the asset is ready for productive use. Finance costs incurred during the course of constructionthat are attributable to a project are capitalised, using the finance rate applicable to the funding. When the asset is ready for productive use theongoing operating and finance costs are recorded as expenses.Contributions towards cost of constructing property, plant and equipmentWhen amounts are received to subsidise the acquisition of property, plant and equipment, the amount received is recognised in determiningthe surplus or deficit for the year.Subsequent recognitionLand and buildings are carried at fair values that reflect current market values, which is the amount that would be expected from an orderly sale,determined by an independent registered valuer every three years.Pipelines, tanks, tunnels, roads, reservoirs, dams and machinery are also carried at fair value, which is deemed to be depreciated replacementcost because the assets are of a specialised nature. The depreciated replacement costs are determined on the basis of an independent valuationprepared by external valuers every three years. The revaluation process involves assessing the current replacement cost and remaining useful livesof the specialised property, plant and equipment.Any property, plant and equipment that has been acquired after the most recent valuation is carried at cost less accumulated depreciationuntil the next revaluation.Motor vehicles, office equipment and work in progress are carried at cost less accumulated depreciation.The changes in the value of each class of property, plant and equipment as a result of the revaluations are recorded in other comprehensive incomeand accumulated in a revaluation reserve. The company maintains a revaluation reserve for each class of assets. Where cumulative decreasesexceed cumulative increases in the value of a class of assets, the net amount is recognised as an expense in determining the surplus or deficit forthe year. Any revaluation increase is credited to the asset class revaluation reserve, except to the extent that it reverses a revaluation decrease forthe same asset previously charged as an expense in determining the surplus or deficit for the year. Any accumulated depreciation at the date of therevaluation is transferred to the gross carrying amount of the asset and the asset cost is restated to the revalued amount.There are a number of assumptions and estimates used when performing depreciated replacement cost valuations of infrastructure assets.Estimates are made determining the remaining useful life over which an asset will be depreciated. If the estimated useful lives are not accurate thiswould lead to the annual depreciation charge being either higher or lower in the statement of comprehensive income. To minimise the estimationrisk of asset useful lives the company continually assesses the condition of infrastructural assets and their remaining useful lives. Physicalinspections and condition assessments are used by the company to insure that the condition of major assets are understood and the carryingvalue of an asset reflects its actual condition.ImpairmentAsset carrying values are reviewed at the end of each year (other than the year in which the assets are revalued) to determine whether thereis any indication that those assets have suffered an impairment loss or increased in fair value. If any such indication exists, the fair valueof the asset is estimated in order to determine the extent of the impairment loss or gain. If the fair value of an asset is estimated to be less thanits carrying amount, the carrying amount of the asset is reduced to its fair value. An impairment loss is recognised as a revaluation decreaseand any increase in fair value is recognised as a revaluation increase, for all classes of assets other than motor vehicles and office equipment.For motor vehicles and office equipment, impairment losses and gains are recognised in determining the surplus or deficit for the year.76
Statement of Accounting Policies continuedFOR THE YEAR ENDED 30 JUNE <strong>2010</strong>WATERCARE SERVICES LIMITED <strong>ANNUAL</strong> <strong>REPORT</strong> <strong>2010</strong>8. Property, plant and equipment continuedDepreciationDepreciation is provided on a straight-line basis on all property, plant and equipment, other than freehold land and the cost of tunnels,at rates calculated to allocate their cost or revalued amounts over their estimated useful lives. Assets are depreciated to a nil residual value.Asset classAverage useful life in yearsRange of useful livesin years for <strong>2010</strong> <strong>2010</strong> 2009Buildings 3 to 134 67 68Pipelines 1 to 227 79 79Tanks, tunnels, roads and reservoirs 1 to 220 85 85Dams 2 to 250 189 189Machinery 2 to 110 40 40Motor vehicles 5 to 5 5 5Office equipment 3 to 15 8 89. IntangiblesComputer software assets are recorded at cost less accumulated amortisation and accumulated impairment losses. Amortisation is chargedon a straight-line basis over their useful lives.Easements are recorded at cost, being the costs directly attributable to bringing the asset to its intended use.Resource Management Act consents are recorded at cost less accumulated amortisation and accumulated impairment losses.Amortisation is charged on a straight line basis.Intangible assets carrying values are reviewed at the end of each year to determine whether there is any indication that those assets have sufferedan impairment loss or increased in fair value. If any impairment loss or increase in fair value has occurred, the carrying value of the asset isadjusted and the loss or gain recognised in determining the surplus or deficit for the year.Asset classAverage useful life in yearsRange of useful livesin years for <strong>2010</strong> <strong>2010</strong> 2009Intangibles 4 to 100 28 2510. ReceivablesReceivables are recorded initially at fair value and subsequently measured at amortised cost less any impairment loss. An impairment loss isrecognised when there is objective evidence that the company will not be able to collect amounts due according to the original terms of thereceivable. The amount of the impairment loss is the difference between the asset’s carrying amount and the present value of estimated future cashflows, discounted at the effective interest rate. The amount of the impairment loss is recognised in determining the surplus or deficit for the year.11. Income taxCurrent taxCurrent tax is calculated by reference to the amount of income taxes payable or recoverable in respect of the taxable profit or loss for the period.Current tax for current and prior periods is recognised as a liability (or asset) to the extent it is unpaid (or refundable).Deferred taxDeferred tax is accounted for using the comprehensive balance sheet liability method in respect of temporary differences arising from differencesbetween the carrying amounts of assets and liabilities in the financial statements and the corresponding tax base of those items.In principle, deferred tax liabilities are recognised for all temporary differences. Deferred tax assets are recognised to the extent that it is probablethat sufficient taxable amounts will be available against which deductible temporary differences or unused tax losses and tax offsets can be utilised.Current and deferred tax assets and liabilities are measured at the tax rates that are expected to apply to period(s) when the asset and liabilitygiving rise to them are realised or settled, based on tax rates (and tax laws) that have been enacted or substantively enacted by the reporting date.12. InventoriesInventories comprise consumables, spare parts and treated water.Consumables are recorded at the lower of cost (determined on a weighted average basis) and net realisable value.Spare parts are recorded at cost less an adjustment for the reduction in economic benefits due to obsolescence. The cost of spare parts is recordedas an expense when used for repairs and maintenance on existing plant and equipment, or recorded as part of the cost of the new asset if used inthe construction of new property, plant and equipment.Treated water in the network and reservoirs is recorded at the lower of cost and net realisable value.77
WATERCARE SERVICES LIMITED <strong>ANNUAL</strong> <strong>REPORT</strong> <strong>2010</strong>Statement of Accounting Policies continuedFOR THE YEAR ENDED 30 JUNE <strong>2010</strong>13. ProvisionsThe company provides for the cost of employees’ entitlements to annual leave, sick leave and gratuities under the terms of their employmentcontracts. These amounts are expected to be settled within one year and are therefore recorded in current provisions.The company provides for the liability for employees’ long service leave under the terms of their employment contracts. The liability is calculatedas the present value of the expected future payments after allowing for wage and salary increases, the rate of staff turnover and term of servicewith the company. Long service leave is recorded in current and non-current provisions. The amount recorded in non-current provisions is expectedto be settled beyond one year from the reporting date.Other provisions are recognised when the company has a present obligation as a result of a past event and it is probable that there is a futureoutflow of resources and the amount of the provision can be reliably measured.The amount recorded as a provision is the best estimate of the consideration required to settle the obligation at the end of each year.14. Contract retentionsCertain construction contracts entitle the company to retain specified amounts to ensure the performance of contract obligations. These retentionsare recorded as a liability, and either used to remedy contract performance or paid to the contractor at the end of the retention period.15. BorrowingsBorrowings are recorded at fair value, net of transaction costs.Borrowings are subsequently measured at amortised cost using the effective interest method, with interest expense recognised on an effectiveinterest basis.Fees and expenses for establishing new borrowings are amortised over the term of those borrowings using the effective interest rate method.16. Foreign currenciesThe cost of assets purchased with foreign currencies is calculated using the exchange rate on the date of purchase. Any difference betweenthis cost and the amount later required to settle the transaction is recognised as a foreign exchange gain or loss.Operating expenses in foreign currencies are converted at the rate of exchange on the date the transaction is settled.17. Financial instrumentsNZ IFRS defines a financial instrument as any contract that gives rise to a financial asset of one entity and a financial liability or equity instrumentin another. As such, the company recognises all its financial instruments as soon as it becomes a party to the contractual provisions of thefinancial instrument.At each reporting date the company includes in its statement of financial position a range of financial assets that include cash and short-termdeposits, trade and other receivables, and various derivatives (e.g. “in the money” interest rate swaps). Similarly it also reflects in its statement offinancial position a number of financial liabilities that include bank overdrafts, trade and other payables, loans from banks and other related partiesand derivatives (e.g. “out of the money” interest rate swaps).A derivative is a financial instrument or other contract that satisfies all of the following characteristics: its value changes in response to the changein a specified variable such as an interest rate, financial instrument price, commodity price, foreign exchange rate, index of prices or rates, creditrating or credit index; it requires no initial investment or an initial investment that is smaller than would be required for other types of similarcontracts; and it will be settled at some future date.Sourcing fair valuesFor financial instruments that are traded in active markets, quoted market prices or dealer price quotations are used as a measure of fair value.Where quoted market prices do not exist, fair values are estimated using present value or other market-accepted valuation techniques, usingmethods and assumptions that are based on market conditions and risks existing at year-end. An analysis of fair values of financial instrumentsand further details on how they are measured are explained in Note 23 on page 95.Recognition and measurement of financial assetsFor the purpose of subsequent measurement, financial assets other than those designated as hedging instruments are classifiedinto one the following four categories upon initial recognition:ÌÌ loans and receivables;ÌÌ financial assets at fair value through profit or loss;ÌÌ held to maturity investments; andÌÌ available-for-sale financial assets.Each category determines the process of subsequent measurement and how the resulting surplus or deficit should be reflectedin the statement of comprehensive income.Loans and receivablesThe company’s cash and cash equivalents and trade and other receivables fall into this category of financial instruments. These are initiallyrecorded at their fair value plus transaction costs because they have fixed or determinable payments that are not quoted in an active market.After initial recognition, they are recorded at amortised cost using the effective interest rate method, less provision for impairment.78
Statement of Accounting Policies continuedFOR THE YEAR ENDED 30 JUNE <strong>2010</strong>WATERCARE SERVICES LIMITED <strong>ANNUAL</strong> <strong>REPORT</strong> <strong>2010</strong>Trade and other receivables are considered for impairment when there is objective evidence that the company will not be able to collect all amountsdue according to the original terms of the transaction. Significant financial difficulties of the debtor, probability that the debtor will enter bankruptcy orfinancial reorganisation and default or delinquency in payments (more than 30 days overdue) are considered indicators that the receivable is impaired.If there is objective evidence that individual loans and receivables should be impaired, the impairment loss is calculated as the differencebetween the carrying amount of the financial assets and the present value of estimated future cash flows using the original effective interest rate.Receivables with a short duration are not discounted.The company creates a provision to reduce the carrying amount of trade and other receivables that are considered to be impaired (or in the caseof a reversal of a write-down because of an event occurring after the impairment was recognised, an increase), unless there is no reasonablepossibility of recovering the amount from the debtor. In this case, the company writes off the receivable directly (and transfers any impairment lossrecognised in the provision account directly to the receivable).Financial assets at fair value through profit or lossAll derivative financial instruments fall into this category, except for those designated as, and effective as, hedging instruments,for which the hedge accounting requirements apply.Financial assets carried at fair value through profit or loss are initially recorded at fair value.Financial assets at fair value through profit or loss include items that are either classified as held for trading or that meet certain conditions.The company does not currently have any financial assets in this category.Held-to-maturity investmentsHeld-to-maturity investments are financial assets with fixed or determinable payments and fixed maturities other than loans and receivables.Investments are classified as held to maturity if the company has the intention and ability to hold them until maturity.All held-to-maturity investments are initially recorded at their fair value plus transaction costs.Held-to-maturity investments are measured subsequently at amortised cost using the effective interest rate method. If there is objective evidencethat the investment is impaired, determined by reference to external credit ratings, the financial asset is recorded at the present value of estimatedfuture cash flows. Any changes to the carrying amount of the investment, including impairment losses, are recognised in profit or loss.The company does not currently have any financial assets in this category.Available-for-sale financial assetsAvailable-for-sale financial assets are financial assets that are either designated to this category or do not qualify for inclusion in any of the threeother categories of financial assets.Available-for-sale financial assets are initially recorded at their fair value plus transaction costs.Available-for-sale financial assets are subsequently recorded at fair value. Gains and losses are recognised in profit or loss and reported within theavailable-for-sale reserve within equity, except for impairment losses, which are recognised in profit or loss. When the asset is disposed of or isdetermined to be impaired, the cumulative gain or loss recognised in other comprehensive income is reclassified from the available-for-sale equityreserve to profit or loss and presented as a reclassification adjustment within other comprehensive income. Interest calculated using the effectiveinterest rate method and dividends are recognised in profit or loss. Reversals of impairment losses are recognised in other comprehensive income,except for financial assets that are debt securities which are recognised in profit or loss only if the reversal can be objectively related to an eventoccurring after the impairment loss was recognised.The company does not currently have any financial assets in this category.Recognition and measurement of financial liabilitiesFinancial liabilities are initially recorded at their fair value plus transaction costs.Financial liabilities are recorded subsequently at amortised cost using the effective interest rate method, except for financial liabilitiesheld for trading or designated at fair value through profit or loss. Those liabilities are recorded subsequently at fair value with gains or lossesrecognised in profit or loss.The company does not currently have any financial liabilities held for trading or designated at fair value through profit or loss.Borrowings are classified as current liabilities unless the company has an unconditional right to defer settlement of the liability for at least12 months after the reporting date.Trade and other payables represent liabilities for goods and services provided to the company prior to the end of the financial year whichare unpaid. The amounts are unsecured and are usually paid within 30 days of recognition.Derivative financial instrumentsDerivative instruments are used by the company to manage its exposures to interest rate and foreign currency risksAny derivative financial instruments used for hedge accounting are recorded at fair value in the statement of financial position and accountedfor at fair value through profit or loss.Derecognition of financial instrumentsFinancial assets are derecognised only when the contractual rights to the cash flows from the financial asset have expired, or when the financialasset and all substantial risks and rewards associated with it have been transferred.Financial liabilities are derecognised when they have either been extinguished, discharged, cancelled or have expired.79
WATERCARE SERVICES LIMITED <strong>ANNUAL</strong> <strong>REPORT</strong> <strong>2010</strong>Statement of Accounting Policies continuedFOR THE YEAR ENDED 30 JUNE <strong>2010</strong>18. Statement of cash flowsFor the purpose of the statement of cash flows, cash and cash equivalents include cash on hand net of outstanding bank overdrafts. The followingterms are used in the statement of cash flows;ÌÌ “Operating activities” are amounts received for the supply of services by the company, and payments made to employees and suppliersnecessary to support those services including finance costs. Operating activities also include any transactions or events that are not investingor financing activities;ÌÌ “Investing activities” are amounts paid or received for the acquisition, and disposal of property, plant and equipment and other investmentsnot included in cash equivalents; andÌÌ “Financing activities” are the receipt and repayment of the principal on borrowings, and contributions from, and distributions to, shareholders.19. InsuranceThe company has significant infrastructural assets that if damaged could lead to major losses. To minimise the financial impact of such exposures,the major portion of the risk is insured by taking out appropriate insurance policies with appropriate creditworthy counterparties. Any uninsured lossis recorded in determining the surplus or deficit for the year in which the loss is incurred.20. Accounting Standards and InterpretationsThe company’s policy is to adopt accounting standards before they become mandatory. However, the following new accounting standard has beenreviewed by the company for early adoption and has not been adopted for the current financial year:ÌÌ Financial Instruments – NZ IFRS 9 (Effective for accounting periods beginning on or after 1 January 2013). As NZ IFRS 9 is expected to besubject to significant amendments in future years the company has delayed adoption of this standard until the impact of future amendments isknown. The company intends to early adopt this standard before the 2012/13 financial year. The impact of NZ IFRS 9 in its current state wouldrequire <strong>Watercare</strong> to make changes in accounting policies and disclosures relating to new classifications of financial assets but would not changethe measurement of these assets.These financials statements comply with the following new accounting standards. The impact on the financial statements is detailed below:ÌÌ Presentation of Financial Statements – NZ IAS 1. The required changes to the company’s financial statements to comply with NZ IAS 1 weremade last financial year. This included presenting all non-owner changes in equity in the statement of comprehensive income.ÌÌ Business Combinations – NZ IFRS 3 and Consolidated and Separate Financial Statements NZ IAS 27. Expenditure in the current yearin connection with the integration of the Auckland water retailers has been expensed, with the exception of capital-related projects.ÌÌ Transfer of Assets from Customers – NZ IFRIC 18. The company currently complies with this standard. In future annual reporting periods assetsvested in the company by customers will need to be reviewed as the income may have to be recognised over a period reflecting the useful life ofthe asset.ÌÌ Borrowing Costs – NZ IAS 23. The company already complies with this standard as borrowing costs for relevant assets are capitalised to the costof the asset.ÌÌ Operating Segments – NZ IFRS 8. The required changes to the company’s financial statements were made in previous financial years to segmentreporting into Water and Wastewater segments.ÌÌ Related Party Disclosures (2009) – NZ IAS 24. The standard simplifies the disclosure requirements for entities controlled by government,in relation to transactions with government or its subsidiaries. The changes have not affected the company’s current disclosures.ÌÌ Amendment to – NZ IFRS 7. Improving Disclosures about financial instruments. The amendment requires enhanced disclosures about fair valuemeasurements and liquidity risk. The required changes have been made to the company’s financial statements.Application of the following new standards and interpretations will not have any impact on the financial statements of the company because theyare not relevant to the company’s current activities or are not required.ÌÌ Insurance Contracts – NZ IFRS 4. This standard is not relevant as the company does not issue insurance contracts.ÌÌ Amendment to Share-based Payments – NZ IFRS 2. This standard is not relevant as the company does not deal with share-based payments.ÌÌ Puttable Financial Instruments and Obligations arising on Liquidation – NZ IAS 32. This is not applicable as the company does not have anyputtable financial instruments.ÌÌ Loss of Control of a Subsidiary – NZ IFRS 1 and NZ IFRS 5. These are not applicable as the company has no subsidiaries.ÌÌ Cost of an Investment in a Subsidiary, Jointly Controlled Entity or Associate – NZ IAS 27, NZ IAS 8 and NZ IAS 36. These are not applicableas the company has no subsidiaries, associates or jointly controlled entities.ÌÌ Recognition and Measurement around Hedge Accounting – NZ IAS 39. This is not applicable as the company does not apply hedge accounting.ÌÌ Agreement for the Construction of Real Estate – NZ IFRIC 15. This interpretation is not relevant as the company is not involved in the constructionof real estate.ÌÌ Hedges of Net Investment in a Foreign Operation – NZ IFRIC 16. This interpretation is not relevant as the company does not have any investmentsin a foreign operation.ÌÌ Distribution of Non-Cash Assets to Owners – NZ IFRIC 17. This interpretation is not relevant as the company is not involved in any distributionof its non-cash assets to the shareholders.ÌÌ Extinguishing Liabilities with Equity Instruments – NZ IFRIC 19. This interpretation is not relevant to the company as it not involved in any debtfor equity swaps i.e: issuing equity instruments to extinguish all or part of a financial liability.Changes in Accounting PoliciesThere have been no changes in accounting policies other than those required by the adoption of the accounting standards disclosed above.80
Notes to the Financial StatementsFOR THE YEAR ENDED 30 JUNE <strong>2010</strong>WATERCARE SERVICES LIMITED <strong>ANNUAL</strong> <strong>REPORT</strong> <strong>2010</strong>1. RevenueThe bulk water and wastewater operating revenue represents the amounts charged to customers under contracts with them.This revenue excludes any price adjustment.<strong>2010</strong> 2009$000 $000Revenue from sale of goodsBulk water 71,962 65,335Revenue from rendering of servicesWastewater services 106,922 100,870Trade waste services 11,763 11,667Other external charges 6,652 6,155Other revenueDividends from Auckland Energy Consumer Trust 49 33Interest from short-term deposits 768 569Total revenue 198,116 184,629Major customers are those that contribute more than 10% of the company’s water and wastewater revenue.The total revenue from major customers by operating segment is shown below:– Water revenue $67,677, 000 (2009 – $60,977,000)– Wastewater revenue $103,311,000 (2009 – $97,301,000)2. Price AdjustmentUnder Section 707ZZZS(1)d of the Local Government Act 1974, the company “…must decide promptly in respect of any year in which a surplus arises,whether or not to return that surplus to its customers and, if it is to do so to determine and implement the method by which that surplus may bereturned, whether by way of rebate, discount, price adjustment….”. Pursuant to this section, the company decided that no price adjustment wouldbe paid (June 2009 – no price adjustment was paid).3. Operating Expenses<strong>2010</strong> 2009$000 $000Operating expenses include:Auditors’ remuneration – audit fees 180 111– other assurance services provided as detailed below 108 136Directors’ fees 310 337Environmentally significant costs – chemicals 9,813 8,588– energy 9,442 8,091Cost of consumables and spare parts consumed 8,928 6,299Inventory impairment 29 83Operating leases and rent 2,628 2,419Receivables provided for - -Net receivables written off (recovered) 2 2Research and development - 2Salaries and wages – paid to employees 33,166 31,739– capitalised on construction of property, plant and equipment (19,429) (18,324)– expensed in determining surplus or deficit for the year 13,737 13,415Auditors’ remuneration other assurance services included the review of the activities associated with the integration of the Auckland water retailers,company financial and information systems. Prior year other assurance services included the review of greenhouse gas footprint verification,detailed review of some financial systems and review of the company’s information system facilities management.81
WATERCARE SERVICES LIMITED <strong>ANNUAL</strong> <strong>REPORT</strong> <strong>2010</strong>Notes to the Financial Statements continued4. Depreciation and Amortisation<strong>2010</strong> 2009$000 $000Buildings 2,296 2,011Pipelines 24,265 18,643Tanks, tunnels, roads and reservoirs 10,740 8,821Dams 1,749 1,493Machinery 24,415 22,009Motor vehicles 491 329Office equipment 1,288 1,190Intangibles 3,511 3,385Total depreciation and amortisation 68,755 57,8815. Finance Costs<strong>2010</strong> 2009$000 $000Interest on bank overdraft and borrowings, paid and payable 37,348 33,000Capitalised interest on construction of property, plant and equipment (<strong>2010</strong>: 7.09%) (2009: 7.08%) (5,835) (7,933)Net finance costs 31,513 25,0676. Revaluation of Derivative Financial Instruments<strong>2010</strong> 2009$000 $000Interest rate swaps contracts loss 21,289 16,369Forward foreign exchange contracts (gain)/loss (806) 230Net revaluation loss 20,483 16,5997. Tax<strong>2010</strong> 2009$000 $000Operating deficit before tax (16,398) (13,727)Income tax calculated at 30% (2009: 30%) (4,919) (4,118)Effect of revenue that is exempt from taxation - -Effect of expenses that are not deductible in determining taxable profit 255 787Imputation credits on dividends received (21) (15)Prior year and other adjustments 736 (17)Total tax effect of non-deductible/(taxable) items and prior period adjustments 970 755The May <strong>2010</strong> NZ Government Fiscal Budget was substantively enacted in May <strong>2010</strong>.As a result the following non-recurring items are required to be recognised as a tax expense:The impact of tax depreciation on buildings being non-deductible from 1 July 2011 14,037 -The impact of deferred tax as a result of reducing the corporate tax rate from 30% to 28% from 1 July 2011 1,223 -Total non-recurring items arising from May <strong>2010</strong> NZ Government Fiscal Budget 15,260 -Income tax expense (credit) recognised in surplus or deficit 11,311 (3,363)Represented by:Current tax - -Deferred tax 11,311 (3,363)Income tax expense (credit) recognised in surplus or deficit 11,311 (3,363)The tax rate used for the reconciliation above for <strong>2010</strong> is the corporate tax rate of 30% payable by New Zealand corporate entities on taxable profits under New Zealand tax law.Although the corporate tax rate was reduced to 28% in the May <strong>2010</strong> budget it will not take effect until 1 July 2011 effective for the 2011/12 income year.82
Notes to the Financial Statements continuedWATERCARE SERVICES LIMITED <strong>ANNUAL</strong> <strong>REPORT</strong> <strong>2010</strong>7. Tax continued<strong>2010</strong> 2009$000 $000Imputation creditsBalance at beginning of year 30,061 30,046Income tax payment/(refund) - -Imputation credits attached to dividends received 21 15Total imputation credits 30,082 30,061The imputation credit account is a memorandum account and does not form part of the statement of financial position.8. Property, Plant and EquipmentProperty, plant and equipment movement in net book values – including revaluation2009 <strong>2010</strong>$000 $000 $000 $000 $000 $000 $000 $000Opening Value Additions Disposals Depreciation Impairment Revaluation Reclassification Closing ValueLand 75,162 - - - - - - 75,162Buildings 88,717 10,643 - 2,296 - - - 97,064Pipelines 850,843 36,612 235 24,265 557 - - 862,398Tanks, tunnels, roads and reservoirs 544,992 80,901 - 10,740 - - - 615,153Dams 190,908 124 1 1,749 - - (181) 189,101Machinery 398,479 37,348 1,536 24,415 - - 181 410,057Motor vehicles 514 767 4 491 - - - 786Office equipment 3,466 776 3 1,288 - - - 2,9512,153,081 167,171 1,779 65,244 557 - - 2,252,672Work in progress 204,288 (43,847) - - - - - 160,441Total property, plant and equipment 2,357,369 123,324 1,779 65,244 557 - - 2,413,113The reclassification of assets between categories results from the ongoing project to improve asset data quality. The predominant reason forreclassification is to split broadly categorised assets into their component assets.It is not practical to reclassify the prior year comparatives, due to the size of the asset register.Property, plant and equipment movement in net book values – including revaluation2008 2009$000 $000 $000 $000 $000 $000 $000 $000Opening Value Additions Disposals Depreciation Impairment Revaluation Reclassification Closing ValueLand 80,850 14 - - - (5,702) - 75,162Buildings 82,273 669 14 2,011 - 7,807 (7) 88,717Pipelines 671,805 27,000 130 18,643 - 146,755 24,056 850,843Tanks, tunnels, roads and reservoirs 489,280 3,073 165 8,821 - 54,668 6,957 544,992Dams 163,671 523 - 1,493 - 24,104 4,103 190,908Machinery 410,357 5,829 813 22,009 - 40,220 (35,105) 398,479Motor vehicles 730 120 7 329 - - - 514Office equipment 4,389 272 1 1,190 - - (4) 3,4661,903,355 37,500 1,130 54,496 - 267,852 - 2,153,081Work in progress 121,679 92,360 - - 9,751 - - 204,288Total property, plant and equipment 2,025,034 129,860 1,130 54,496 9,751 267,852 - 2,357,36983
WATERCARE SERVICES LIMITED <strong>ANNUAL</strong> <strong>REPORT</strong> <strong>2010</strong>Notes to the Financial Statements continued8. Property, Plant and Equipment continuedProperty, plant and equipment movement in revaluation or cost2009 <strong>2010</strong>$000 $000 $000 $000 $000 $000 $000 $000Opening Value Additions Disposals Depreciation Impairment Revaluation Reclassification Closing ValueLand 75,162 - - - - - - 75,162Buildings 88,724 10,643 - - - - - 99,367Pipelines 851,540 36,612 242 - 557 - - 887,353Tanks, tunnels, roads and reservoirs 545,031 80,901 - - - - - 625,932Dams 190,908 124 1 - - - (181) 190,850Machinery 404,362 37,348 2,072 - - - 181 439,819Motor vehicles 3,730 767 139 - - - - 4,358Office equipment 10,705 776 1,516 - - - - 9,9652,170,162 167,171 3,970 - 557 - - 2,332,806Work in progress 204,288 (43,847) - - - - - 160,441Gross carrying value 2,374,450 123,324 3,970 - 557 - - 2,493,247Property, plant and equipment movement in revaluation or cost2008 2009$000 $000 $000 $000 $000 $000 $000 $000Opening Value Additions Disposals Depreciation Impairment Revaluation Reclassification Closing ValueLand 80,850 14 - - - (5,702) - 75,162Buildings 86,296 669 16 - - 1,782 (7) 88,724Pipelines 707,914 27,000 648 - - 92,963 24,311 851,540Tanks, tunnels, roads and reservoirs 505,953 3,073 174 - - 29,025 7,154 545,031Dams 166,400 523 - - - 19,618 4,367 190,908Machinery 460,525 5,829 1,240 - - (24,950) (35,802) 404,362Motor vehicles 3,852 120 216 - - (26) - 3,730Office equipment 10,462 272 6 - - - (23) 10,7052,022,252 37,500 2,300 - - 112,710 - 2,170,162Work in progress 121,679 92,360 - - 9,751 - - 204,288Gross carrying value 2,143,931 129,860 2,300 - 9,751 112,710 - 2,374,45084
Notes to the Financial Statements continuedWATERCARE SERVICES LIMITED <strong>ANNUAL</strong> <strong>REPORT</strong> <strong>2010</strong>8. Property, Plant and Equipment continuedProperty, plant and equipment movement in accumulated depreciation2009 <strong>2010</strong>$000 $000 $000 $000 $000 $000 $000 $000Opening Value Additions Disposals Depreciation Impairment Revaluation Reclassification Closing ValueLand - - - - - - - -Buildings 7 - - 2,296 - - - 2,303Pipelines 697 - 7 24,265 - - - 24,955Tanks, tunnels, roads and reservoirs 39 - - 10,740 - - - 10,779Dams - - - 1,749 - - - 1,749Machinery 5,883 - 536 24,415 - - - 29,762Motor vehicles 3,216 - 135 491 - - - 3,572Office equipment 7,239 - 1,513 1,288 - - - 7,014Total accumulated depreciation 17,081 - 2,191 65,244 - - - 80,134Property, plant and equipment movement in accumulated depreciation2008 2009$000 $000 $000 $000 $000 $000 $000 $000Opening Value Additions Disposals Depreciation Impairment Revaluation Reclassification Closing ValueLand - - - - - - - -Buildings 4,023 - 2 2,011 - (6,025) - 7Pipelines 36,109 - 518 18,643 - (53,792) 255 697Tanks, tunnels, roads and reservoirs 16,673 - 9 8,821 - (25,643) 197 39Dams 2,729 - - 1,493 - (4,486) 264 -Machinery 50,168 - 427 22,009 - (65,170) (697) 5,883Motor vehicles 3,122 - 209 329 - (26) - 3,216Office equipment 6,073 - 5 1,190 - - (19) 7,239Total accumulated depreciation 118,897 - 1,170 54,496 - (155,142) - 17,081ValuationsAll assets subject to valuation are independently valued every three years. The most recent valuation was at 30 June 2009. AECOM New Zealand Limited(AECOM) completed the valuation in association with Darroch registered valuers. The assumptions used in determining the depreciated replacement costof property, plant and equipment were that:ÌÌ construction costs based on recent contract-based construction work and the AECOM database reflect the costs of replacing assets; andÌÌ the useful lives of assets are calculated as the lesser of their physical life or the point where the asset is to be replaced for economic reasons.Land and buildings are valued at fair value.The Local Government Acts 1974 and 2002 restrict the business activities of the company and effectively prevent selling of key assets. Many of theassets are specialised in nature, reflecting the activities of the company. As there is no active market for such assets and the income from them is notdetermined by the market, property, plant and equipment, other than land, buildings, motor vehicles and office equipment, are revalued to depreciatedreplacement cost, which reflects their deemed fair values.Each year, other than in the years in which the assets are revalued, the company assesses whether there has been any material change in the valueof property, plant and equipment. The movement in asset values between June 2009 and June <strong>2010</strong> was assessed using indices deemed suitable byAECOM and Darroch registered valuers. The increase in asset value of 1.1% was not considered material by management and accordingly the assetswere not revalued at 30 June <strong>2010</strong>.85
WATERCARE SERVICES LIMITED <strong>ANNUAL</strong> <strong>REPORT</strong> <strong>2010</strong>Notes to the Financial Statements continued8. Property, Plant and Equipment continuedWork in progress relates to the following projects:<strong>2010</strong> 2009$000 $000Water treatment plants 12,587 6,032Wastewater treatment plant 9,175 6,244Wastewater pump stations and sewers 42,440 140,953Watermains, pump stations and reservoirs 60,630 35,028Dams and raw water transmission pipelines 21,032 5,620Other 14,577 10,411Total work in progress 160,441 204,288Property, plant and equipment movement in net book values – on historical cost basis2009 <strong>2010</strong>$000 $000 $000 $000 $000 $000 $000 $000Opening Value Additions Disposals Depreciation Impairment Revaluation Reclassification Closing ValueLand 27,999 - - - - - - 27,999Buildings 50,414 10,643 15 1,200 - - - 59,842Pipelines 237,789 36,055 42 5,228 - - - 268,574Tanks, tunnels, roads and reservoirs 223,605 80,901 5 5,869 - - - 298,632Dams 96,720 124 1 880 - - (148) 95,815Machinery 303,512 37,348 1,102 19,794 - - 148 320,112Motor vehicles 514 767 4 491 - - - 786Office equipment 3,466 776 3 1,288 - - 2,951944,019 166,614 1,172 34,750 - - - 1,074,711Work in progress 204,288 (43,847) - - - - - 160,441Total property, plant and equipment 1,148,307 122,767 1,172 34,750 - - - 1,235,152Property, plant and equipment movement in net book values – on historical cost basis2008 2009$000 $000 $000 $000 $000 $000 $000 $000Opening Value Additions Disposals Depreciation Impairment Revaluation Reclassification Closing ValueLand 27,985 14 - - - - - 27,999Buildings 50,896 669 - 1,143 - - (8) 50,414Pipelines 192,945 27,000 721 4,645 - - 23,210 237,789Tanks, tunnels, roads and reservoirs 214,855 3,073 4 4,510 - - 10,191 223,605Dams 95,606 523 - 848 - - 1,439 96,720Machinery 351,244 5,829 543 18,190 - - (34,828) 303,512Motor vehicles 730 120 7 329 - - - 514Office equipment 4,387 272 1 1,188 - - (4) 3,466938,648 37,500 1,276 30,853 - - - 944,019Work in progress 121,679 92,360 - - 9,751 - - 204,288Total property, plant and equipment 1,060,327 129,860 1,276 30,853 9,751 - - 1,148,3072009 comparative figures adjusted in line with current year disclosure.The company has voluntary disclosed the historical cost property, plant and equipment table above which is in accordance with NZIAS-16.77(e).86
Notes to the Financial Statements continuedWATERCARE SERVICES LIMITED <strong>ANNUAL</strong> <strong>REPORT</strong> <strong>2010</strong>9. Intangibles2009 <strong>2010</strong>$000 $000 $000 $000 $000 $000 $000Opening Value Additions Disposals Amortisation Impairment Reclassification Closing ValueCost 32,486 1,582 1,704 - - - 32,364Accumulated amortisation 16,111 - 1,632 3,511 - - 17,990Net book value 16,375 1,582 72 3,511 - - 14,3742008 2009$000 $000 $000 $000 $000 $000 $000Opening Value Additions Disposals Amortisation Impairment Reclassification Closing ValueCost 31,592 918 24 - - - 32,486Accumulated amortisation 12,748 - 22 3,385 - - 16,111Net book value 18,844 918 2 3,385 - - 16,37510. Inventories<strong>2010</strong> 2009$000 $000Spare parts at cost 5,649 5,068Consumables at cost 1,392 1,209Provision for obsolescence (1,751) (1,722)Treated water at cost 214 204Total inventory 5,504 4,759Represented as:Non-current inventory 3,237 2,599Current inventory 2,267 2,160Total inventory 5,504 4,75911. Trade and Other Receivables<strong>2010</strong> 2009$000 $000Trade receivables – related parties 16,223 15,770Trade receivables – other 2,824 2,083Total trade and other receivables 19,047 17,853Ageing of receivables<strong>2010</strong> 2009Gross Impairment Net Gross Impairment NetCurrent 18,852 - 18,852 17,570 - 17,5701 to 30 days overdue 145 - 145 212 - 21230 to 60 days overdue 35 - 35 48 - 48More than 60 days overdue 15 - 15 23 - 23Total 19,047 - 19,047 17,853 - 17,85387
WATERCARE SERVICES LIMITED <strong>ANNUAL</strong> <strong>REPORT</strong> <strong>2010</strong>Notes to the Financial Statements continued12. Borrowings<strong>2010</strong> 2009$000 $000Non-currentMedium-term notes (unsecured) 300,000 250,000Term loan (unsecured) 100,000 100,000Bank loan (unsecured) 16,500 -Total non-current borrowings 416,500 350,000CurrentCommercial paper (unsecured) 99,225 54,560Medium-term notes (unsecured) - 150,000Related party term loan (unsecured) 10,000 -Total current borrowings 109,225 204,560Repayment schedule:Medium-term notesLess than one year - 150,000One to two years 50,000 -Two to three years - 50,000Three to four years 220,000 -Beyond four years 30,000 200,000Term loanOne to two years 100,000 -Two to three years - 100,000Commercial paperCurrent 99,225 54,560Bank loanOne to two years 16,500 -Related party term loanCurrent 10,000 -Total borrowings 525,725 554,560<strong>2010</strong> 2009% %Interest rates at year-end:Medium-term notesAverage 6.51 6.62Average including interest rate swaps 7.89 6.97Commercial paperAverage 3.09 3.24Average including interest rate swaps 4.88 4.97Term loanAverage 3.76 3.69Average including interest rate swaps 6.78 7.11Bank loanAverage 4.27 2.50Average including interest rate swaps 4.27 2.50Related party term loanAverage 4.80 -Average including interest rate swaps 4.80 -Total debtAverage 5.24 5.76Average including interest rate swaps 6.93 6.8088
Notes to the Financial Statements continuedWATERCARE SERVICES LIMITED <strong>ANNUAL</strong> <strong>REPORT</strong> <strong>2010</strong>12. Borrowings continuedLenders under the bank loans and holders of medium-term notes and short-term commercial paper, receive the benefit of the negative pledgeundertaking from the company. This undertaking limits the extent to which the company can give security to lenders and requires the companyto ensure that the following financial ratios are achieved at all times:ÌÌ Total liabilities do not exceed 60 per cent of total tangible assetsÌÌ Total liabilities plus total contingent liabilities do not exceed 65 per cent of total tangible assetsÌÌ Shareholders’ funds are not less than $500 millionÌÌ Earnings before interest, tax, depreciation and amortisation is greater than 1.75 times interest expenseÌÌ Total tangible assets of the company are to be greater than 90 per cent of total tangible assets of the borrowing groupThe company complied with these financial covenant ratios during the years ended 30 June <strong>2010</strong> and 30 June 2009.The company has an agreement with Auckland City Council (ACC) under which ACC guarantees repayment of the company’s borrowings andits obligations under interest rate swap agreements.The company has the following undrawn committed facilities available:<strong>2010</strong> 2009$000 $000Bank loan facility, expires December 2011 (2009: expires June <strong>2010</strong>) 8,500 25,000Commercial paper standby facility, expires December 2011 (2009: expires June <strong>2010</strong>) 150,000 150,000Commercial paper held by the company is represented by multiple issues that spread interest rate and maturity risk. As each issue maturesthe company replaces it with a new issue, if required. The provider of the commercial paper standby facility acts as a lender of last resort, shouldthe company be unable to issue new commercial paper when it matures. The company’s treasury risk management policy requires standby facilitiesto be maintained to meet 50% of outstanding commercial paper and other uncommitted short-term debt repayable within 60 days (2009: the company’streasury risk management policy required standby facilities to be maintained to meet 50% commercial paper maturing within the next 60 days).The company complied with its treasury risk management policy during the years ended 30 June <strong>2010</strong> and 30 June 2009.13. Deferred Tax Liability<strong>2010</strong> 2009$000 $000Balance at beginning of year 420,666 342,348Deferred tax recognised in other comprehensive income – resulting from the revaluation of property, plant and equipment (167) 81,681Deferred tax recognised in the deficit for the year (3,949) (3,363)The impact of tax depreciation on buildings being non-deductible from 1 July 2011 recognised in the deficit for the year 14,037 -The impact on deferred tax on property, plant and equipment due to asset revaluation as a result of the reductionof the corporate tax rate from 30% to 28% from 1 July 2011 recognised in other comprehensive income (29,761) -The impact on deferred tax on tax losses and property, plant and equipment as a result of the reduction of the corporatetax rate from 30% to 28% from 1 July 2011 recognised in the deficit for the year 1,223 -Total deferred tax liability 402,049 420,666The balance relates to:Depreciation temporary differences 423,395 436,187Provisions and accrued expenses temporary differences (12,405) (6,199)Tax losses (8,941) (9,322)Total deferred tax liability 402,049 420,666The depreciation temporary differences for property, plant and equipment arise because the carrying value of property, plant and equipment is higherfor accounting purposes than for taxation purposes due to:ÌÌ The revaluation of certain assets;ÌÌ The company’s depreciation rates being lower than those permitted by tax legislation; andÌÌ For certain constructed assets, the cost for accounting purposes being higher than the cost for taxation purposes.The provisions and accrued expenses temporary differences principally relate to the mark-to-market revaluation of financial instruments. These expenseshave been recognised for accounting purposes but cannot be deducted for tax purposes until the amounts become payable.89
WATERCARE SERVICES LIMITED <strong>ANNUAL</strong> <strong>REPORT</strong> <strong>2010</strong>Notes to the Financial Statements continued14. Trade and Other Payables<strong>2010</strong> 2009$000 $000CurrentContract retentions 4,591 6,020Trade creditors – other 3,162 1,763Trade creditors – related parties 546 351Total trade and other payables 8,299 8,13415. Provisions<strong>2010</strong> 2009$000 $000Non-currentEmployee entitlements 1,053 966Total non-current provisions 1,053 966CurrentEmployee entitlements 2,498 2,399Decommissioning costs 3,276 3,276Other provisions 490 481Total current provisions 6,264 6,156Total provisions 7,317 7,122employee Decommissioning Otherentitlements Costs Provisions$000 $000 $000Balance at 1 July 2009 3,365 3,276 481Additional provisions recognised 2,601 - 561Reductions resulting from payments/reduction on future economic costs (2,415) - (552)Balance at 30 June <strong>2010</strong> 3,551 3,276 49016. Accrued Expenses<strong>2010</strong> 2009$000 $000CurrentAccrued on capital work in progress 20,880 20,815Other accrued expenses 12,137 11,206Total accrued expenses 33,017 32,02190
Notes to the Financial Statements continuedWATERCARE SERVICES LIMITED <strong>ANNUAL</strong> <strong>REPORT</strong> <strong>2010</strong>17. Capital<strong>2010</strong> 2009$000 $000Total authorised issued and paid-up capital of 260,693,164 ordinary shares of $1 each 260,693 260,693Each share in the company confers on the holder the right to:ÌÌ one vote on a poll at a meeting of the company on any resolution: andÌÌ an equal share in the distribution of the surplus assets of the company.Under Section 707ZZZS(1)(c) of the Local Government Act 1974 the company is not permitted to pay dividends.The capital management policy of the company is detailed in note 23 on page 95.18. Revaluation Reserves<strong>2010</strong> 2009$000 $000Balances at beginning of year 1,043,205 862,745Asset impairment (557) (11,708)Tax rate adjustment (30% to 28%) 29,761 -Revaluation – net of deferred tax - 194,367Deferred tax on asset impairment 167 3,512Transfer to retained earnings on disposal of property, plant and equipment – net of deferred tax 394 2,448Reclassification - -Transferred to retained earnings on disposal of property, plant and equipment (1,315) (8,159)Total revaluation reserves 1,071,655 1,043,205Comprising:Land 47,163 47,163Buildings 33,319 32,341Pipelines 569,176 553,167Tanks, tunnels, roads and reservoirs 266,364 258,630Dams 69,940 67,941Machinery 85,693 83,963Total revaluation reserves 1,071,655 1,043,205<strong>2010</strong> 2009$000 $000Analysis:LandBalances at beginning of year 47,163 52,865Asset impairment - -Tax rate adjustment (30% to 28%) - -Revaluation - (5,702)Deferred tax on asset impairment - -Transfer to retained earnings on disposal of property, plant and equipment – net of deferred tax - -Reclassification - -Transferred to retained earnings on disposal of property, plant and equipment - -Total land revaluation reserves 47,163 47,16391
WATERCARE SERVICES LIMITED <strong>ANNUAL</strong> <strong>REPORT</strong> <strong>2010</strong>Notes to the Financial Statements continued18. Revaluation Reserves continued<strong>2010</strong> 2009$000 $000BuildingsBalances at beginning of year 32,341 26,898Asset impairment - -Tax rate adjustment (30% to 28%) 967 -Revaluation - 5,465Deferred tax on asset impairment - -Transfer to retained earnings on disposal of property, plant and equipment – net of deferred tax (5) 6Reclassification - (8)Transferred to retained earnings on disposal of property, plant and equipment 16 (20)Total buildings revaluation reserves 33,319 32,341PipelinesBalances at beginning of year 553,167 450,021Asset impairment (557) (8,000)Tax rate adjustment (30% to 28%) 16,540 -Revaluation - 108,569Deferred tax on asset impairment 167 2,400Transfer to retained earnings on disposal of property, plant and equipment – net of deferred tax 60 1,880Reclassification - 4,562Transferred to retained earnings on disposal of property, plant and equipment (201) (6,265)Total pipelines revaluation reserves 569,176 553,167Tanks, tunnels, roads and reservoirsBalances at beginning of year 258,630 224,406Asset impairment - -Tax rate adjustment (30% to 28%) 7,735 -Revaluation - 38,268Deferred tax on asset impairment - -Transfer to retained earnings on disposal of property, plant and equipment – net of deferred tax - 297Reclassification - (3,351)Transferred to retained earnings on disposal of property, plant and equipment (1) (990)Total tanks, tunnels, roads and reservoirs revaluation reserves 266,364 258,630DamsBalances at beginning of year 67,941 49,645Asset impairment - -Tax rate adjustment (30% to 28%) 2,032 -Revaluation - 17,257Deferred tax on asset impairment - -Transfer to retained earnings on disposal of property, plant and equipment – net of deferred tax - -Reclassification (33) 1,039Transferred to retained earnings on disposal of property, plant and equipment - -Total dams revaluation reserves 69,940 67,941MachineryBalances at beginning of year 83,963 58,910Asset impairment - (3,708)Tax rate adjustment (30% to 28%) 2,487 -Revaluation - 30,510Deferred tax on asset impairment - 1,112Transfer to retained earnings on disposal of property, plant and equipment – net of deferred tax 339 265Reclassification 33 (2,242)Transferred to retained earnings on disposal of property, plant and equipment (1,129) (884)Total machinery revaluation reserves 85,693 83,963The revaluation reserve arises on the revaluation of property, plant and equipment. Where revalued property, plant and equipment are sold, the portionof the revaluation reserve that relates to that asset, and is effectively realised, is transferred directly to retained earnings.92
Notes to the Financial Statements continuedWATERCARE SERVICES LIMITED <strong>ANNUAL</strong> <strong>REPORT</strong> <strong>2010</strong>19. Retained Earnings<strong>2010</strong> 2009$000 $000Balance at beginning of year 147,053 151,706Net deficit after tax (27,709) (10,364)Transfer to retained earnings – net of deferred tax (394) (2,448)Transfers from revaluation reserve on disposal of property, plant and equipment 1,315 8,159Total retained earnings at end of year 120,265 147,05320. Cash Flows<strong>2010</strong> 2009$000 $000Reconciliation of net surplus/(deficit) after tax to net cash flows from operating activitiesNet deficit for the year 27,709 10,364Non-cash and non-operating items:Depreciation and amortisation of non-currrent assets 68,755 57,881Redundant assets written off and gain or loss on disposal 2,704 10,975Contributions towards cost of constructing property, plant and equipment (1,111) (259)Deferred tax 11,311 (3,363)GST on purchases of non-current assets 12,735 12,518Movements in working capital:(Increase)/decrease in assets:Inventories (745) 82Trade and other receivables (1,194) (2,479)Financial assets 8,369 (7,685)Prepaid expenses (823) (1,194)Increase/(decrease) in liabilities:Trade and other payables 165 2,215Financial liabilities 12,114 24,285Payables relating to investing activities 1,356 (4,742)Provisions 195 3,685Other accrued expenses 996 (258)Net cash flows from operating activities 87,118 81,2972009 comparative figures adjusted in line with current year disclosure to show investing activities GST inclusive.NETTING OF CASH FLOWSBank loan and commercial paperThe company has a revolving credit facility with the Bank of New Zealand (2009: Commonwealth Bank of Australia), which allows it to drawup to $25 million. The facility is operated like a current account with day-to-day cash transactions being made through it.The company issues commercial paper for periods up to 90 days. These are short-term loans similar to drawings under the bank facility.Accordingly, the net amount of bank loans and commercial paper borrowed or repaid are shown as net borrowing activities and net repayments ratherthan the gross cash flows. Note 12, page 88, provides more information on these facilities. The net amounts borrowed or repaid during the year were:ÌÌ Commercial paper borrowed (repaid) $44,665,000, 2009: ($147,439,000)ÌÌ Bank loan borrowed (repaid) $21,300,000, 2009: ($10,150,000).INVESTING CASH FLOWSIncrease in operating capacityThe capital expenditure programme is focused on the replacement and upgrading of the company’s infrastructure property, plant and equipment.93
WATERCARE SERVICES LIMITED <strong>ANNUAL</strong> <strong>REPORT</strong> <strong>2010</strong>Notes to the Financial Statements continued21. CommitmentsCapital expenditure<strong>2010</strong> 2009$000 $000The company has several major projects in progress. The capital expenditure committed to,but not recognised in the financial statements, at year-end was:Buildings 97 1,069Pipelines 10,722 7,055Tanks, tunnels, roads and reservoirs 5,654 18,615Machinery - -Other 19,602 21,715Total capital expenditure commitments 36,075 48,454Anticipated payment schedule:Current 25,121 32,947One to two years 3,651 3,877Two to five years 7,303 11,630Beyond five years - -Total capital expenditure commitments 36,075 48,454The commitments relate to the following projects:Hobson Bay sewer replacement 5,527 18,536Wastewater treatment plant 15,793 19,422Water treatment plants 1,712 1,604Other projects 13,043 8,892Total capital expenditure commitments 36,075 48,454Leases<strong>2010</strong> 2009$000 $000Anticipated payments under non-cancellable operating leases:Current 2,411 2,195One to two years 2,357 2,027Two to five years 6,299 5,896Beyond five years 49,859 48,894Total lease commitments 60,926 59,012The major lease commitment is a long-term lease of the land forming the water catchment areas, which expires in July 2092. The annual rentalof $510,000 has been included in these commitments at face value. Other leases include Newmarket office, parks, reservoirs and office equipment.22. ContingenciesThe Bank of New Zealand has issued performance bonds of $400,000 for <strong>2010</strong> (2009: $400,000). The performance bonds are to supportthe company’s obligations to the Auckland Regional Council for risks of environmental damage arising from the upgrade and operations of theMangere Wastewater Treatment Plant.94
Notes to the Financial Statements continuedWATERCARE SERVICES LIMITED <strong>ANNUAL</strong> <strong>REPORT</strong> <strong>2010</strong>23. Financial Assets and LiabilitiesCategories of financial assets and liabilitiesThe carrying amounts presented in the statement of financial position relate to the following categories of assets and liabilities:<strong>2010</strong> 2009Carrying Fair Value Carrying Fair Valueamountamount$000 $000 $000 $000Financial assetsLoans and receivablesTrade and other receivables 19,047 19,047 17,853 17,853Cash and cash equivalents - - 210 210Short-term deposits and revolving credit 10,000 10,000 89,800 89,800Fair value through profit or lossDerivative financial assets – current 162 162 1,595 1,595Derivative financial assets – non-current 5,284 5,284 12,220 12,22034,493 34,493 121,678 121,678Financial liabilitiesOther amortised costTrade, other payables and accrued expenses 41,316 41,316 40,154 40,154Bank overdraft 446 446 - -Bank loan (unsecured) 16,500 16,500 -Medium-term notes (unsecured) – current - 150,000 150,212Medium-term notes (unsecured) – non-current 300,000 314,191 250,000 250,354Term loan (unsecured) – non-current 100,000 100,381 100,000 100,477Commercial paper (unsecured) – current 99,225 99,554 54,560 54,890Related party term loan 10,000 10,000 - -Fair value through profit or lossDerivative financial liabilities – current 1,026 1,026 1,485 1,485Derivative financial liabilities – non-current 40,298 40,298 27,725 27,725608,811 623,712 623,924 625,297Fair value measurement methodsThe methods and valuation techniques used for the purpose of measuring fair values are unchanged compared to the previous reporting period.Measurement methods for financial assets and liabilities accounted for at amortised cost are described below. Methods applied for items accountedfor at fair value are also described below.Loans and receivablesDue to their relatively short-term nature, the carrying amount of trade receivables is considered a reasonable approximation of fair value.Due to their relatively short-term nature, the carrying amount of cash and cash equivalents is considered a reasonable approximation of fair value.Liabilities at amortised costDue to their relatively short-term nature, the carrying amount of trade payables is considered a reasonable approximation of fair value.The fair value of loans and borrowings is calculated based on the present value of contractual principal and interest cash flows, discounted at themarket rate of interest in the reporting period.Additional information on fair value measurements in the statement of financial position.95
WATERCARE SERVICES LIMITED <strong>ANNUAL</strong> <strong>REPORT</strong> <strong>2010</strong>Notes to the Financial Statements continued23. Financial Assets and Liabilities continuedFair value hierarchyThe company adopted the amendments to NZ IFRS 7 Improving Disclosures about Financial Instruments, effective from 1 July 2009. Theseamendments require the company to present certain information about financial instruments measured at fair value in the statement of financialposition. In the first year of application, comparative information need not be presented for the disclosures required by the amendment. Accordingly,the disclosure for the fair value hierarchy is only presented for the 30 June <strong>2010</strong> year-end.The following table presents financial assets and liabilities measured at fair value in the statement of financial position in accordance with the fair valuehierarchy. This hierarchy groups financial assets and liabilities into three levels based on the significance of inputs used in measuring the fair value ofthe financial assets and liabilities. The fair value hierarchy has the following levels:Level 1: Quoted prices (unadjusted) in active markets for identical assets or liabilities;Level 2: Inputs other than quoted prices included within level 1 that are observable for the asset or liability, either directly (i.e. as prices) or indirectly(i.e. derived from prices); andLevel 3: Inputs for the asset or liability that are not based on observable market data (unobservable inputs).The level in which the financial asset or liability is classified is determined based on the lowest level of significant input to the fair value measurement.The financial assets and liabilities measured at fair value in the statement of financial position are grouped in the fair value hierarchy as follows:<strong>2010</strong>Level 1 Level 2 Level 3$000 $000 $000Financial assetsDerivative financial assetsInterest rate swaps and forward foreign exchange contracts - 5,446 -Financial liabilitiesDerivative financial liabilitiesInterest rate swaps and forward foreign exchange contracts - 41,325 -Net fair value - (35,879) -There have been no transfers between levels 1, 2 and 3 during the year ended 30 June <strong>2010</strong>.The methods and valuation techniques used for the purpose of measuring fair value are unchanged compared to the previous reporting period.DerivativesInterest rate swaps are measured at the present value of future cash flows estimated and discounted based on the applicable yield curves derived fromquoted interest rates.Forward foreign exchange contracts are measured using observable market forward exchange rates.ReclassificationNo reclassification of financial assets was made during the years ended 30 June <strong>2010</strong> or 30 June 2009.Financial instrument risksRisk management objectives and policiesThe company’s management monitors and manages the financial risks relating to the operations of the company through internal risk reports whichanalyse exposures by degree and magnitude of risks. The main types of risks are market risk, credit risk and liquidity risk.The company seeks to minimise the effects of these risks by using derivative financial instruments to hedge these risk exposures. The use of financialderivatives is governed by the company’s policies approved by the Board of Directors, which provide written principles on interest rate risk, credit risk,the use of financial derivatives and non-derivative financial instruments, and the investment of excess liquidity. Compliance with policies and exposurelimits is reviewed by the Board of Directors on a regular basis.Market riskThe company is exposed to market risk through its use of financial instruments and specifically to interest rate risk, foreign currency and certain other price risks.Interest rate riskInterest rate risk is the risk that the fair value or future cash flows of a financial instrument will fluctuate because of changes in market interest rates.The company is exposed to interest rate risk when the company borrows funds at floating interest rates. The risk is managed by the company throughmonitoring market interest rates and reviewing the impact of these on interest rate exposure.The company has a mixture of borrowings with both fixed rates and floating rates of interest. It is company policy to ensure that a proportion of interestrate exposure is maintained on a fixed-rate basis. To achieve this, the company enters into contracts that allow some of its floating interest rate exposureto be swapped from floating to fixed, and vice versa. The contracts are called interest rate swaps and interest rate options.The company’s exposure to market interest rates relates primarily to the company’s debt obligations which are disclosed in note 12 on page 88.The company regularly analyses its interest rate exposure. Within this analysis, consideration is given to potential renewals of existing positions,alternative financing, alternative hedging positions and the mix of fixed and variable interest rates.96
Notes to the Financial Statements continuedWATERCARE SERVICES LIMITED <strong>ANNUAL</strong> <strong>REPORT</strong> <strong>2010</strong>23. Financial Assets and Liabilities continuedThe notional principal, contract amounts of agreements and fixed interest rates in place, at 30 June, to manage interest rate risk were as follows:<strong>2010</strong> 2009Fixed Notional Fixed NotionalInterest Rate amount Interest Rate amount$000 $000Interest rate swapsReceivable maturities (the company receives a fixed interest rate and pays a floating rate):Current 6.79% 150,000One to two years 6.86% 50,000 6.86% 50,000Two to three years - - - -Three to four years 5.26% 170,000 - -Four to five years - - 4.79% 130,000Beyond five years 5.10% 30,000 5.10% 30,000Payable maturities (the company receives a floating interest rate and pays a fixed interest rate):Current * 6.54% 55,000 6.13% 67,500One to two years 5.48% 125,000 6.54% 55,000Two to five years 6.25% 15,000 6.46% 45,000Beyond five years 6.35% 660,000 6.32% 655,000*The amount of $55,000,000 includes a ‘knock out’ interest rate swap of $25,000,000.i) The $25,000,000 ‘knock out’ interest rate swap provides for a fixed interest rate of borrowing of 6.36% unless the floating rate on a reset dateis higher than 7.35%. In that event, the interest rate will revert to the floating rate.ii) The remaining $30,000,000 of interest rate swap is floating interest rate to fixed interest rate which swaps at the fixed rate of 6.70%.As interest rates change, these derivatives financial instruments are revalued to fair value and the change in value recorded in the statementof comprehensive income.Interest rate sensitivityThe following sensitivity analysis is based on the interest rate risk exposures in existence at 30 June.At 30 June, if interest rates had moved, as illustrated in the table below, with all other variables held constant, post-tax surplus and equity would havebeen affected as follows:Post-Tax SurplusEquityHigher/(Lower)Higher/(Lower)<strong>2010</strong> 2009 <strong>2010</strong> 2009$000 $000 $000 $000Judgments of reasonably possible movements:Interest paid1% (100 basis points) higher for the year (501) (1,293) (501) (1,293)1% (100 basis points) lower for the year 501 1,293 501 1,293Revaluation of derivative financial instruments1% (100 basis points) higher at year-end 20,080 18,943 20,080 18,9431% (100 basis points) lower at year-end (22,095) (20,980) (22,095) (20,980)97
WATERCARE SERVICES LIMITED <strong>ANNUAL</strong> <strong>REPORT</strong> <strong>2010</strong>Notes to the Financial Statements continued23. Financial Assets and Liabilities continuedForeign currency riskForeign currency risk is the risk that the fair value of future cash flows of a financial instrument will fluctuate because of changes in foreign exchangerates. Most of the company’s transactions are carried out in New Zealand dollars.From time to time the company is exposed to foreign currency risk on transactions denominated in foreign currencies. This is predominantly for thepurchase of equipment, parts and chemicals in foreign currency. Where amounts exceed $100,000 the company hedges this risk with forward foreignexchange contracts or options.The company has not adopted “hedge accounting” in respect of any derivative financial instruments.The company has forward foreign exchange contracts at year-end as follows:Average Foreign Contract Carrying AmountExchange Rate Currency value and Fair Value<strong>2010</strong> 2009 <strong>2010</strong> 2009 <strong>2010</strong> 2009 <strong>2010</strong> 2009FC 000 FC 000 NZ$000 NZ$000 NZ$000 NZ$000USDLess than 3 months 0.719 0.544 1,740 1,500 2,420 2,759 96 (449)3 months and beyond 0.713 0.585 1,000 1,500 1,403 2,563 66 (225)GBPLess than 3 months - - - - - - - -3 months and beyond - - - - - - - -AUDLess than 3 months 0.789 0.861 90 149 114 173 (48) 123 months and beyond 0.801 0.793 140 1,373 175 1,731 (4) (32)Total forward foreign exchange contracts 4,112 7,226 110 (694)Foreign currency sensitivityThe following sensitivity analysis is based on the foreign currency risk exposures in existence at year-end. At 30 June, had the New Zealand dollarexchange rate changed, as illustrated in the table below, with all other variables held constant, post-tax surplus and equity would have been affectedas follows:Post-Tax SurplusEquityHigher/(Lower)Higher/(Lower)<strong>2010</strong> 2009 <strong>2010</strong> 2009$000 $000 $000 $000Sensitivity to reasonable movementsChange in United States dollar exchange rate10% increase (256) (298) (256) (298)10% decrease 313 365 313 365Change in United Kingdom pound exchange rate10% increase - - - -10% decrease - - - -Change in Australian dollar exchange rate10% increase (18) (119) (18) (119)10% decrease 22 146 22 146Credit riskCredit risk is the risk that a counterparty will default on its contractual obligations resulting in financial loss to the company. Financial instruments whichpotentially subject the company to credit risk principally consist of cash and cash equivalents, derivative assets held for risk management, and tradeand other receivables.The company’s cash and cash equivalents are placed with major trading banks with a minimum AA- credit-rating assigned by international credit-ratingagencies. The company performs credit evaluations on major customers requiring credit purchases.The company’s six major customers account for 90% of the revenue and they are responsible for retail water supply and wastewater collection withinthe Auckland region.Outstanding amounts are closely managed. Because of the high credit rating of its customers, the company does not require collateral or other securityto support these receivables.There are no trade receivables whose terms have been renegotiated.98
Notes to the Financial Statements continuedWATERCARE SERVICES LIMITED <strong>ANNUAL</strong> <strong>REPORT</strong> <strong>2010</strong>23. Financial Assets and Liabilities continuedLiquidity riskLiquidity risk is the risk arising from the company not being able to meet its financial obligations.Ultimate responsibility for liquidity risk management rests with the Board of Directors, which has an appropriate liquidity risk management framework forthe management of the company’s short, medium and long-term funding and liquidity management requirements. The company manages liquidity riskby maintaining adequate reserves and banking facilities, monitoring forecast and actual cash flows and by matching this with the maturity profiles offinancial liabilities.The company’s objective is to maintain a balance between continuity of funding and flexibility through the use of the medium-term notes, term loans,overdraft, revolving credit facility and commercial paper.The liquidity risk associated with the short-term commercial paper programme is mitigated by the commercial paper standby facility of $150 million.The tables below detail the gross undiscounted cash flows of the company’s financial liabilities on the basis of their earliest possible contractualmaturity (including interest payments where applicable). Cash flows for financial liabilities without fixed amount or timing restrictions are basedon the conditions existing at 30 June <strong>2010</strong>.Gross contractual maturity analysisCurrentNon-current0 – 6 7 – 12 1 – 2 2 – 3 More than Gross nominal Carryingmonths months years years 3 years outflow amount$’000 $’000 $’000 $’000 $’000 $’000 $’00030 June <strong>2010</strong>Financial liabilitiesTrade and other payables 41,316 - - - - 41,316 41,316Loan facilities and derivatives 21,598 21,082 294,287 25,592 287,530 650,089 567,49562,914 21,082 294,287 25,592 287,530 691,405 608,811CurrentNon-current0 – 6 7 – 12 1 – 2 2 – 3 More than Gross nominal Carryingmonths months years years 3 years outflow amount$’000 $’000 $’000 $’000 $’000 $’000 $’00030 June 2009Financial liabilitiesTrade and other payables 40,154 - - - - 40,154 40,154Loan facilities and derivatives 166,930 70,515 29,721 169,889 237,401 674,456 583,770207,084 70,515 29,721 169,889 237,401 714,610 623,924The company monitors rolling forecasts of liquidity reserves on the basis of expected cash flow. At 30 June <strong>2010</strong> the company had available$159.8 million of unused credit facilities (commercial paper, overdraft facility and revolving credit facility) available for its immediate use(2009: $221.4 million).Capital managementThe company considers share capital and retained earnings to be its capital for management purposes.The company’s policy is to maintain a strong capital base so as to maintain investor, creditor and market confidence and to sustain future developmentof the business. The impact of the level of capital on shareholders’ return is also recognised. The company also recognises the need to maintain abalance between the higher returns that might be possible with greater gearing and the advantages and security afforded by a sound capital position.Note 12 on page 88, outlines the covenants that the company is subject to for its borrowings. All covenants have been met during each reporting period.In ensuring that the company has sufficient solvency to satisfy all it operational needs, it closely monitors the ratio between the funds that it receivesfrom operation and its interest expense.There has been no change in the company’s management of capital during the years ended 30 June <strong>2010</strong> and 30 June 2009.99
WATERCARE SERVICES LIMITED <strong>ANNUAL</strong> <strong>REPORT</strong> <strong>2010</strong>Notes to the Financial Statements continued24. Related Parties% Shares Shares<strong>2010</strong> 2009ShareholdersAuckland City Council 41.6% 108,551,635 108,551,635Manukau City Council 25.1% 65,481,895 65,481,895Waitakere City Council 16.7% 43,400,849 43,400,849North Shore City Council 11.5% 29,988,909 29,988,909Papakura District Council 3.7% 9,667,225 9,667,225Rodney District Council 1.4% 3,602,651 3,602,651100% 260,693,164 260,693,164Other related partiesMetrowater Limited (a subsidiary of Auckland City Council).Manukau Water Limited (a subsidiary of Manukau City Council).Transactions with related partiesThe company supplies bulk water and wastewater services predominantly to related parties in the Auckland region. The company also pays ratesand other operating expenses to these parties in the normal course of business.<strong>2010</strong> 2009$000 $000Sales to related parties 173,610 161,196Purchases from related parties 2,242 2,908<strong>2010</strong> 2009$000 $000Trade receivables 16,223 15,770Trade payables 546 351<strong>2010</strong> 2009$000 $000Loans from related parties 10,000 -The company has an agreement with Auckland City Council (ACC) under which ACC guarantees repayment of the company’s borrowings and itsobligations under interest rate hedges.100
Notes to the Financial Statements continuedWATERCARE SERVICES LIMITED <strong>ANNUAL</strong> <strong>REPORT</strong> <strong>2010</strong>25. RemunerationThe directors and key management personnel are included in this compensation.Compensation of directors and key management personnel<strong>2010</strong> 2009$000 $000Employees’ salaries and wages and directors fees 2,952 2,661Post-employment benefits - -Other long-term employee benefits 20 32Termination benefits 260 -Share-based benefits - -Total compensation for directors and key executives 3,232 2,693Directors’ remuneration<strong>2010</strong> 2009Appointed $000 $000Graeme Hawkins (Chairman) December 2002 75 75David Clarke July 2008 38 38Peter Drummond March <strong>2010</strong> 16 -Catherine Handley (retired December 2008) December 2002 - 19Susan Huria July 2008 38 38Terry Kayes (retired January <strong>2010</strong>) January 2007 19 38Ross Keenan (Deputy Chairman) March <strong>2010</strong> 18 -Dr Ian Parton (resigned December 2009) March 2001 24 47Patrick Snedden December 2002 38 38Jeff Todd May 2007 44 44310 337Employee remuneration range<strong>2010</strong> 2009Number of EmployeesNumber of EmployeesRemuneration Remuneration Total Remuneration Remuneration Totalincluding Redundancyincluding Redundancyand Restructuringand Restructuring$100,000 – $110,000 18 - 18 13 - 13$110,001 – $120,000 15 - 15 17 - 17$120,001 – $130,000 20 - 20 14 - 14$130,001 – $140,000 8 - 8 3 - 3$140,001 – $150,000 - - - 2 - 2$150,001 – $160,000 2 - 2 4 - 4$160,001 – $170,000 3 - 3 2 - 2$170,001 – $180,000 3 - 3 1 - 1$180,001 – $190,000 - - - 2 - 2$190,001 – $200,000 1 - 1 2 - 2$200,001 – $210,000 2 - 2 1 - 1$210,001 – $220,000 2 - 2 - - -$220,001 – $230,000 2 - 2 - - -$230,001 – $240,000 - - - - - -$240,001 – $250,000 - - - - - -$250,001 – $260,000 - - - 1 - 1$260,001 – $270,000 1 - 1 1 - 1$270,001 – $280,000 - - - 1 - 1$280,001 – $290,000 - - - 1 - 1$290,001 – $300,000 - - - - - -$300,001 – $310,000 1 - 1 - - -$310,001 – $320,000 1 - 1 - - -$380,001 – $390,000 1 - 1 - - -$570,001 – $580,000* - 1 1 - - -$660,001 – $670,000** - - - 1 - 1*Includes in <strong>2010</strong>: $374,000 in respect of redundancy, annual leave and long service leave payments.**Includes in 2009: $86,000 in respect of annual leave and long service leave payments.101
WATERCARE SERVICES LIMITED <strong>ANNUAL</strong> <strong>REPORT</strong> <strong>2010</strong>Notes to the Financial Statements continued26. Retirement Benefit PlansThe employees of the company can elect to join the KiwiSaver scheme. KiwiSaver is a work based savings scheme run through a selection of privateproviders. The obligation of the company is to contribute a specified percentage of payroll costs to the KiwiSaver scheme in line with employeecontributions and the only obligation of the company to the KiwiSaver scheme is to make the specified contributions.The total defined contribution expense recognised in the statement of comprehensive income for <strong>2010</strong> was $342,369 (2009: $147,567). This waspartially offset by the employer tax credit of $Nil (2009: $89,598).27. Events Occurring After Year-EndAuckland local government reorganisationOn 1 November <strong>2010</strong> the company will acquire the water and wastewater businesses conducted by Metrowater Limited, Manukau Water Limited,North Shore City Council, Waitakere City Council, Rodney District Council and Franklin District Council, in accordance with the Local Government(Tamaki Makaurau Reorganisation) Act 2009, the Local Government (Auckland Council) Act 2009 and the Local Government (Auckland Law Reform) Act <strong>2010</strong>.The company will provide total water and wastewater services to the Auckland region from that date and as a result, the assets, liabilities, revenues andcosts of the company will increase significantly.The company will be 100% owned by the new Auckland Council from 1 November <strong>2010</strong>.No other significant events have occurred since year-end requiring disclosure in the financial statements.102
Statement of Service PerformanceWATERCARE SERVICES LIMITED <strong>ANNUAL</strong> <strong>REPORT</strong> <strong>2010</strong>Economic Policy: To manage the business efficiently1. ECONOMIC PERFORMANCE: To manage the business efficiently at minimum prices and to operate on a least-cost basissubject to fulfilling other environmental, social and legislative requirements.a) To ensure that financial strategies are consistent with achieving economic efficiency, intergenerational equity and an optimal cost of capital.i) To meet the requirements of the Auckland City Council Guarantee of <strong>Watercare</strong>’s debt.All requirements were met.ii) To achieve a funds flow from operations (FFO) to interest cover of 2.5 times before any price adjustments.The FFO to interest cover was 2.93 for the year, which exceeds the required target. The higher FFO reflects lower interest costs and operational cost savings.b) To ensure that the regime for the pricing of water and wastewater services is enduring, transparent and reliable.i) The pricing methodology enables the revenue to be set to recover all costs and provide for an adequate level of debt servicing.Price increases as indicated in the February 2009 Funding Plan have been implemented from 1 July 2009. The <strong>2010</strong> Funding Plan pricing ensuresrevenue is set to recover all costs, including integration, and provides for an adequate level of debt servicing.ii) The pricing methodology established cannot be changed without <strong>Watercare</strong> providing the LNO customers with three-year advancenotification of a change.The pricing methodology for water and wastewater is set out in the water and wastewater contracts which require three year’s notice to be changed.c) To promote continuous improvement in sustainable business performance.i) To continue to use the Project Improve initiative as the vehicle to deliver continuous improvement in business performance.Project Improve was developed in 2002 as a framework for the identification, capture and sharing of improvement ideas. Since then it has helped to fosterinnovation and a culture of improvement. Initiatives such as reliability centred maintenance, research programmes and business intelligence reporting areinitiatives that were developed through the programme. A Continuous Improvement feedback system is used to recognise and celebrate improvement ideasby staff. Among the ideas that received recognition over the past 12 months are a contractor tracking system used at treatment plants and a trolley forsewer maintenance.d) To ensure efficiency in operational expenditure is maintained.i) To meet operational efficiency targets (operating expenses excluding depreciation and interest) established in the December 2008 AMPas follows: 2009/10 - $96.09 million; <strong>2010</strong>/11 - $94.09 million; 2011/12 - $88.52 million.Target achieved. 2009/10 actual cost $88.73 million.ii) To report operational expenditure relative to budget for water, wastewater and capex.Each year <strong>Watercare</strong> budgets for operational efficiency gains and tracks performance against budget which is reported to the executiveand the Board on a monthly basis and to the shareholders every quarter. Operating expenditure (excluding depreciation and interest) was$4 million or 4.5% lower than budget. Capital expenditure was $18 million or 13% lower than budget.2. ASSET MANAGEMENT: To manage and maintain the long-term integrity of assets.a) To provide leadership in the development of an integrated regional solution for the management of water, wastewater and stormwater.i) To develop a three-waters implementation plan by June <strong>2010</strong>.A Draft Three-Waters Implementation Plan has been prepared. Decisions on implementation aspects of the plan will be influenced by directions takenby the new Auckland Council in relation to stormwater and by decisions yet to be made in terms of integration of the local and trunk components of watersupply and wastewater service delivery.b) To promote continuous improvement in asset planning processes.i) To achieve 80% overall performance in the WSAA asset management benchmarking.Since 1998 <strong>Watercare</strong> has participated in a regular benchmarking process to measure its asset management processes against best practice. In recentyears, <strong>Watercare</strong> adopted a benchmarking framework (AQUAMARK2) developed by the Water Services Association of Australia (WSAA). In 2008, WSAAcombined with the International Water Association (IWA) in benchmarking water companies in Australia, New Zealand, the United States, Singapore,Hong Kong and the Middle East.The benchmarking survey was undertaken in March 2008 and results were announced in October 2008. <strong>Watercare</strong> achieved a score of 83%.The next WSAA survey will be undertaken following integration.103
WATERCARE SERVICES LIMITED <strong>ANNUAL</strong> <strong>REPORT</strong> <strong>2010</strong>Statement of Service Performance continuedc) To develop and implement effective and efficient capital investment and maintenance programmes.i) To ensure that capital projects have robust business cases and are delivered to plan.All of <strong>Watercare</strong>’s capital projects are supported by robust business cases and are managed to ensure delivery to plan in a timely and costeffective manner. Project progress is reported regularly to the executive and the Board. Upon project completion, post completion reportsare compiled for all projects greater than $2 million and reviewed to identify opportunities for improvement.ii) To continue with the implementation of the reliability centred maintenance (RCM) system.The RCM system offers the opportunity to plan asset maintenance in order to optimise the life of assets and maximise the potential of a cost-effectivemaintenance programme. Development and implementation of the system is now complete. An RCM based maintenance programme has beenimplemented for the Mangere Wastewater Treatment Plant, for the water and wastewater networks and for water treatment and head-works’ assets.RCM models will be updated as needed. This system has been used to assist with the development of the maintenance budgets.d) To maintain a focus on integrated planning with the customers to secure long-term wastewater solutions and manage regional wet-weather overflows.i) To facilitate a process to agree regional environmental objectives, including the setting of wastewater overflow performance targetsfor each of the region’s key receiving water environments, within three years.<strong>Watercare</strong> established a Policy Integration Group to review opportunities that will help with efficient integration of water and wastewater service deliveryand with future land-use planning under the new regional planning framework. The work includes consideration of options to manage and legally authorisewet-weather overflows. <strong>Watercare</strong> is also a member of the Regional Policy Steering Group, which provides an opportunity to input into regional policy andplanning decisions related to infrastructure.ii) To facilitate collaborative planning associated with the Central Interceptor.A series of meetings has been held with Auckland City Council and Metrowater to facilitate catchment prioritisation for future upgrading works.The Motions Road and Grey Lynn catchments have been confirmed as the next priorities for detailed investigation. Following integration on 1 November<strong>2010</strong>, <strong>Watercare</strong> will take full responsibility for the Central Interceptor and will work closely with the new Auckland Council to achieve effective outcomes.ii) To commence the process to secure regional access for the use of the Rosedale Wastewater Treatment Plant.Rosedale Wastewater Treatment Plant has been secured by <strong>Watercare</strong> as part of the integration of regional water services associated with theAuckland Governance changes. The Rosedale Wastewater Treatment plan will become one of four regional hubs for the monitoring and delivery of services.104
Statement of Service Performance continuedWATERCARE SERVICES LIMITED <strong>ANNUAL</strong> <strong>REPORT</strong> <strong>2010</strong>Environmental Policy: To operate the business in a sustainable manner3. ENVIRONMENTAL CARE: To minimise the adverse impact of the company’s operations on the environment.a) To promote conservation of the region’s water resources.i) To lead the development of a regional demand management strategy, including further testing/analysis of the economicallyviable levels of water conservation and reuse.A draft framework has been prepared for the Regional Demand Management and Conservation Strategy. Further development of the regionaldemand management model is under way to incorporate cost/benefit analysis of water conservation initiatives.b) To promote to industry cleaner dischargesi) To achieve a ‘Bb’ grade as set-out in the 2003 NZWWA guidelines for the safe application of biosolids to land.The ‘Bb’ grade for biosolids has been maintained.c) To minimise the impact of carbon on the environment.i) To achieve a 75% CO 2equivalent reduction from 1990 levels.<strong>Watercare</strong>’s focus on reducing atmospheric emissions of carbon continued. In comparison with levels in 1990, the company achieved an 86 per centreduction in carbon dioxide (CO 2) equivalent emissions. The largest contributing factor since 1990 was the decommissioning of the oxidation ponds andsludge lagoons at the Mangere Wastewater Treatment Plant. Other initiatives, such as collecting methane for electricity generation and optimising theefficiency of hydro-generation at water storage dams, reduce reliance on external energy sources. <strong>Watercare</strong> continued to review its approach to measuringemissions to ensure consistency with best practice.d) To use energy efficiently, and where appropriate, recover energy from operational activities.i) To target 35% of energy needs sourced internally for each of the next three years.The continued optimisation of hydro-generators helped to improve generator availability. However, this was offset by dry weather conditions which necessitatedan increase in the use of the Waikato Treatment Plant, resulting in 44 per cent of <strong>Watercare</strong>’s energy needs being sourced internally.105
WATERCARE SERVICES LIMITED <strong>ANNUAL</strong> <strong>REPORT</strong> <strong>2010</strong>Statement of Service Performance continuedSocial Policy: To act in a socially responsible manner4. EMPLOYEE HEALTH, SAFETY and WELLBEING: To be an industry best work place.a) To promote staff productivity and wellbeing.i) To attain a lost-time injury frequency (LTIF) rate of less than or equal to 5.The LTIFR for the year was 3.52 relative to the company target of less than or equal to 5.ii) To target an unplanned absenteeism rate of less than 2.5%.Unplanned absenteeism for the year was favourable at 1.77%. Absences were due primarily to sick leave.b) To provide comprehensive training and development programmes.i) To target over 20 training hours per employee.The company invested an average of $1,395 per employee for educational purposes in 2009/10. An average of 25.45 hours of training per employeewas completed for the year. This is well above the New Zealand Human Resources Benchmark of 14 hours per employee.ii) To target a ratio of 2.25 of external to internal appointments.<strong>Watercare</strong> aims to develop staff and offer internal transfers and promotions where appropriate. Year to date, the ratio of external to internal appointmentsis 2.4 (24 external appointments, 10 internal appointments) compared with the target of 2.25.As a result of integration, all vacancies since November 2009 have been advertised within <strong>Watercare</strong>, the LNOs and Auckland councils unless the necessaryskills and experience were unavailable. If appointments from these organisations are considered ‘internal’ then the ratio drops significantly to 1.3.c) To provide employees with safe working conditions.i) To maintain the tertiary level ACC workplace management practices accreditation.<strong>Watercare</strong> has a comprehensive health and safety management programme that includes documented policies and procedures supported by a companyculture that promotes a team approach to workplace health and safety, including working with contractors. As a result of these practices and the goodsafety record, <strong>Watercare</strong> once again successfully achieved tertiary level ACC accreditation in 1 February 2009. Accreditation is scheduled for review againin January 2011.106
Statement of Service Performance continuedWATERCARE SERVICES LIMITED <strong>ANNUAL</strong> <strong>REPORT</strong> <strong>2010</strong>Social Policy: To act in a socially responsible manner (continued)5. STAKEHOLDER RELATIONSHIPS: To be responsive to stakeholder needs and requirements.a) To engage with stakeholders in a transparent and collaborative manner including the company’s Maori and Environmental Advisory Groups.i) To consult with all appropriate stakeholders in regard to key infrastructure projects.Regular communication occurs between <strong>Watercare</strong> and its stakeholders in relation to key infrastructure projects. Communication plans are developedfor significant projects such as ‘Hobson Headlines’ for the Hobson Bay Sewer Replacement. Community, iwi and interest group consultation has alsotaken place during the planning stages of the Puketutu Island Biosolids project.The company retains its advisory groups with Maori and Environmental stakeholders who meet on a quarterly basis. A new <strong>Watercare</strong> Consumer AdvisoryGroup was formed this year to assist the company with ongoing independent advice on its commitment to treat all consumers in a fair and equitablemanner. Three meetings have been held to date.ii) To consult with the Local Network Operators in the development of the Asset Management Plan, including major projects and to reviewthe consultation process with them.The preparation of the <strong>2010</strong> regional AMP is progressing to plan. Project definition sheets containing high level estimates of project costs and timingfor all capital projects have been completed for LNOs and <strong>Watercare</strong>. Information gathering from LNOs for inclusion in the regional AMP is continuing.Given the dependency of the asset management planning process on the organisational structure and cost centre management being put in place, the firstdraft of the regional AMP forecasts is likely to be available as early as mid-September <strong>2010</strong>. This will be followed by a period of discussion and approvals.The target release date for the <strong>2010</strong> regional AMP is 1 December <strong>2010</strong>. This will be in line with traditional timing of the release of <strong>Watercare</strong>’s AMP.iii) To obtain annual feedback from the company’s Advisory Groups on the consultation process.The advisory groups meet on a quarterly basis during the year. Feedback has been included in the 2009/10 Annual Report.b) To provide leadership within the water industry and participate in public policy initiatives and statutory submissions.i) To report on the number of policy initiatives and key submissions made per annum.The company made submissions to National Standards and Policy Statements, the Infrastructure Bill and the Waikato-Tainui Raupatu Claims (Waikato River)Settlement Bill. <strong>Watercare</strong> has also participated in and responded to requests on the Auckland Governance legislation required for integration:1. Local Government (Tamaki Makaurau Reorganisation) Act 20092. Local Government (Auckland Council) Act 20093. Local Government (Auckland Council) Amendment Act <strong>2010</strong>4. Local Government (Auckland Transitional Provisions) Act <strong>2010</strong>Updates on policy submissions and progress are reported monthly to the directors and on a quarterly basis to the shareholders.c) To promote appropriate educational and recreational initiatives.i) To continue with the Rain Forest Express, the ‘Adopt a Stream’ and other educational programmes as appropriate.Both these community programmes continue to be very popular. Patronage on the Rain Forest Express also remains strong and is slightly below forecast levelsfor year-end. Confirmed bookings for Adopt a Stream in <strong>2010</strong> have remained strong and stand at 4,761 for the financial year-end.d) To maintain sound governancei) To maintain sound governance and contribute to the development of a productive working relationship with the SRGThe Board normally meets monthly. However, two meetings per month have been held in <strong>2010</strong> to keep pace with the information and decision-makingrequirements of Project One. Shareholder reporting continues on a quarterly basis with briefings held six monthly or earlier if requested. Meetings withindividual shareholding councils are also held as requested.107
WATERCARE SERVICES LIMITED <strong>ANNUAL</strong> <strong>REPORT</strong> <strong>2010</strong>Statement of Service Performance continued6. CUSTOMER SERVICE COMMITMENT: To provide high-quality products and meet customer service level requirements.a) To supply high-quality and reliable drinking water.i) To maintain the public health grading of water treatment and networks of ‘Aa’.Grading of the water treatment plants and the distribution network was carried out by the Auckland District Health Board on behalf of the Ministry of Health.The treatment plants and the distribution network received an ‘Aa’ grading.ii) To ensure that demand can be met in a drought with a 1% probability of occurrence with 15% residual capacity in its reservoirsThe water supply standard, part of the customer contracts, requires <strong>Watercare</strong> to plan to meet forecast demand in a drought with a 1% probabilityof occurrence (1 in 100 year drought) with a 15% residual capacity in the reservoirs. The standard has been achieved and was maintained even thougha record dry spell was experienced over the period January to April <strong>2010</strong>.b) To provide for the safe transportation, treatment and disposal of bulk wastewater.i) To target less than or equal to six dry-weather sewer overflows per annum.Three dry-weather overflows were reported for the year.c) To be responsive to customer needs and to deliver a service meeting contractual standards.i) To achieve 100% compliance with the customer contracts.Full compliance was achieved with all customer contracts.108
G3 Cross-Reference TableWATERCARE SERVICES LIMITED <strong>ANNUAL</strong> <strong>REPORT</strong> <strong>2010</strong>KEY:Fully reportedPartially reportedNot reported<strong>Watercare</strong>’s Annual Report <strong>2010</strong> has been prepared in accordance with the G3 framework of the Global Reporting Initiative(GRI) Sustainability Reporting Guidelines. This framework exists to assist organisations to report theireconomic, environmental and social performance in a consistent and comparable manner. The following pages showhow <strong>Watercare</strong> reports its performance against the G3 indicators. Against each indicator, <strong>Watercare</strong> has either fullyreported, partially reported or not reported. The key (left) explains the symbols used. The GRI disclosures forstrategy and analysis, organisational profile, report parameters and governance (sections 1.1to 4.17) are excluded from the G3 cross-reference table but are covered in pages 1 to 60 of this report.The GRI aims, objectives and guidelines can be found on their website www.globalreporting.orgECONOMIC INDICATORSASPECT: ECONOMIC PERFORMANCE REFERENCE RULERCORE EC1 Direct economic value generated and distributed, including revenues, operating costs, employee compensation, donations andother community investments, retained earnings and payments to capital providers and governments.Pages 62-102CORE EC2 Financial implications and other risks and opportunities for the organisation’s activities due to climate change. Figure 64CORE EC3 Coverage of the organisation’s defined benefit plan obligations. Figure 42CORE EC4 Significant financial assistance received from government. Pages 62-102ASPECT: MARKET PRESENCE REFERENCE RULERADD EC5 Range of ratios of standard entry-level wage compared to local minimum wage at significant locations of operation. Figure 42 5a to cCORE EC6 Policy, practices and proportion of spending on locally-based suppliers at significant locations of operation. Figure 60 5a to cCORE EC7 Procedures for local hiring and proportion of senior management hired from the local community at locations of significantoperation.Figure 455a to cASPECT: indirect economic impacts REFERENCE RULERCORE EC8 Development and impact of infrastructure investments and services provided primarily for public benefit through commercial,in-kind or pro-bono engagement.Figure 59ADD EC9 Understanding and describing significant indirect economic impacts, including the extent of impacts.ENVIRONMENTAL INDICATORSASPECT: MATERIALS REFERENCE RULERCORE EN1 Materials used by weight or volume. Figure 19CORE EN2 Percentage of materials used that are recycled input materials. Figure 19ASPECT: ENERGY REFERENCE RULERCORE EN3 Direct energy consumption by primary energy source. Figure 29CORE EN4 Indirect energy consumption by primary source. Figure 30ADD EN5 Energy saved due to conservation and efficiency improvements. Figure 33ADD EN6 Initiatives to provide energy-efficient or renewable energy-based products and services, and reductions in energy requirementsas a result of these initiatives.Figure 27ADD EN7 Initiatives to reduce indirect energy consumption and reductions achieved. Figure 27ASPECT: WATER REFERENCE RULERCORE EN8 Total water withdrawal by source. Figure 1ADD EN9 Water sources significantly affected by withdrawal of water. Figure 1ADD EN10 Percentage and total volume of water recycled and reused. Figure 1ASPECT: BIODIVERSITY REFERENCE RULERCORE EN11 Location and size of land owned, leased, managed in, or adjacent to, protected areas and areas of high biodiversity value outsideprotected areas.CORE EN12 Description of significant impacts of activities, products and services on biodiversity in protected areas and areas of high biodiversity valueoutside protected areas.Figure 25Figure 26ADD EN13 Habitats protected or restored. Figure 25ADD EN14 Strategies, current actions and future plans for managing impacts on biodiversity. Figure 25 4a to cADD EN15 Number of IUCN Red List species and national conservation list species with habitats in areas affected by operations, by levelof extinction risk.109
WATERCARE SERVICES LIMITED <strong>ANNUAL</strong> <strong>REPORT</strong> <strong>2010</strong>G3 Cross-Reference Table continuedENVIRONMENTAL INDICATORS (CONTINUED)ASPECT: emissions, effluents and waste REFERENCE RULERCORE EN16 Total direct and indirect greenhouse gas emissions by weight. Figure 11 1aCORE EN17 Other relevant indirect greenhouse gas emissions by weight. Figure 11 1aADD EN18 Initiatives to reduce greenhouse gas emissions and reductions achieved. Figure 12 1aCORE EN19 Emissions of ozone-depleting substances by weight. Figure 11 1aCORE EN20 NO, SO, and other significant air emissions by type and weight. Figure 13 1aCORE EN21 Total water discharge by quality and destination. Figure 21 3eCORE EN22 Total weight of waste by type and disposal method. Figure 20,Figure 233b + dCORE EN23 Total number and volume of significant spills. Figure 34,Figure 36,Figure 37ADD EN24 Weight of transported, imported, exported or treated waste deemed hazardous under the terms of the Basel Convention Annexes I,II, III, and VIII, and percentage of transported waste shipped internationally.ADD EN25 Identity, size, protected status and biodiversity value of water bodies and related habitats significantly affected by the reportingorganisation’s discharges of water and run-off.Figure 24Figure 213d3eASPECT: products and services REFERENCE RULERCORE EN26 Initiatives to mitigate environmental impacts of products and services, and extent of impact mitigation. Page 6, Page 7CORE EN27 Percentage of products sold and their packaging materials that are reclaimed by category. Figure 19ASPECT: compliance REFERENCE RULERCORE EN28 Monetary value of significant fines and total number of non-monetary sanctions for non-compliance with environmental laws andregulations.Figure 5112aASPECT: TRANSPORT REFERENCE RULERADD EN29 Significant environmental impacts of transporting products and other goods and materials used for the organisation’s operations,and transporting members of the workforce.ASPECT: OVERALL REFERENCE RULERADD EN30 Total environmental protection expenditures and investments by type. Pages 62-102LABOUR PRACTICES AND DECENT WORK INDICATORSASPECT: emPLOYMENT REFERENCE RULERCORE LA1 Total workforce by employment type, employment contract and region. Figure 46CORE LA2 Total number and rate of employee turnover by age group, gender and region. Page 36,Figure 40,Figure 43ADD LA3 Benefits provided to full-time employees that are not provided to temporary or part-time employees, by major operations. Figure 46ASPECT: LABOUR/MANAGEMENT RELATIONS REFERENCE RULERCORE LA4 Percentage of employees covered by collective bargaining agreements. Figure 46CORE LA5 Minimum notice period(s) regarding operational changes, including whether it is specified in collective agreements. Figure 46ASPECT: OCCUPATIONAL HEALTH AND SAFETY REFERENCE RULERADD LA6 Percentage of total workforce represented in formal joint management–worker health and safety committees that help monitor andadvise on occupational health and safety programmes.Figure 39CORE LA7 Rates of injury, occupational diseases, lost days, and absenteeism, and number of work-related fatalities by region. Figure 38,Figure 39,Figure 41,Page 35CORE LA8 Education, training, counselling, prevention and risk-control programmes in place to assist workforce members, their families orcommunity members regarding serious diseases.Figure 39ADD LA9 Health and safety topics covered in formal agreements with trade unions. Figure 39110
G3 Cross-Reference Table continuedWATERCARE SERVICES LIMITED <strong>ANNUAL</strong> <strong>REPORT</strong> <strong>2010</strong>LABOUR PRACTICES AND DECENT WORK INDICATORS (CONTINUED)ASPECT: TRAINING AND EDUCATION REFERENCE RULERCORE LA10 Average hours of training per year per employee by employee category. Page 37ADD LA11 Programmes for skills management and lifelong learning that support the continued employability of employees and assist them inmanaging career endings.Figure 469aADD LA12 Percentage of employees receiving regular performance and career development reviews. Figure 46CORE LA13 Composition of governance bodies and breakdown of employees per category according to gender, age group, minority groupmembership and other indicators of diversity.Figure 44CORE LA14 Ratio of basic salary of men to women by employee category. Figure 44HUMAN RIGHTS INDICATORSASPECT: INVESTMENT AND PROCUREMENT PRACTICES REFERENCE RULERCORE HR1 Percentage and total number of significant investment agreements that include human rights clauses or that have undergonehuman rights screening.Figure 44CORE HR2 Percentage of significant suppliers and contractors that have undergone screening on human rights and actions taken. Figure 60,Page 54ADD HR3 Total hours of employee training on policies and procedures concerning aspects of human rights that are relevant to operations,including the percentage of employees trained.Figure 429aASPECT: NON-DISCRIMINATION REFERENCE RULERCORE HR4 Total number of incidents of discrimination and actions taken. Figure 44 9cASPECT: FREEDOM OF ASSOCIATION AND COLLECTIVE BARGAINING REFERENCE RULERCORE HR5 Operations identified in which the right to exercise freedom of association and collective bargaining may be at significant risk, andactions taken to support these rights.Figure 44ASPECT: CHILD LABOUR REFERENCE RULERCORE HR6 Operations identified as having significant risk for incidents of child labour, and measures taken to contribute to the elimination ofchild labour.Figure 44ASPECT: FORCED AND COMPULSORY LABOUR REFERENCE RULERCORE HR7 Operations identified as having significant risk for incidents of forced or compulsory labour, and measures to contribute to theelimination of forced or compulsory labour.Figure 44ASPECT: TRAINING AND EDUCATION REFERENCE RULERADD HR8 Percentage of security personnel trained in the organisation’s policies or procedures concerning aspects of human rights that arerelevant to operations.Figure 44ASPECT: INDIGENOUS RIGHTS REFERENCE RULERADD HR9 Total number of incidents of violations involving rights of indigenous people and actions taken. Figure 44 9cSOCIETY INDICATORSASPECT: COMMUNITY REFERENCE RULERCORE SO1 Nature, scope, and effectiveness of any programmes and practices that assess and manage the impacts of operations oncommunities, including entering, operating and exiting.Figure 4910aASPECT: CORRUPTION REFERENCE RULERCORE SO2 Percentage and total number of business units analysed for risks related to corruption. Figure 57CORE SO3 Percentage of employees trained in organisation’s anti-corruption policies and procedures. Figure 57CORE SO4 Actions taken in response to incidents of corruption. Figure 57ASPECT: PUBLIC POLICY REFERENCE RULERCORE SO5 Public policy positions and participation in public policy development and lobbying. Figure 50 11aADD SO6 Total value of financial and in-kind contributions to political parties, politicians, and related institutions by country. Figure 50ASPECT: ANTI-COMPETITIVE BEHAVIOUR REFERENCE RULERADD SO7 Total number of legal actions for anti-competitive behaviour and anti-trust and monopoly practices and their outcomes. Figure 51 12aASPECT: COMPLIANCE REFERENCE RULERCORE SO8 Monetary value of significant fines and total number of non-monetary sanctions for non-compliance with lawsand regulations.Figure 5112a111
WATERCARE SERVICES LIMITED <strong>ANNUAL</strong> <strong>REPORT</strong> <strong>2010</strong>G3 Cross-Reference Table continuedPRODUCT RESPONSIBILITY PERFORMANCE INDICATORSASPECT: CUSTOMER HEALTH AND SAFETY REFERENCE RULERCORE PR1 Life cycle stages in which health and safety impacts of products and services are assessed for improvement, and percentageof significant products and services categories subject to such procedures.ADD PR2 Total number of incidents of non-compliance with regulations and voluntary codes concerning health and safety impacts ofproducts and services during their life cycle, by type of outcomes.Figure 55Figure 5113aASPECT: PRODUCT AND SERVICE LABELLING REFERENCE RULERCORE PR3 Type of product and service information required by procedures, and percentage of significant products and services subject tosuch information requirements.ADD PR4 Total number of incidents of non-compliance with regulations and voluntary codes concerning product and service information andlabelling, by type of outcomes.Figure 56Figure 5112aADD PR5 Practices related to customer satisfaction, including results of surveys measuring customer satisfaction. Figure 54,Page 4713aASPECT: MARKETING COMMUNICATIONS REFERENCE RULERCORE PR6 Programmes for adherence to laws, standards, and voluntary codes related to marketing communications, including advertising,promotion and sponsorship.ADD PR7 Total number of incidents of non-compliance with regulations and voluntary codes concerning marketing communications, includingadvertising, promotion and sponsorship by type of outcomes.Page 43Figure 5112aASPECT: CUSTOMER PRIVACY REFERENCE RULERADD PR8 Total number of substantiated complaints regarding breaches of customer privacy and losses of customer data. Figure 51ASPECT: COMPLIANCE REFERENCE RULERCORE PR9 Monetary value of significant fines for non-compliance with laws and regulations concerning the provision and use of products andservices.Figure 51Report Application LevelsUnder the G3 framework, annual reports are graded at three different levels(C, B and A) according to the extent to which the framework has been applied.<strong>Watercare</strong>’s report has been self-declared.C C+ B B+ A A+MANDATORYSelfdeclaredOPTIONALThirdpartycheckedGRIchecked112
IndexWATERCARE SERVICES LIMITED <strong>ANNUAL</strong> <strong>REPORT</strong> <strong>2010</strong>Adopt A Stream ......................7, 41, 107Asset Management Plan (AMP) ...10, 10, 51, 52Atmospheric emissions ...................25Audit and Risk Committee .................16Biogas .......................... 1, 7, 25Biosolids .......................1, 2, 6, 27Board members. . . . . . . . . . . . . . . . . . . . . . . . .12Carbon footprint ..................5, 24, 25Chairman’s and Transition Chief Executive’s report. 8Companies Act 1993, The .................16Consumer Advisory Group .................21Customer Sevice ................45, 46, 108Energy .....................7, 24, 29, 109Environmental Advisory Group ............. 20Executive profiles ................... 14, 15Font, The .............................41Graduate Engineering Programme ............7Greenhouse gas emissions .................25Health and safety .......33-35, 103, 106, 110Hunua No. 4 Watermain .............2, 6, 50Hydroelectric generation ...................7Interflow ..............................41Laboratory services ..................... 46Legal compliance ...................... 43Local Government Acts, The ................16Local Network Operators (LNOs) ..... IFC, 2, 46Lost-time injuries ...................35, 106Maintenance OptimisationDesign (MOD) ......................... 53Maori Advisory Group. . . . . . . . . . . . . . . . . . . . .19Midges .............................7, 30Odours .............................7, 30Overflows ............................ 30Procurement .......................58, 59Project Hobson .................2, 6, 10, 50Project Improve ......................7, 103Puketutu Island .................2, 6, 11, 27Rain Forest Express ................ 7, 40, 41Recreational facilities .....................41Recycling. . . . . . . . . . . . . . . . . . . . . . . . . . . . . .26Reliability Centred Maintenance ......6, 53, 104Shareholders’ Representative Group ...... 16, 17Staff training ...........................37Staff turnover ......................... 36Staff wellness ......................... 36Stakeholder materiality matrix ...............4Statement of Corporate Intent ..............16Three Waters ...................2, 6, 20, 52Tikanga Maori ......................... 54Trade waste .....................26, 42, 46Trees For Survival ........................7Ultraviolet (UV) disinfection ................27Waikato Rivercare .....................7, 28Wastewater system ......................51Water demand management .............6, 7,Water Services Associationof Australia (WSAA) ................. 51, 103Water supply system ......................1Zero Waste ............................26IFC = Inside Front CoverGlossaryAnaerobic digestersAnnual Water Quality ReportAsset Management PlanBiogasBiosolidsCarbon footprintEnergy FocusG3Greenhouse gasesMaintenance OptimisationDesign (MOD)A wastewater treatment process where acid-forming bacteria break down organic materials into organicacids which are in turn converted to methane and carbon dioxide gases.A report that outlines <strong>Watercare</strong>’s water quality performance for the financial year.A document that defines <strong>Watercare</strong>’s best engineering judgement of the revenue and capital investment requiredto maintain the integrity of its asset base over a 20-year period.A by-product of the wastewater process that is comprised of approximately 65 per cent methane.A treated solid by-product of the wastewater treatment process.A measure of the impact of activities on the environment in terms of the amount of greenhouse gases produced,measured in units of carbon dioxide.A programme overseeing all energy improvement initiatives in <strong>Watercare</strong>.Version three of the Global Reporting Initiative guidelines for sustainability reporting. For more information,see page 106.Gases that trap heat in the atmosphere. Examples of greenhouse gases are methane, perflurocarbons and nitrous oxide.An analytical approach to determine the likelihood and consequence of equipment failure.Project One Project to manage integration of regional water and wastewater services in <strong>2010</strong>.Reactor clarifierReliability-centred maintenance(RCM)Trade wasteUltraviolet (UV) disinfectionWastewaterZero WasteA wastewater treatment process where activated sludge biologically removes organic pollutants from the wastewater stream.As well as separating solids and liquids, nitrogen is extracted and released in the form of a harmless gas.A framework which identifies the optimum time to maintain or replace assets based on operational performance,cost, health and safety, and the environment.Any discharge into a sewer in the course of an industrial or trade process.The use of ultraviolet light to kill viruses and bacteria in the wastewater.Liquid and solid matter discharged into the sewer network from domestic, commercial and industrial locations.<strong>Watercare</strong>’s project to minimise or eliminate waste throughout the company.113
For more information about <strong>Watercare</strong> please visit our website www.watercare.co.nz<strong>Watercare</strong> has been certified as meeting ISO 14001 and ISO 9001 for thecompany’s water, wastewater and trade waste operations. This includes itswater and wastewater treatment plants and networks. The company’s projectdelivery is certified as meeting ISO 9001 and its Laboratory Services iscertified as meeting ISO 17025.WATERCARE SERVICES LIMITEDREGISTRATION NUMBER: AK/519049REGISTERED OFFICE:2 Nuffield Street, NewmarketAuckland, Private Bag 92 521Wellesley Street, Auckland 1141Telephone: +64 9 539 7300Facsimile: +64 9 539 7334Email: communications@water.co.nzWebsite: www.watercare.co.nz