- Page 2: University of the District of Colum
- Page 6 and 7: University of the District of Colum
- Page 8 and 9: 2 UNIVERSITY OF TilE DISTRWr OF COL
- Page 10 and 11: 4 UNIVERSITY OF TilE DISTRICr OF CO
- Page 12 and 13: 6 UNIVERSITY OF TilE DISTIUcr OF CO
- Page 14 and 15: YES WE CAN, PASS THE BAR. UNIVERSIT
- Page 16 and 17: YES WE CAN, PASS THE BAR. 11In resp
- Page 18 and 19: YES WE CAN, PASS THE BAR. 13uated f
- Page 20 and 21: YES WE CAN. PASS THE BAR.The Univer
- Page 22 and 23: YES WE CAN, PASS THE BAR. 17C. Iden
- Page 24 and 25: YES WE CAN, PASS THE BAR. 19The Pro
- Page 26 and 27: YES WE CAN, PASS THE BAR. 21Accordi
- Page 28 and 29: YES WE CAN, PASS THE BAR. 23calcula
- Page 30 and 31: YES WE CAN, PASS THE BAR. 25The Ame
- Page 32 and 33: YES WE CAN, PASS THE BAR.ing the su
- Page 34 and 35: YES WE CAN, PASS THE BAR. 29writing
- Page 36 and 37: YES WE CAN, PASS THE BAR. 31tion, s
- Page 38 and 39: YES WE CAN, PASS THE BAR. 33activit
- Page 40 and 41: YES WE CAN, PASS THE BAR.35Table 2B
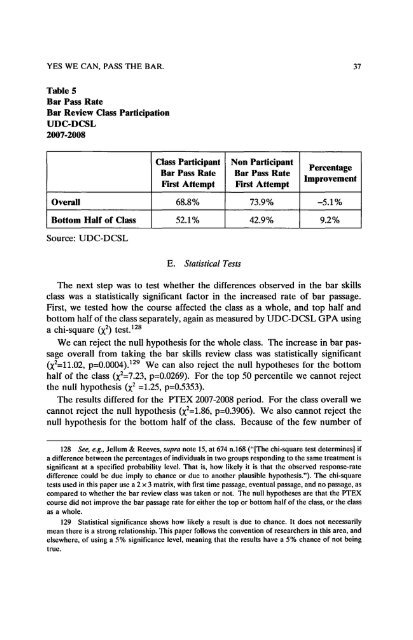
- Page 44 and 45: YES WE CAN, PASS THE BAR. 39(X 2 =4
- Page 46 and 47: YES WE CAN, PASS THE BAR.41ApPENDIX
- Page 48 and 49: 44 UNIVERSITY OF TilE DISTRICT OF C
- Page 50 and 51: 46 UNIVERSITY OF TilE DISTRICr OF C
- Page 52 and 53: 48 UNIVEI~SITY OF TilE DISTRICT OF
- Page 54 and 55: 50 UNIVm~SITY OF TilE DISTRICr (W C
- Page 56 and 57: 52 UNIVERSITY OF THE DISTIUCr OF CO
- Page 58 and 59: 54 UNIVERSITY OF TilE DISTRICI' OF
- Page 60 and 61: 56 UNIVERSITY OF TIlE DISTRICT OF C
- Page 62 and 63: 58 UNIVEI~SITY OF TilE DISTRICr OF
- Page 64 and 65: 60 UNIVERSITY OF TilE DISTRICT OF C
- Page 66 and 67: 62 UNIVERSITY OF TilE DISTRICT OF C
- Page 68 and 69: 64 UNIVERSITY OF THE DISTRICT OF CO
- Page 70 and 71: 66 UNIVERSITY OF TilE DISTRICI' OF
- Page 72 and 73: 68 UNIVERSITY OF TilE DISTRICr OF C
- Page 74 and 75: 70 UNIVERSITY OF THE DISTRICr OF CO
- Page 76 and 77: 72 UNIVERSITY OF THE DISTRICT OF CO
- Page 78 and 79: 74 UNIVERSITY OF TilE DISTRICT OF C
- Page 80 and 81: 76 UNIVERSITY OF TIlE DISTRICr OF C
- Page 82 and 83: 78 UNIVERSITY OF TilE DISTRICI" OF
- Page 84 and 85: 80 UNIVERSUY OF TIlE DISTRICT OF CO
- Page 86 and 87: 82 UNIVERsrrv OF TilE DISTRICT OF C
- Page 88 and 89: 84 UNIVERSITY OF TIlE DISTRICT OF C
- Page 90 and 91: 86 UNIVEHSITY OF TIlE DISTHICr OF C
- Page 92 and 93:
88 UNIVERSITY OF TIlE Disnucl' OF C
- Page 94 and 95:
90 UNIVERSITY OF TilE DISTRICT OF C
- Page 96 and 97:
92 UNIVERSITY OF TIlE DIS"IlUcr OF
- Page 98 and 99:
94 UNIVERSITY OF TIlE DISTRICr OF C
- Page 100 and 101:
96 UNIVERSITY OF TI IE DISTRICr OF
- Page 102 and 103:
98 UNIVERSITY OF TilE DISTRICr OF C
- Page 104 and 105:
100 UNIVERSITY OF TIlE DISTRICr OF
- Page 106 and 107:
102 UNIVERSITY OF TIlE DISTRICr OF
- Page 108 and 109:
104 UNIVERSITY OF TilE DISTRICr OF
- Page 110 and 111:
106 UNIVERSITY OF THE DISTIUCr OF C
- Page 112 and 113:
108 UNIVERSITY OF THE DISTRICr OF C
- Page 114 and 115:
110 UNIVERSITY OF TilE DISTRICr OF
- Page 116 and 117:
112 UNIVERSITY OF THE DISTRICT OF C
- Page 118 and 119:
A DISCUSSION ON THE DISTRICT OF COL
- Page 120 and 121:
IGNORING THE LAW FOR EXPEDIENCY'S S
- Page 122 and 123:
IGNORING THE LAW FOR EXPEDIENCY'S S
- Page 124 and 125:
IGNORING THE LAW FOR EXPEDIENCY'S S
- Page 126 and 127:
IGNORING THE LAW FOR EXPEDIENCY'S S
- Page 128 and 129:
IGNORING THE LAW FOR EXPEDIENCY'S S
- Page 130 and 131:
IGNORING THE LAW FOR EXPEDIENCY'S S
- Page 132 and 133:
IGNORING THE LAW FOR EXPEDIENCY'S S
- Page 134 and 135:
IGNORING THE LAW FOR EXPEDIENCY'S S
- Page 136 and 137:
134 UNIVEI{SITY OF TilE DISTRICT OF
- Page 138 and 139:
136 UNIVEI~SITY OF TIlE DISTRICT OF
- Page 140 and 141:
138 UNIVERSITY OF TilE DISTRICT OF
- Page 142 and 143:
140 UNIVERSITY OF TIlE DISTRIC(, OF
- Page 144 and 145:
142 UNIVERSITY OF TilE DISTRICf OF
- Page 146 and 147:
144 UNIVEHSITY OF TI IE DISTRICT OF
- Page 148 and 149:
146 UNIVEI~SITY OF TIlE DISTRICr OF
- Page 150 and 151:
148 UNIVERSITY OF TilE DISTRICr OF
- Page 152 and 153:
150 UNIVERSITY OF THE DISTRICT OF C
- Page 154 and 155:
152 UNIVERSITY OF TIlE DISTRICT OF
- Page 156 and 157:
154 UNIVEI~SITY OF THE DlsTRlcr OF
- Page 158 and 159:
156 UNIVERSITY OF TIlE DISTRICr OF
- Page 160 and 161:
158 UNIVEH.srrv OF THE DISTRICr OF
- Page 162 and 163:
160 UNIVERSITY OF TilE DISTIUcr OF
- Page 164 and 165:
162 UNIVERSITY OF TilE Dls'nucr OF
- Page 166 and 167:
164 UNIVERSITY OF TilE DISTRICr OF
- Page 168 and 169:
166 UNIVERSITY OF THE DISTRICr OF C
- Page 170 and 171:
168 UNIVERSfrY OF HIE DISTRICr OF C
- Page 172 and 173:
170 UNIVERSITY OF TilE DISTRICt' OF
- Page 174 and 175:
172 UNIVERSITY OF TilE DISTRICr OF
- Page 176 and 177:
174 UNIVEI{SITY OF THE DISTRICT OF
- Page 178 and 179:
176 UNIVERSITY OF TIlE DISTRICr OF
- Page 180 and 181:
178 UNIVEltSl'l'V OF THE DISTIUCI'
- Page 182 and 183:
180 UNIVERSITY OF TIlE DISTRICT (W
- Page 184 and 185:
182 UNIVERSITY OF TilE DISTRICT OF
- Page 186 and 187:
184 UNIVERSITY OF TilE DISTRICr OF
- Page 188 and 189:
186 UNIVERSITY OF THE DISTRICT OF C
- Page 190 and 191:
188 UNIVERSITY OF TilE DISTRICt' OF
- Page 192 and 193:
190 UNIVERSITY OF TIlE DISTRICT OF
- Page 194 and 195:
JURISPRUDENCE FOR A DIGITAL AGE: FR
- Page 196 and 197:
JURISPRUDENCE FOR A DIGITAL AGE 195
- Page 198 and 199:
JURISPRUDENCE FOR A DIGITAL AGE 197
- Page 200 and 201:
JURISPRUDENCE FOR A DIGITAL AGE 199
- Page 202 and 203:
JURISPRUDENCE FOR A DIGITAL AGE 201
- Page 204 and 205:
JURISPRUDENCE FOR A DIGITAL AGE 203
- Page 206 and 207:
JURISPRUDENCE FOR A DIGITAL AGE 205
- Page 208 and 209:
JURISPRUDENCE FOR A DIGITAL AGE 207
- Page 210 and 211:
THE CHILD ONLINE PRIVACY PROTECTION
- Page 212 and 213:
THE CHILD ONLINE PRIVACY PROTECTION
- Page 214 and 215:
THE CHILD ONLINE PRIVACY PROTECTION
- Page 216 and 217:
THE CHILD ONLINE PRIVACY PROTECTION
- Page 218 and 219:
THE CHILD ONLINE PRIVACY PROTECfION
- Page 220 and 221:
THE CHILD ONLINE PRIVACY PROTECTION
- Page 222 and 223:
THE CHILD ONLINE PRIVACY PROTECTION
- Page 224 and 225:
THE CHILD ONLINE PRIVACY PROTECTION
- Page 226 and 227:
THE RUCKUS IN THE CAUCASUS:A CASE A
- Page 228 and 229:
THE RUCKUS IN THE CAUCASUS 227under
- Page 230 and 231:
THE RUCKUS IN THE CAUCASUS 229ual,
- Page 232 and 233:
THE RUCKUS IN THE CAUCASUS 231Day c
- Page 234 and 235:
THE RUCKUS IN THE CAUCASUS 233who,
- Page 236 and 237:
THE RUCKUS IN THE CAUCASUS 235sions
- Page 238 and 239:
THE RUCKUS IN THE CAUCASUS 237Omars
- Page 240 and 241:
THE RUCKUS IN THE CAUCASUS 239ment.
- Page 242 and 243:
242 UNIVERSITY OF TilE DISTRICr OF
- Page 244 and 245:
244 UNIVERSfl"Y OF TIlE DISTRICT OF
- Page 246 and 247:
246 UNIVI ~ I(SITY 01 ' TI l E DIST
- Page 248 and 249:
248 UNIVERSITY OF TIlE DISTRICT OF
- Page 250 and 251:
250 UNIVERSITY OF TIlE DISTRICr OF
- Page 252 and 253:
252 UNIVERSITY OF THE DISTRICT OF C
- Page 254 and 255:
254 UNIVERSITY OF TilE DISTRICr OF
- Page 256 and 257:
256 UNIVERSITY OF nlE DIS'IlUCT OF
- Page 258 and 259:
258 UNIVERSITY OF TIlE DISTIUcr OF
- Page 260:
260 UNIVERSITY OF TilE DISTRICr OF