Second Quarter 2012 Results - Entel
Second Quarter 2012 Results - Entel
Second Quarter 2012 Results - Entel
- No tags were found...
You also want an ePaper? Increase the reach of your titles
YUMPU automatically turns print PDFs into web optimized ePapers that Google loves.
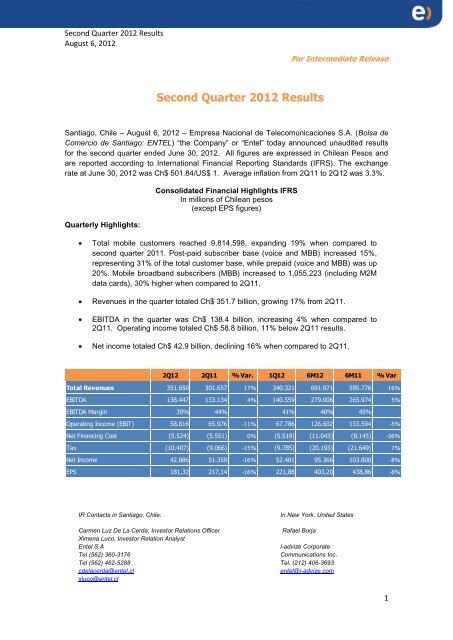
<strong>Second</strong> <strong>Quarter</strong> <strong>2012</strong> <strong>Results</strong>August 6, <strong>2012</strong>For Intermediate Release<strong>Second</strong> <strong>Quarter</strong> <strong>2012</strong> <strong>Results</strong>Santiago, Chile – August 6, <strong>2012</strong> – Empresa Nacional de Telecomunicaciones S.A. (Bolsa deComercio de Santiago: ENTEL) “the Company” or “<strong>Entel</strong>” today announced unaudited resultsfor the second quarter ended June 30, <strong>2012</strong>. All figures are expressed in Chilean Pesos andare reported according to International Financial Reporting Standards (IFRS). The exchangerate at June 30, <strong>2012</strong> was Ch$ 501.84/US$ 1. Average inflation from 2Q11 to 2Q12 was 3.3%.<strong>Quarter</strong>ly Highlights:Consolidated Financial Highlights IFRSIn millions of Chilean pesos(except EPS figures)Total mobile customers reached 9,814,598, expanding 19% when compared tosecond quarter 2011. Post-paid subscriber base (voice and MBB) increased 15%,representing 31% of the total customer base, while prepaid (voice and MBB) was up20%. Mobile broadband subscribers (MBB) increased to 1,055,223 (including M2Mdata cards), 30% higher when compared to 2Q11.Revenues in the quarter totaled Ch$ 351.7 billion, growing 17% from 2Q11.EBITDA in the quarter was Ch$ 138.4 billion, increasing 4% when compared to2Q11. Operating income totaled Ch$ 58.8 billion, 11% below 2Q11 results.Net income totaled Ch$ 42.9 billion, declining 16% when compared to 2Q11.2Q12 2Q11 % Var. 1Q12 6M12 6M11 % VarTotal Revenues 351.650 301.657 17% 340.321 691.971 595.776 16%EBITDA 138.447 133.134 4% 140.559 279.006 265.974 5%EBITDA Margin 39% 44% 41% 40% 45%Operating Income (EBIT) 58.816 65.976 -11% 67.786 126.602 133.594 -5%Net Financing Cost (5.524) (5.551) 0% (5.519) (11.043) (8.145) -36%Tax (10.407) (9.066) -15% (9.785) (20.193) (21.649) 7%Net Income 42.886 51.359 -16% 52.481 95.366 103.800 -8%EPS 181,32 217,14 -16% 221,88 403,20 438,86 -8%IR Contacts in Santiago, Chile:In New York, United StatesCarmen Luz De La Cerda, Investor Relations OfficerRafael BorjaXimena Luco, Investor Relation Analyst<strong>Entel</strong> S.Ai-advize CorporateTel (562) 360-3176Communications Inc.Tel (562) 462-5288 Tel. (212) 406-3693cdelacerda@entel.clentel@i-advize.comxluco@entel.cl1
<strong>Second</strong> <strong>Quarter</strong> <strong>2012</strong> <strong>Results</strong>August 6, <strong>2012</strong>Comments from the Chief Financial Officer:The local economy grew at a healthy pace during the quarter, with certain moderationvis-a-vis prior quarters. Within this scenario, the mobile market continued to expand.Revenue rose 17% during the quarter, with all segments growing at double digit figures.Main contributors to growth were mobile, data services (including TI) and networkrentals.EBITDA increased 4%, led by Network Rentals, the Consumers segment andAmericatel Perú.Net Income declined 16%, principally driven by lower operating income (-11%) due tohigher depreciation, in-line with postpaid customer base growth.Note: Please see an accompanying presentation at www.entel.cl, within the “Investors”section for additional information.This document contains certain “forward-looking statements” which are based on management’s expectations as well as on a number ofassumptions concerning future events resulting from currently available information. Readers are cautioned not to put undue reliance onsuch forward-looking statements, which are not a guarantee of performance and are subject to a number of uncertainties and otherfactors, many of which are out of <strong>Entel</strong>’s control, which could cause actual results to materially differ from such statements.2
<strong>Second</strong> <strong>Quarter</strong> <strong>2012</strong> <strong>Results</strong>August 6, <strong>2012</strong>MAIN BUSINESS OPERATIONAL FIGURESMobile Subscribers (in thousands)Mobile ARPU (in thousands $)Mobile MOU (in minutes)Mobile Churn (%)% Mobile Data / Postpaid BaseFixed Lines in Services (in thousands)Domestic Long Distance Traffic(in million of minutes)International Long Distance Traffic(in million of minutes)3
<strong>Second</strong> <strong>Quarter</strong> <strong>2012</strong> <strong>Results</strong>August 6, <strong>2012</strong>Consolidated Revenue(in millions of Chilean Pesos)Total RevenuesMobile servicesData services (includes IT)Local telephony (includes NGN-IP)2Q12 2Q11 % Var. 1Q12 6M12 6M11 % Var351,650 301,657 17% 340,321 691,971 595,776 16%275,153 235,412 17% 271,011 546,164 464,163 18%26,112 23,156 13% 24,418 50,530 45,016 12%10,348 10,696 -3% 9,675 20,023 20,482 -2%Long distance 7,935 7,460 6% 8,241 16,175 16,146 0%InternetOther telecommunication companiesTraffic businessAmericatel PerúCall Center services and othersOthers Revenues - Non core (1)4,252 4,193 1% 4,126 8,378 8,288 1%5,976 4,910 22% 5,313 11,289 9,420 20%9,912 6,990 42% 8,079 17,991 14,352 25%5,227 4,525 16% 5,267 10,494 9,179 14%3,055 2,317 32% 2,717 5,772 4,650 24%3,680 1,998 84% 1,474 5,155 4,080 26%Consolidated revenues during the quarter reached Ch$ 351.7 billion, up 17% when comparedto 2Q11 figures. This expansion was a result of a) 17% increase in mobile services driven byservice revenues growth (+17%) derived from strong average customer base evolution (+21%)combined with a reduction in blended ARPU (-4%). Also, equipment sales revenue increased26% principally in prepaid (voice) due to higher tier handsets sold during the quarter. Customerbase grew strongly both in voice (+17%) and mobile broadband (including M2M data cards),which expanded 30% when compared to 2Q11. Revenues from monthly fixed service grew26% due to strong adoption of postpaid multimedia plans that include data usage, while VAS(+21% including MBB) also continued to grow in-line with higher data activity, chiefly in theConsumers segment. Blended ARPU placed a reduction of 4% mostly explained by lower voicerevenues in the prepaid Consumers segment. MOU was almost flat. The blended churn ratewas 3.24%, an increase compared to the 2.16% reported in 2Q11, principally attributable toprepaid due to heavy industry promotions carried out in past quarters, b) data services rose13% primarily due to outsourced datacenter IT services, followed by integrated solutions overMPLS-IP networks offered to the Corporate & SME segment, c) 42% increase in the trafficbusiness largely sustained by higher traffic in wholesale, partially offset by lower average tariffs,d) other telecommunication companies posted a 22% increase, mainly aligned with higherinfrastructure rentals to fixed line operators and new services provided to other mobileoperators, e) call center and others rose 32%, mainly supported by higher activity in both Perúand Chile, f) 16% increase in Americatel Perú, mostly attributable to an increase in the averageCH$/Peruvian Soles (+ 11%). In local currency, revenues grew 3%, fueled by integratedservices in the enterprise segment (including voice, data and Internet), partially offset by adecline in wholesale and LD revenues, g) 6% growth in LD due to an increase in ILD in partoffset by lower revenues in DLD, h) Other Revenues (Non-Core) increased mainly associatedwith site rental revenues to third parties operators. These increases were partially offset by: a)a 3% reduction in local telephony attributed to a decline in the Consumers segment impacted bya decline in lines in services.Revenues in the first half <strong>2012</strong> increased 16% when compared to the same period 2011.(1) Other revenues (Non-core): revenues which are not a part of the Company´s core business include gains/(losses) in sales of fixed assets andinterest accrued on past due invoices.4
<strong>Second</strong> <strong>Quarter</strong> <strong>2012</strong> <strong>Results</strong>August 6, <strong>2012</strong>Consolidated Cost of Operations(in millions of Chilean Pesos)2Q12 2Q11 % Var. 1Q12 6M12 6M11 % VarCost of OperationsAccess charges & Payments to corresp.Salaries and expenses292,834 235,681 24% 272,535 565,369 462,181 22%52,229 44,535 17% 51,230 103,459 88,310 17%34,742 30,801 13% 32,006 66,748 60,852 10%Outsourced, Supplies and Equipment Services 7,764 5,486 42% 7,392 15,156 11,952 27%Bad debt provisions 10,946 8,193 34% 10,290 21,236 13,830 54%Advertising, Sales commissions & expenses 53,081 40,127 32% 48,127 101,208 76,481 32%Depreciation, amortization and ImpairmentOthers79,631 67,158 19% 72,773 152,404 132,379 15%54,441 39,381 38% 50,717 105,158 78,377 34%Consolidated cost of operations during the quarter totaled Ch$ 292.8 billion, increasing 24%compared to 2Q11. This increase was a result of: a) 32% increase in advertising, salescommissions and sales expenses, mostly related to mobile prepaid equipment sales costs inthe Consumers segment, impacted by higher valued handsets, coupled with non-recurringcharges of Ch$2.9 billion. In addition, advertising costs were up, related to the <strong>Entel</strong> Visa cardlaunched in 4Q11, while sales commissions increased across all segments, aligned with thecustomer base expansion, b) Depreciation, Amortization and Impairments grew 19%, especiallydriven by postpaid handsets in the mobile business, associated with deeper smartphonepenetration and customer base growth, and to a lesser extent, due to higher depreciation fromnetwork infrastructure and IT projects, c) 12% higher access charges and payments tocorrespondents, mainly supported by higher mobile traffic in all segments as a result of thecustomer base expansion and higher activity in the traffic business. This increase was partiallyoffset by Americatel Perú associated with a reduction in access charge rates for local telephonyservices, which took place in 1Q12, coupled with lower traffic in the LD and wholesalebusiness, d) salaries and expenses increased 13% due to inflation adjustments in salaries,headcount increases to meet demand and in call centers due to higher business activity in bothPerú and Chile, e) bad debt increased 34%, basically in mobile services driven by higherrevenues across all segments together with increased penetration in the middle and low incomesegments in Consumers, f) Outsourced, supplies and equipment services grew 42%, principallyin the Consumers segment related to higher demand and customer service, together with higherdata/IT services costs in the Corporate & SME segment to meet new contracts, g) other costsrose 38%, tied to network and site rentals, consultancy, maintenance and energy, as well as theabsence of a one-time benefit accrued in 2Q11 related to VAS services.Cost of operations in the first six months <strong>2012</strong> increased 22%.EBITDA and Operating IncomeDerived from the aforementioned results, EBITDA during the quarter was Ch$ 138.4 billion, a4% increase when compared to the Ch$ 133.1 billion reported in 2Q11. This increase wasbasically generated by progress in Network Rentals (including traffic business), and to a lesserextent, the Consumers segment, Americatel Perú and Call Centers.5
<strong>Second</strong> <strong>Quarter</strong> <strong>2012</strong> <strong>Results</strong>August 6, <strong>2012</strong>EBITDA margin in 2Q12 was 39%, lower than the 44% posted in 2Q11. Operating income in thequarter totaled Ch$ 58.8 billion, declining 11% when compared to 2Q11 figures, mainly due toincreased mobile equipment depreciation associated with higher penetration of high-endhandsets (smartphones) along with the postpaid customer base expansion.For the first half <strong>2012</strong>, EBITDA increased 5%, while Operating Income declined 5%. EBITDAmargin reached 40%, a decrease from the 45% reported in the same period 2011.Financial Expenses <strong>Results</strong>Net Financing Cost and OthersNet Financial ExpensesForeign Exchange Fluctuation & Readjustment2Q12 2Q11 % Var. 1Q12 6M12 6M11 % Var(5.524) (5.551) 0% (5.519) (11.043) (8.145) -36%(2.345) (1.623) -44% (2.282) (4.627) (2.883) -60%(3.178) (3.928) 19% (3.238) (6.416) (5.262) -22%Net Financing Costs and Others in 2Q12 totaled a Ch$ 5.5 billion loss, flat when compared to2Q11. This was attributable to lower price level restatements due to lower inflation, offset byincreased net interest expenses, in-line with lower interest income driven by lower average cashinvested, coupled with higher interest expenses due to increased Libor rate.Net IncomeNet Income in the period was Ch$ 42.9 billion, a reduction when compared to the Ch$ 51.4billion reported in 2Q11, impacted by lower operating results and a higher effective tax rate.For the first half <strong>2012</strong>, Net Income declined 8%, reaching Ch$ 95.4 billion compared to 2011.6
<strong>Second</strong> <strong>Quarter</strong> <strong>2012</strong> <strong>Results</strong>August 6, <strong>2012</strong>BUSINESS DEVELOPMENT BY SEGMENTSNew reporting segmentsAs part of the integration process undertaken last year, <strong>Entel</strong>’s financial reporting has beenaligned with the new business structure. As of January <strong>2012</strong>, segment reporting is based oncustomer segments: Consumers, Corporate and SME, Network Rentals (including trafficbusiness), Call Center Services and Other Revenues, and Americatel Perú. The prior-yearfigures have been recalculated under this new segmentation, using drivers for certain costaccounts.The Company has made further adjustments to the drivers applied to 2011 results, impactingthe reported numbers in 1Q11 (attachment 1).Segments Operational 2Q12 2Q11 % Chg. 1Q12 6M12 6M11 % Chg.ConsumersRevenue 208.987 176.967 18% 208.232 417.219 351.339 19%EBITDA 67.219 66.294 1% 75.049 142.268 136.217 4%EBITDA MG (%) 32% 37% 36% 34% 39%Corporate and SMERevenue 117.085 105.646 11% 111.494 228.580 205.454 11%EBITDA 44.796 45.234 -1% 42.387 87.183 85.971 1%EBITDA MG (%) 38% 43% 38% 38% 42%Networks rentals (including trafficbusiness), Call Center & OthersRevenue 60.578 50.901 19% 54.464 115.042 99.905 15%EBITDA 25.560 21.180 21% 22.184 47.744 42.866 11%EBITDA MG (%) 42% 42% 41% 42% 43%Americatel PerúRevenue 5.498 4.793 15% 5.373 10.870 9.738 12%EBITDA 896 444 102% 959 1.855 940 97%EBITDA MG (%) 18% 10% 18% 17% 10%Adjustments and EliminationsRevenue -40.498 -36.650 10% -39.242 -79.741 -70.661 13%EBITDA -24 -18 35% -20 -44 -21 109%Consolidated <strong>Results</strong>Revenue 351.650 301.657 17% 340.321 691.971 595.776 16%EBITDA 138.447 133.134 4% 140.559 279.006 265.974 5%EBITDA MG (%) 39% 44% 41% 40% 45%EBIT 58.816 65.976 -11% 67.786 126.602 133.594 -5%EBIT MG (%) 17% 22% 20% 18% 22%7
<strong>Second</strong> <strong>Quarter</strong> <strong>2012</strong> <strong>Results</strong>August 6, <strong>2012</strong>Consumers Segment (includes Residential)Consumers Segment revenue expanded 18% Revenue Distributioncompared to 2Q11. The increase was a result ofconsistent growth in mobile services, especially2%driven by service revenues (+19%), stimulated bysolid customer base (+19%) expansion. Inaddition, equipment sales grew (+24%) driven byprepaid sales. The customer base reached98%8,670,792, up 19% when compared to 2Q11,The total MBB continued to grow (+30%) drivenby prepaid, aligned with the Company´s strategyMobile Services Fixed Servicesto strongly grow data services. The Company continued to capture clients’ preference, withmarket share over 40%, well above the 38% figure reported in 2Q11.After approximately six months, the status of mobile number portability has had a minor impacton the industry, with migrated users representing less than 2% of the total industry base. TheCompany’s figure was a net loss of 23 thousand subscribers, while displaying positive trendswith regards to capturing high-end customers.<strong>Entel</strong> remains fully focused on delivering value to customers through better user experiencesand higher quality infrastructure. Thus, during the quarter, the Company continued to stronglyadvocate "smartphone" device penetration especially in the postpaid segment, with promotionsthrough the purchase of multimedia plans. Additionally, through exclusive customer presales,the Company launched new smartphone devices such as the HTC-One (quadcore) and theSamsung SIII.This allowed faster advances in the introduction of data plans as of June <strong>2012</strong>, with 35%penetration over the postpaid base, well above the 22% achieved in 2Q11.In the prepaid segment, the Company also delivered strong sales in data plans through mobilebroadband and mobile Internet. Through market offers in the prepaid segment, <strong>Entel</strong>´s clientscan also access high-value handsets such as the iPhone 3G with special offers at big retailers.Lastly, Consumers segment local telephony and Internet services revenues declined, principallyrelated to a reduction in the customer base, partially offset by higher LD services revenue, inlinewith traffic and tariff improvements in ILD services.EBITDA in the quarter increased 1%, totaling Ch$ 67.2 billion compared to the Ch$ 66.3 billion in2Q11. This improvement was the result of direct service margin expansion in mobile (+17%), mainlybased on solid customer expansion and data services adoption. On the other hand, and almostcompletely offsetting these affects, were lower equipment sales margins in the prepaid segment andhigher SG&A expenses. Service margins grew in-line with the strong evolution of the client base,while acquisition costs, one time charges and expenses to meet high market activity impactedequipment sales margins and SG&A. EBITDA margin for the quarter was 32%, lower than the 37%reported in 2Q11For the first six-month <strong>2012</strong> period, EBITDA reached Ch$ 142.3 billion, 4% growth compared to thesame period in 2011. EBITDA margin was 34%, down from the 39% in first half 2011.___________________________8
<strong>Second</strong> <strong>Quarter</strong> <strong>2012</strong> <strong>Results</strong>August 6, <strong>2012</strong>Corporate and SME SegmentCorporate and SME segmentrevenues in the quarter grew 11%,mainly determined by mobile servicesdriven by the customer baseexpansion, which for the quarterreached 1,143,806 (+16%), coupledwith data services penetration. Fixedservices also increased, resultingfrom higher IT and integratedsolutions over MPLS-IP network andLD due to higher tariffs in ILD. Localtelephony declined due to lowertraffic.Revenue DistributionEBITDA in the quarter reached Ch$ 44.8 billion, decreasing 1% when compared to 2Q11figures. This was the result of lower margins in fixed line services related to local telephony anddata (including IT). On the other hand, EBITDA from the mobile services improved as aconsequence of higher direct margins in both service and equipment sales, while mobile SG&Aexpenses rose. EBITDA margin in 2Q12 was 38%, a decline when compared to the 43%reported in 2Q11.For the first half <strong>2012</strong>, EBITDA was Ch$ 87.2 billion, an increase of 1% compared to 2011.EBITDA margin reached 38%, below the 42% reported in 2011.<strong>Entel</strong> is a leader in the supply of fixed-mobile offering for businesses, providing connectivityservices for voice, data and IT to leverage companies’ productivity. Along these lines, theCompany reached an agreement with SAP, the first operator of SAP mobility applications inLatin America. Customers can access from anywhere business applications on mobile devicesto facilitate working models and optimize labor management.In addition, <strong>Entel</strong> introduced new business management tools to facilitate the collection of fielddata (filling out forms in real time, sales, inspections, audits, surveys and reports), through any"smartphone" connected to mobile Internet, rapidly deployable and operating via ‘cloud’technology.During July, the fifth <strong>Entel</strong> Summit was held, one of the most important meetings for Innovation,Technology and Business in Chile. This event’s aim is to create a vision and tools that enablecompanies to enhance business, create value and leverage companies’ competitiveadvantages. This year presented trends in connectivity, mobility, virtualization and cloudcomputing technologies that impact people’s lives and redefine the way business is done. Mr.Steve Wozniak, co-founder of Apple, was the keynote speaker.During the quarter, the following contracts were signed, among others:DEFENSORIA PENAL PUBLICA (Public Defender, public institution supervised by theJustice Ministry): The contract will provide connectivity to 80 branches throughout Chile,including the provisioning of integrated solutions for voice, data and Internet, in additionto the operation and support of a telecommunication data center, including local areanetworks, security SOC and wireless (Wi-Fi) services. In terms of connectivity, fixedmobileconvergence services and full HD videoconference are also included in thecontract.9
<strong>Second</strong> <strong>Quarter</strong> <strong>2012</strong> <strong>Results</strong>August 6, <strong>2012</strong>COMPAÑIA CHILENA DE TABACOS (Subsidiary of British American Tabacco Co.):this agreement will provide end user IT solutions including desktops and technical helpdesks with onsite support, in addition to IT service server operations.PODER JUDICIAL (Chilean Department of Justice): <strong>Entel</strong> will add to its current serviceagreement with over 40 new telecommunications links, in addition to 400 points alreadyin service.___________________________Network Rentals (including traffic business),Call Center and OthersRevenue DistributionRevenues were 19% higher in the quarter,combined with increased revenues in the low margintraffic business associated with higher wholesale10%traffic, partially offset by lower tariffs. Network14%Rentals revenue also expanded in infrastructure76%rentals to related parties and to other fixed andmobile operators. Early this year, the Companybegan to operate a roaming and transportNetwork rentals Call Center Othersagreement with Nextel Chile. Call center revenuerose in Perú and Chile driven by new clients and higher activity associated with the current clientbase.EBITDA reached Ch$ 25.6 billion, expanding 21% when compared to 2Q11, principally driven byhigher margins in the Network Rentals business to related companies and services provided to othermobile and fixed operators. Also, Call Center operations in Chile and Perú grew. EBITDA marginreached 42%, flat when compared to last year.In first half <strong>2012</strong>, EBITDA was Ch$ 47.7 billion, 11% higher when compared to 2011. EBITDAmargin declined to 42% from the 43% reported in 2Q11.____________________________10
<strong>Second</strong> <strong>Quarter</strong> <strong>2012</strong> <strong>Results</strong>August 6, <strong>2012</strong>Americatel PerúAmericatel Perú posted an increase in revenues of3% in local currency, mainly attributable to datacomin the enterprise segment, including IP integratedsolutions (voice, data and internet) and satelliteservices. This was partially offset by lowerwholesale revenue tied to lower tariffs. In addition,LD revenue declined, mainly due to lower traffic inboth ILD and DLD, partially offset by higherrevenues in ILD from mobile.<strong>Quarter</strong>ly RevenuesIn thousand US$ (Peruvian Soles divided by 2.66)10.669 3%10.9702.6453.0474.9772.4942.5725.9032Q112Q12Data, Local & NGN Wholesale LDDuring the quarter, operating costs and expenses declined 3% compared to 2Q11. Thereductions were mainly due to access charges and payment to correspondents linked to areduction in local telephony access charges, which became effective in 1Q12, and loweraverage tariffs per minute in wholesale. Also, customer service and bad debt costs declined inLD services. These declines were partially offset by additional costs in satellite rental capacities,salary expenses and depreciation and amortization, supported by higher activity in theenterprise segment. In 2Q12, EBITDA was US$ 1.7 million, an increase of 71% compared to2Q11. EBIT rose as well, totalling US$ 0.5 million compared to a US$ 0.1 loss in 2Q11.____________________________11
<strong>Second</strong> <strong>Quarter</strong> <strong>2012</strong> <strong>Results</strong>August 6, <strong>2012</strong>BALANCE SHEETConsolidated Balance Sheet (limited review)(in millions of Chilean Pesos)6M12 6M11 Var %Assets1.621.619 1.451.519 12%Current assets 387.343 333.073 16%Property, plant & equipment, net 1.097.824 985.660 11%Others Non-current assets 136.452 132.786 3%Liabilities & shareholders’ 1.621.619 1.451.519 12%Current liabilities 525.222 453.916 16%Non Current Liabilities 332.983 279.429 19%Shareholders’ equity 763.414 718.174 6%Financial IndexesCurrent assets/Current liabilities 0,74 0,73 0,93EBITDA/Financial expenses 46,76 49,56 49,94Gross Financial debt/EBITDA* 0,72 0,59 0,63Total liabilities/(equity + min. interest) 1,12 1,02 1,02* EBITDA last 12 months.Jun/12 Jun/11 Dec/11As of June 30, <strong>2012</strong>, gross financial debt reached Ch$ 380.4 billion, 30% higher whencompared to the same period of last year. This increase was the result of new debt raised inJune <strong>2012</strong> totaling Ch$ 70.0 billion and a 7% increase in the CH$/US$ exchange rate, partiallyoffset by leasing and bank payments. Net debt (gross debt less cash and net balances fromF/X hedging instruments including mark-to-market accruals) during the period reached Ch$400.2 billion, a 19% increase compared to the Ch$ 336.4 billion reported in 2Q11.12
<strong>Second</strong> <strong>Quarter</strong> <strong>2012</strong> <strong>Results</strong>August 6, <strong>2012</strong>RECENT EVENTSDuring May <strong>2012</strong>, <strong>Entel</strong> paid the final dividend based on 2011 profits forCh$ 405 per share, reaching a total of Ch$ 95,792 million.Only three operators presented proposals for the 4G spectrum auction in the 2.6MHz band. The companies selected for blocks A, B and C (each block of 40MHz), with similar scores, were <strong>Entel</strong> (99.06), Claro (98.52) and Movistar(98.11). On July 30, <strong>2012</strong>, <strong>Entel</strong> won the auction for block B for a total amountof US$ 8.8 million. Regulator should confirm this within 3Q12.During June, the Antenna Act became effective, which regulates the installationof telecommunication infrastructure, promoting mimicry or tower sharing. Thislaw imposes installation standards to defined zones. The labeled zones are:saturated (with 2 or more towers taller than 12 meters within 100 meters) andsensitive (in places such as schools, health centers and nurseries, which do notpermit towers over 12 meters within 50 meters). There are also regulations forexisting antennas and for new tower facilities.During this quarter, VTR and GTD (MVNO) launched mobile operations, whileNextel began to offer 3G services.13
<strong>Second</strong> <strong>Quarter</strong> <strong>2012</strong> <strong>Results</strong>August 6, <strong>2012</strong>Company DescriptionEmpresa Nacional de Telecomunicaciones S.A. is the largest telecommunications Company inChile with Ch$ 1,240,914 million in annual revenues reported in December 2011. The Companyprovides mobile and wireline services (including Data & IT, Internet, local telephony, call center,long distance and related services). <strong>Entel</strong> also has wireline and call center operations in Perú.<strong>Entel</strong> is listed on the Chilean Stock Exchange (Bolsa de Comercio de Santiago) under the tickersymbol ENTEL and is headquartered in Santiago, Chile.14
<strong>Second</strong> <strong>Quarter</strong> <strong>2012</strong> <strong>Results</strong>August 6, <strong>2012</strong>Glossary of TermsARPU: Average Revenue per User. It is presented on a monthly basis.BPO: Business Process Outsourcing.Capex: Capital Expenditure.Churn: Disconnection Rate. It is presented on a monthly basis.DLD: Domestic Long Distance.EBIT: Operating earnings.EBITDA: Operating earnings excluding depreciation, amortization and fixed assets impairment.EDGE: Enhanced Data rates for GSM Evolution. A technology that gives GSM the capacity tohandle data services.EPS: Earnings Per Share.GAAP: Generally Accepted Accounting Principles.GPRS: General Packet Radio Service. Enables GSM networks to offer higher capacity,Internet-based content and packet-based data services. It is a second generation technology.GSM: Global System for Mobile communications.HSPA: High Speed Packet Access. A family of high-speed 3G digital data services that use theGSM technology. The service works with HSPA mobile phones as well as laptops and portabledevices with HSPA modems.HSDPA: High Speed Downlink Packet Access. Is an enhanced 3G (third generation) mobiletelephony communications protocol in the High-Speed Packet Access (HSPA) family.HSDPA + Dual Carrier: Is a wireless broadband standard based on HSPA that is defined in3GPP UMTS release 8, which enables mobile broadband speeds of up to 22 Mbps.IFRS: International financial reporting standards.ILD: International Long Distance.IT: Information Technology.LIS: Lines In Service.LTE: Long Term Evolution, is the fourth generation of radio technologies designed to increasethe capacity and speed of mobile telephone networks.15
<strong>Second</strong> <strong>Quarter</strong> <strong>2012</strong> <strong>Results</strong>August 6, <strong>2012</strong>M2M: Machine to Machine, includes the automating of communication processes betweenmachines (Machine to Machine) between mobile devices and machines (Mobile to Machine),and between men and machines (Man to Machine).MBB: Mobile broadband includes M2M data cards.MOU: Minutes of Use per subscriber. The ratio of traffic in a given period to the averagenumber of subscribers in that same period. It is presented on a monthly basis.MPLS: Multiprotocol Label Switching, Is a switching technology created to provide virtualcircuits in IP networks.Net debt: Total short and long term debt less cash and net balances from hedging activities.Net debt / EBITDA: The ratio of total short and long term debt less cash and net balancesfrom hedging activities to trailing 12-month period income before interest, taxes, depreciationand amortization.NGN: Next Generation Network, The convergence of the public switched telephone network(PSTN) voice network, the internet and the data network.OtherRevenues – Non core: revenues which are not a part of the Company´s corebusiness. Concepts included are gain/(loss) in sales of fixed assets and interest accrued onpast due invoices and leasing operations.SAC: Subscriber Acquisition Cost. The sum of handset subsidies, marketing expenses andcommissions to distributors for handset activation.difference between equipment cost and equipment revenues.SG&A: Selling, General and Administrative Expenses.SME: Small & Medium-Sized Enterprises.SMS: Short Message Service.VAS: Value Added Services.Handset subsidy is calculated as theWIMAX: Worldwide Interoperability for Microwave Access, a standard-based wirelesstechnology which provides access network.3.5G: Commercial name for HSDPA, the third generation service given by <strong>Entel</strong> PCS.16
<strong>Second</strong> <strong>Quarter</strong> <strong>2012</strong> <strong>Results</strong>August 6, <strong>2012</strong>EBITDA breakdown by Services.(in millions of Chilean Pesos)EBITDA <strong>Results</strong> 2Q12 2Q11 % Chg. 1Q12 6M12 6M11 % Chg.Total 138.447 133.134 4% 140.559 279.006 265.974 5%Mobile Services 104.974 101.320 0% 112.770 215.010 202.713 6%Fixed Services 30.420 29.096 -11% 28.352 58.772 57.131 3%Others(*) 3.053 2.719 12% -564 5.224 6.130 -15%(*) Others: Call Center, Americatel Perú & Others.Individual Consolidated <strong>Results</strong> Americatel Perú.(in thousands of Peruvian Soles and in million of Chilean Pesos)2Q12 2Q11 % Var. 6M12 6M11 % Var. 2Q12 2Q11 % Var. 6M12 6M11 % Var.Americatel Perú (SOL$) (SOL$) (SOL$) (SOL$) (Ch$) (Ch$) (Ch$) (Ch$)Total Revenues 29.212 28.410 3% 87.964 85.454 3% 5.393 5.245 3% 16.239 15.775 3%Cost of Operations 27.818 28.751 -3% 81.956 85.468 -4% 5.135 5.308 -3% 15.129 15.778 -4%Depreciation andAmortization and Impairment 3.116 2.981 5% 9.272 8.388 11% 575 550 5% 1.712 1.548 11%Salaries & Expenses 5.121 4.667 10% 15.601 13.593 15% 945 862 10% 2.880 2.509 15%EBITDA 4.509 2.640 71% 15.280 8.374 82% 832 487 71% 2.821 1.546 82%EBITDA Margin 15% 9% 17% 10% 15% 9% 17% 10%Operating Income 1.394 -341 509% 6.008 -14 257 -63 509% 1.109 -3Operating Margin 5% -1% 7% 0% 5% -1% 7% 0%Any distortion in the figures is due to monetary exchange fluctuation17
<strong>Second</strong> <strong>Quarter</strong> <strong>2012</strong> <strong>Results</strong>August 6, <strong>2012</strong><strong>Entel</strong> Group Consolidated Income Statement(in thousands of Chilean Pesos)YTDQTDINCOME STATEMENT 01-01-<strong>2012</strong> 01-01-2011 01-04-<strong>2012</strong> 01-04-201130-06-<strong>2012</strong> 30-06-2011 30-06-<strong>2012</strong> 30-06-2011M$ M$ M$ M$Operating Revenues 686.818.111 591.696.749 347.970.200 299.658.860Other Revenues 5.254.520 5.419.613 3.679.909 1.874.782Salaries and Expenses (66.747.918) (60.852.134) (34.742.149) (30.801.037)Depreciation and amortization (150.003.913) (130.128.821) (78.430.905) (66.032.648)Impairment and bad debt (23.636.141) (16.080.526) (12.146.250) (9.318.159)Other Operating Expenses (324.980.914) (255.119.922) (167.514.415) (129.529.383)Other Gain (Loss) (101.798) (1.340.758) 36 123.662Gain (Loss) over Operational Activities 126.601.947 133.594.201 58.816.426 65.976.077Financial income 1.307.207 2.069.978 651.670 922.693Financial expenses (5.934.522) (4.953.041) (2.997.085) (2.545.971)Exchange gain (Loss) (3.808.405) (2.252.734) (2.321.159) (1.788.450)Other monetary adjustment (2.607.399) (3.009.176) (857.113) (2.139.064)Profit/(loss) before income Tax 115.558.828 125.449.228 53.292.739 60.425.285Income Tax (20.192.575) (21.649.393) (10.407.161) (9.066.391)Net Income for the period 95.366.253 103.799.835 42.885.578 51.358.894Earnings per share 403,20 438,86 181,32 217,14Other Income and (Expense), debit /credit directly to EquityCash Flow Coverage 1.038.675 1.463.935 739.757 1.738.080Conversion Adjustments (235.795) 211.368 339.647 (39.728)Income Tax (181.632) (256.189) (129.321) (304.164)Other Income and Expense with debitsand credits in the Equity, Total 621.248 1.419.114 950.083 1.394.188Net <strong>Results</strong> 95.987.501 105.218.949 43.835.661 52.753.08218
<strong>Second</strong> <strong>Quarter</strong> <strong>2012</strong> <strong>Results</strong>August 6, <strong>2012</strong><strong>Entel</strong> Group Consolidated Balance Sheet(in thousands of Chilean Pesos)ASSETS Jun/12 Dec/11 Var%Current assets 387.342.744 365.735.174 6%Cash and cash equivalents 17.107.042 23.064.067Other financial assets 1.853.396 5.407.220Other non financial assets 16.470.190 16.754.397Trade and other receivables 260.554.203 251.229.640Accounts receivable from related entities 459.809 722.752Inventory 85.583.416 63.091.800Tax assets 5.314.688 5.465.298Non-current assets 1.234.276.048 1.192.278.832 4%Other Financial Assets 5.343.907 5.800.553Other non Financial assets 4.304.975 4.718.678Trade and other receivables 4.785.615 5.324.234Intangible assets 28.541.622 31.118.433Goodwill 45.895.283 45.895.283Property, plant and equipment 1.097.823.697 1.056.555.054Deferred tax assets 47.580.949 42.866.597TOTAL ASSETS 1.621.618.792 1.558.014.006 4%LIABILITIES AND SHAREHOLDERSEQUITYJun/12 Dec/11 Var%Current Liabilities 525.222.180 394.261.450 33%Other financial liabilities 125.492.821 18.584.041Trade and other payables 363.095.318 326.224.772Other provisions 480.714 578.262Income tax 4.690.863 7.951.010Other liabilities non financial 31.462.464 40.923.365Non Current Liabilities 332.982.549 390.675.465 -15%Other financial liabilities 296.733.159 353.504.014Other provisions long term 5.496.986 5.123.356Deffered income tax 9.003.640 11.708.289Employee severance and others 7.596.343 7.718.074Other non financial liabilities 14.152.421 12.621.732Equity 763.414.063 773.077.091 -1%Paid-in Capital 522.667.566 522.667.566Retained Earnings 300.687.602 310.971.878Other Reserves (59.941.105) (60.562.353)Minority interests - -TOTAL LIABILITIES ANDSHAREHOLDERS EQUITY 1.621.618.792 1.558.014.006 4%19
<strong>Second</strong> <strong>Quarter</strong> <strong>2012</strong> <strong>Results</strong>August 6, <strong>2012</strong>Attachment 1Adjustments to 1Q11 reported(in millions of Chilean Pesos)Segments Operational 1Q11 RST 1Q11ConsumersRevenue 174.372 175.912EBITDA 69.924 75.139EBITDA MG (%) 40% 43%Corporate and SMERevenue 99.808 99.787EBITDA 40.737 38.034EBITDA MG (%) 41% 38%Networks rentals (including trafficbusiness), Call Center & OthersRevenue 49.004 47.696EBITDA 21.686 19.190EBITDA MG (%) 44% 40%Americatel PerúRevenue 4.945 4.945EBITDA 496 496EBITDA MG (%) 18% 10%Adjustments and EliminationsRevenue -34.011 -34.221EBITDA -3 -20Consolidated <strong>Results</strong>Revenue 294.118 294.118EBITDA 132.839 132.839EBITDA MG (%) 45% 45%EBIT 67.618 67.618EBIT MG (%) 23% 23%20


