2010 Municipal Census - Regional Municipality of Wood Buffalo
2010 Municipal Census - Regional Municipality of Wood Buffalo
2010 Municipal Census - Regional Municipality of Wood Buffalo
- No tags were found...

You also want an ePaper? Increase the reach of your titles
YUMPU automatically turns print PDFs into web optimized ePapers that Google loves.
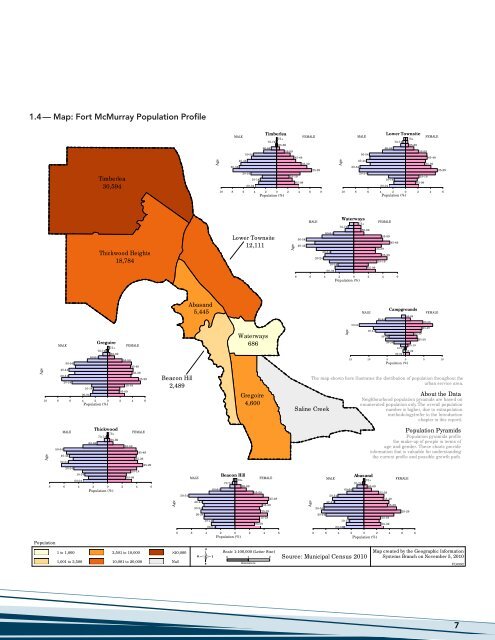
1.4 — Map: Fort McMurray Population Pr<strong>of</strong>ileTimberlea30,594AgeTimberleaMALEFEMALE75+70-7465-6960-6455-5950-5445-4940-4435-3930-3425-2920-2415-1910-1405-0900-0410 8 6 4 2 0 2 4 6 8Population (%)AgeLower TownsiteMALEFEMALE75+70-7465-6960-6455-5950-5445-4940-4435-3930-3425-2920-2415-1910-1405-0900-0410 8 6 4 2 0 2 4 6Population (%)Thickwood Heights18,784Lower Townsite12,111Age50-5440-44MALE60-6430-3420-2410-1400-04Waterways75+70-7465-6905-09FEMALE55-5945-4935-3925-2915-198 6 4 2 0 2 4 6Population (%)AgeGregoireMALEFEMALE75+70-7465-6960-6455-5950-5445-4940-4435-3930-3425-2920-2415-1910-1405-0900-0410 8 6 4 2 0 2 4 6Population (%)AgeThickwoodMALEFEMALE75+70-7465-6960-6455-5950-5445-4940-4435-3930-3425-2920-2415-1910-1405-0900-048 6 4 2 0 2 4 6Population (%)Abasand5,445Waterways686Beacon Hill2,489Gregoire4,600AgeBeacon HillMALEFEMALE75+70-7465-6960-6455-5950-5445-4940-4435-3930-3425-2920-2415-1910-1405-0900-04Saline CreekAge30-3420-24MALE50-5440-4400-04Age10-1450-54MALE40-44About the DataNeighbourhood population pyramids are based onenumerated population only.The overall populationnumber is higher, due to extrapolationmethodology(refer to the Introductionchapter in this report).Abasand75+70-7465-6960-6460-6430-34Population PyramidsPopulation pyramids pr<strong>of</strong>ilethe make-up <strong>of</strong> people in terms <strong>of</strong>age and gender. These charts provideinformation that is valuable for understandingthe current pr<strong>of</strong>ile and possible growth path.55-5945-4915-1905-09Campgrounds20-2435-3910-1400-04FEMALE25-2965-6915-1905-0935-3925-29FEMALE55-5945-4915 10 5 0 5 10Population (%)The map shown here illustrates the distribution <strong>of</strong> population throughout theurban service area.Population1 to 1,0001,001 to 3,5003,501 to 10,00010,001 to 20,0008 6 4 2 0 2 4 6Population (%)>20,000NullScale 1:100,000 (Letter Size)0 1 2Kilometers8 6 4 2 0 2 4 6 8Population (%)Source: <strong>Municipal</strong> <strong>Census</strong> <strong>2010</strong>Map created by the Geographic InformationSystems Branch on November 5, <strong>2010</strong>PL05927