2010 Municipal Census - Regional Municipality of Wood Buffalo
2010 Municipal Census - Regional Municipality of Wood Buffalo
2010 Municipal Census - Regional Municipality of Wood Buffalo
- No tags were found...

You also want an ePaper? Increase the reach of your titles
YUMPU automatically turns print PDFs into web optimized ePapers that Google loves.
AcknowledgementThe statistical information summarized in this report by the<strong>Regional</strong> <strong>Municipal</strong>ity <strong>of</strong> <strong>Wood</strong> <strong>Buffalo</strong> has been collectedthrough a partnership between the <strong>Regional</strong> <strong>Municipal</strong>ity<strong>of</strong> <strong>Wood</strong> <strong>Buffalo</strong>, the Population Research Lab at theUniversity <strong>of</strong> Alberta, and the City <strong>of</strong> Airdrie.ContactPlanning and Development Department<strong>Regional</strong> <strong>Municipal</strong>ity <strong>of</strong> <strong>Wood</strong> <strong>Buffalo</strong>9909 Franklin AvenueFort McMurray, AlbertaT9H 2K4Telephone: 780-743-7000Toll Free: 1-800-973-9663Website: www.woodbuffalo.ab.caNote <strong>of</strong> AppreciationThe <strong>Regional</strong> <strong>Municipal</strong>ity <strong>of</strong> <strong>Wood</strong> <strong>Buffalo</strong> would liketo extend it sincere thanks to the residents <strong>of</strong> the regionfor their cooperation during the <strong>2010</strong> <strong>Municipal</strong> <strong>Census</strong>.The reporting <strong>of</strong> this statistical information could notbe accomplished without their continued willingnessto participate in our annual enumeration. Thank you forcounting yourself in.
TABLE OF CONTENTSIntroduction. ............................................................................ 1<strong>Census</strong> <strong>2010</strong> .................................................................................1<strong>Census</strong> Data Collection ........................................................................1Scope <strong>of</strong> the Report ...........................................................................1Population. ............................................................................. 2Summary ....................................................................................2<strong>Regional</strong> Growth and Oil Sands Investments ........................................................3Growth Patterns ..............................................................................3Future Growth ................................................................................31.1 Table: Population in the <strong>Regional</strong> <strong>Municipal</strong>ity <strong>of</strong> <strong>Wood</strong> <strong>Buffalo</strong> by Area from 2000 to <strong>2010</strong> .............41.2 Map: <strong>Regional</strong> Population Pr<strong>of</strong>ile ............................................................51.3 Table: Population in Fort McMurray by Area from 2000 to <strong>2010</strong> ....................................61.4 Map: Fort McMurray Population Pr<strong>of</strong>ile .......................................................71.5 Chart: Population in Fort McMurray by Neighbourhood ..........................................81.6 Table: Percent Population in the <strong>Regional</strong> <strong>Municipal</strong>ity <strong>of</strong> <strong>Wood</strong> <strong>Buffalo</strong> by Area and Gender ...........91.7 Table: Percent Population in Fort McMurray by Area and Gender. . . . . . . . . . . . . . . . . . . . . . . . . . . . . . . . . . . 91.8 Table: Comparison <strong>of</strong> Percent Population in the <strong>Regional</strong> <strong>Municipal</strong>ity <strong>of</strong> <strong>Wood</strong> <strong>Buffalo</strong> by Age from2000 to <strong>2010</strong> ............................................................................10Housing. ............................................................................... 11Summary ....................................................................................111.9 Table: Average Number <strong>of</strong> People per Dwelling Type in the <strong>Regional</strong> <strong>Municipal</strong>ity <strong>of</strong> <strong>Wood</strong> <strong>Buffalo</strong> .......111.10 Table: Average Number <strong>of</strong> People per Household by Dwelling Type in the <strong>Regional</strong> <strong>Municipal</strong>ity <strong>of</strong> <strong>Wood</strong><strong>Buffalo</strong> from 2000 to <strong>2010</strong> .................................................................121.11 Table: Average Number <strong>of</strong> People per Dwelling Type in Fort McMurray .............................121.12 Table: Average Number <strong>of</strong> People per Household by Dwelling Type in Fort McMurray from 2000 to <strong>2010</strong> ..131.13 Table: Percent Tenancy Distribution in the <strong>Regional</strong> <strong>Municipal</strong>ity <strong>of</strong> <strong>Wood</strong> <strong>Buffalo</strong> .....................131.14 Table: Percent Tenancy Distribution in Fort McMurray ............................................14
INTRODUCTION<strong>2010</strong> <strong>Municipal</strong> <strong>Census</strong>The <strong>Regional</strong> <strong>Municipal</strong>ity <strong>of</strong> <strong>Wood</strong> <strong>Buffalo</strong> (the<strong>Municipal</strong>ity) conducts a municipal census to providetimely statistical data about the region and its residents.The census data is used by the <strong>Municipal</strong>ity for decisionsassociated with land use and development as well asregional service delivery. The <strong>Municipal</strong>ity also relies onupdated data to generate and validate demographicgrowth forecasts.<strong>Census</strong> data collected during the <strong>2010</strong> <strong>Municipal</strong> <strong>Census</strong>is not only valuable to the <strong>Municipal</strong>ity, but also to otherlocal public sectors. These partners include the Publicand Catholic school districts, Keyano College, and theFort McMurray Public Library. Private sector businesses,industry, and associations also have an interest in currentcensus data for activities such as workforce planning.The rapid population growth experienced in themunicipality during the past decade requires thatgovernment grant funding, allocated mainly on a percapita basis, and capital expenditures reflect accuratepopulation figures. Therefore, the <strong>Municipal</strong>ity considersthe annual municipal census to be an important asset forthe region, taxpayers and residents.<strong>Census</strong> Data CollectionThe <strong>2010</strong> <strong>Municipal</strong> <strong>Census</strong> enumerated the Urban ServiceArea (Fort McMurray) and eight rural communities – Anzac,Conklin, Fort Chipewyan, Fort Fitzgerald, Fort MacKay,Gregoire Lake Estates, Janvier, and Saprae Creek. Thepopulation on the five First Nations reserves located in themunicipality were not enumerated.<strong>2010</strong> <strong>Municipal</strong> <strong>Census</strong> data collection process includedfilling out an online census survey via the <strong>Municipal</strong>ity’swebsite, in-person interviews at residents’ homes byenumerators, and providing information by phone to thecensus <strong>of</strong>fice. Statistical data from secondary sourceswas provided for some population reporting categories:project accommodations (work camps), hotels/motels,and homeless people.Prior to 2008, the <strong>Municipal</strong>ity only applied the door-todoorenumeration methodology for the municipal census.In order to improve the response rate, the <strong>Municipal</strong>ityintroduced online enumeration in 2008 as an additionto the traditional door-to-door method. In <strong>2010</strong>, the<strong>Municipal</strong>ity worked in conjunction with the City <strong>of</strong>Airdrie to improve the online enumeration method, andlaunched a more vigorous public advertising campaign toincrease the awareness <strong>of</strong> online enumeration. The overallresponse rate in the <strong>2010</strong> <strong>Municipal</strong> <strong>Census</strong> was 80%.Out <strong>of</strong> this total response rate, 73% <strong>of</strong> dwellings wereenumerated by the door-to-door method and 27% byonline response. The above mentioned methodologieshave been approved by Alberta <strong>Municipal</strong> Affairs.Scope <strong>of</strong> the ReportThe information in this report contains quantitative datataken from the <strong>2010</strong> enumeration outcomes and secondarydata sources, as well as limited analysis. The intent <strong>of</strong> thisreport and the information within it is to provide a datasource for further analysis.Data collection took place throughout the region betweenApril 16, <strong>2010</strong> and June 30, <strong>2010</strong>. Methods used for the1
POPULATIONSummary<strong>Regional</strong> <strong>Municipal</strong>ity <strong>of</strong> <strong>Wood</strong> <strong>Buffalo</strong>:<strong>2010</strong> total population 104,338Growth between 2008 and <strong>2010</strong> 1.0%Average annual growth rate between 2000 and <strong>2010</strong> 7.4%Overall growth since 2000 101%Fort McMurray:<strong>2010</strong> total population 76,797Growth between 2008 and <strong>2010</strong> 6.1%Average annual growth rate between 2000 and <strong>2010</strong> 6.1%Overall growth since 2000 80%Project accommodations (work camps):<strong>2010</strong> total population 23,325Growth between 2008 and <strong>2010</strong> -11.3%Average annual growth rate between 2000 and <strong>2010</strong> 17.1%Overall growth since 2000 295%Rural and Hinterland:<strong>2010</strong> total population 4,216Growth between 2008 and <strong>2010</strong> 9.1% 1Average annual growth rate between 2000 and <strong>2010</strong> 3.7% 1Overall growth since 2000 42 % 11The calculation excluded Fort MacKay – see comments on Fort MacKay in Table 1.1.<strong>Regional</strong> Growth and Oil Sands InvestmentsThe <strong>Regional</strong> <strong>Municipal</strong>ity <strong>of</strong> <strong>Wood</strong> <strong>Buffalo</strong> has experiencedsustained economic growth as a result <strong>of</strong> the abundant oilsands deposits in the region. The unabated economicgrowth took place from 2000 until the fall <strong>of</strong> 2008, whenthe global financial crisis started. The financial crisis hassince slowed population growth in the region. Between2008 and <strong>2010</strong>, the <strong>Municipal</strong>ity has seen a 1.0% increasein population over two years, which is lower than the 7.4%average annual growth rate between 2000 and <strong>2010</strong>. Theannual average growth rate <strong>of</strong> Canada and Alberta for thesame time interval was 1.2% and 2.8% 1 , respectively. Therapid pace <strong>of</strong> population growth is expected to resume asnew oil sands projects come on stream in the next decade.The connection between population growth andoil sands activity was evident when regional growthstagnated between 1989 and 1999, before the next majorinvestments in the oil sands. The total population growth inFort McMurray between 1989 (33,698) and 1999 (36,876)was 9.4%. During that same period <strong>of</strong> time, the oil sandscapital expenditures and operating costs increased by114.5% 2 . During the most recent increase in oil sands2
1.1 — Table: Population in the <strong>Regional</strong> <strong>Municipal</strong>ity <strong>of</strong> <strong>Wood</strong> <strong>Buffalo</strong> by Area from 2000 to <strong>2010</strong>Area 2000 2002 2004 2005 2006 2007 2008 <strong>2010</strong>Fort McMurray 1 42,600 47,757 56,111 60,983 61,366 65,400 72,363 76,797Anzac 446 548 647 685 711 714 837 785Conklin 219 213 210 242 338 299 372 337Draper 60 84 141 148 118 185 267 254Fort Chipewyan 1,036 1,012 1,146 744 915 1,007 1,016 1,261 2Fort Fitzgerald - 30 4 12 4 2 10 8Fort MacKay 3 399 186 218 104 536 737 862 44 3Gregoire Lake Estates 206 184 206 180 285 248 253 248Janvier 185 143 112 141 218 178 194 195Mariana Lake 15 11 8 5 9 9 4 0Saprae Creek 659 603 624 754 728 737 864 926Hinterland 4 122 - - - 47 43 8 158Shadow Population: 5 - - - - - - - -- Project Accommodation 6 5,903 8,063 7,678 9,178 10,442 18,572 26,284 23,325Total 51,850 58,834 67,105 73,176 75,717 88,131 103,334 104,338Note: The population does not include on-reserve population.1The work camp, hotel/motel and campgroundpopulation residing in Fort McMurray are included inthe total. See Table 1.3 for a breakdown <strong>of</strong> populationwithin the Urban Service Area <strong>of</strong> Fort McMurray.2The increase in population in Fort Chipewyan is likelydue to growth, but also because the enumeratorswere trained in person in <strong>2010</strong>, which may haveresulted in more accurate data.3The <strong>2010</strong> <strong>Municipal</strong> <strong>Census</strong> enumeration for Fort MacKaywas only conducted on the <strong>of</strong>f-reserve population. Thepopulation that resides on-reserve, including the recentreserve expansion, was not enumerated in <strong>2010</strong> and isthus not reflected in the <strong>2010</strong> census figures. Populationfigures prior to <strong>2010</strong> reflect both on-and <strong>of</strong>f-reservepopulation.4“Hinterland” means sparsely populated region outside<strong>of</strong> Urban and Rural Service Areas, and does not includeWork Camps and Campgrounds. A higher number in<strong>2010</strong> is in part due to better coverage <strong>of</strong> hinterland areasby enumerators.5“Shadow Population” means temporary residents <strong>of</strong>a municipality who are employed or will be employedby an industrial or commercial establishment in themunicipality for a minimum <strong>of</strong> 30 days.6Source: The Oil Sands Developers Group, June <strong>2010</strong>.4
1.3 —Table: Population in Fort McMurray by Area from 2000 to <strong>2010</strong>Area 2000 2002 2004 2005 2006 2007 2008 <strong>2010</strong>Abasand Heights 4,649 4,061 4,442 5,860 5,608 5,309 5,775 5,445Beacon Hill 2,336 2,480 2,604 2,461 2,518 2,481 2,545 2,489Gregoire 3,188 3,856 4,117 4,358 4,658 4,488 4,771 4,600Lower Townsite 9,561 11,831 13,652 12,260 11,300 11,721 12,474 12,111Thickwood Heights 15,995 17,015 18,229 18,087 18,247 18,527 19,160 18,784Timberlea 5,748 7,336 11,605 14,406 15,579 18,900 24,383 30,594Waterways 679 661 472 718 750 722 755 686Shadow Population 1 : - - - - - - - -- Project Accommodation 2 - - - - - 54 52 -- Hotels/Motels 2 444 517 990 2,024 1,778 1,423 1,421 850- Campgrounds - - - 577 523 1,334 586 689Homeless - - - 232 405 441 441 549 3Total 42,600 47,757 56,111 60,983 61,366 65,400 72,363 76,7971“Shadow Population” means temporary residents <strong>of</strong>a municipality who are employed or will beemployed by an industrial or commercial establishmentin the municipality for a minimum <strong>of</strong> 30 days.2Source: The Oil Sands Developers Group, June <strong>2010</strong>.3Source: Fort McMurray Housing Needs Count. St.Aidan’s Society for the <strong>Regional</strong> <strong>Municipal</strong>ity <strong>of</strong> <strong>Wood</strong><strong>Buffalo</strong>, November 2008.6
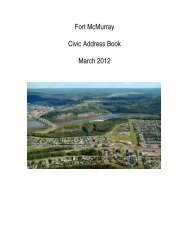
1.4 — Map: Fort McMurray Population Pr<strong>of</strong>ileTimberlea30,594AgeTimberleaMALEFEMALE75+70-7465-6960-6455-5950-5445-4940-4435-3930-3425-2920-2415-1910-1405-0900-0410 8 6 4 2 0 2 4 6 8Population (%)AgeLower TownsiteMALEFEMALE75+70-7465-6960-6455-5950-5445-4940-4435-3930-3425-2920-2415-1910-1405-0900-0410 8 6 4 2 0 2 4 6Population (%)Thickwood Heights18,784Lower Townsite12,111Age50-5440-44MALE60-6430-3420-2410-1400-04Waterways75+70-7465-6905-09FEMALE55-5945-4935-3925-2915-198 6 4 2 0 2 4 6Population (%)AgeGregoireMALEFEMALE75+70-7465-6960-6455-5950-5445-4940-4435-3930-3425-2920-2415-1910-1405-0900-0410 8 6 4 2 0 2 4 6Population (%)AgeThickwoodMALEFEMALE75+70-7465-6960-6455-5950-5445-4940-4435-3930-3425-2920-2415-1910-1405-0900-048 6 4 2 0 2 4 6Population (%)Abasand5,445Waterways686Beacon Hill2,489Gregoire4,600AgeBeacon HillMALEFEMALE75+70-7465-6960-6455-5950-5445-4940-4435-3930-3425-2920-2415-1910-1405-0900-04Saline CreekAge30-3420-24MALE50-5440-4400-04Age10-1450-54MALE40-44About the DataNeighbourhood population pyramids are based onenumerated population only.The overall populationnumber is higher, due to extrapolationmethodology(refer to the Introductionchapter in this report).Abasand75+70-7465-6960-6460-6430-34Population PyramidsPopulation pyramids pr<strong>of</strong>ilethe make-up <strong>of</strong> people in terms <strong>of</strong>age and gender. These charts provideinformation that is valuable for understandingthe current pr<strong>of</strong>ile and possible growth path.55-5945-4915-1905-09Campgrounds20-2435-3910-1400-04FEMALE25-2965-6915-1905-0935-3925-29FEMALE55-5945-4915 10 5 0 5 10Population (%)The map shown here illustrates the distribution <strong>of</strong> population throughout theurban service area.Population1 to 1,0001,001 to 3,5003,501 to 10,00010,001 to 20,0008 6 4 2 0 2 4 6Population (%)>20,000NullScale 1:100,000 (Letter Size)0 1 2Kilometers8 6 4 2 0 2 4 6 8Population (%)Source: <strong>Municipal</strong> <strong>Census</strong> <strong>2010</strong>Map created by the Geographic InformationSystems Branch on November 5, <strong>2010</strong>PL05927
1.5 — Chart: Population in Fort McMurray by Neighbourhood8
1.6 — Table: Percent Population in the <strong>Regional</strong> <strong>Municipal</strong>ity <strong>of</strong> <strong>Wood</strong> <strong>Buffalo</strong> by Area and Gender2000 2002 2004 2005 2006 2008 <strong>2010</strong>Area M F M F M F M F M F M F M FFort McMurray 53.6 46.4 54.5 45.5 56.8 43.2 55.8 44.2 55.2 44.8 56.9 43.1 57.1 42.9Anzac 53.7 46.3 54.3 45.7 54.3 45.7 52.2 47.8 52.9 47.1 59.3 40.7 59.1 40.9Conklin 49.5 50.5 - - 51.9 48.1 55.7 44.3 56.9 43.1 55.1 44.9 51.0 49.0Draper 53.3 46.7 - - 48.6 51.4 53.3 46.7 51.9 48.1 59.3 40.7 55.8 44.2Fort Chipewyan 51.3 48.7 49.5 50.5 50.9 49.1 51.6 48.4 50.6 49.4 51.0 49.0 50.7 49.3Fort MacKay 50.9 41.9 50.7 49.3 54.3 45.7 53.3 46.7 58.2 41.8 50 50 66.7 33.3Gregoire Lake Estates 54.3 45.7 53.8 46.2 56.8 43.2 54.2 45.8 51.7 48.3 53.0 47.0 53.4 46.6Janvier 53.1 46.9 55.1 44.9 59.8 40.2 53.4 46.6 55.8 44.2 52.4 47.6 53.6 46.6Saprae Creek 51.9 48.1 51.7 48.3 54.2 45.8 54.9 45.1 53.4 46.6 53.4 46.6 54.0 46.0Average 53.6 46.4 53.7 46.3 54.9 45.1 53.8 46.2 55.0 45.0 56.7 43.3 57.0 43.0Note: Age and gender details on project accommodationand hotel/motel population are not included in the abovetable, as only a population count was conducted forproject accommodation and hotel/motel.1.7— Table: Percent Population in Fort McMurray by Area and Gender2000 2002 2004 2005 2006 2008 <strong>2010</strong>Area M F M F M F M F M F M F M FAbasand Heights 53.9 46.1 55.5 44.5 59.5 40.5 57.1 42.9 55.7 44.3 58.3 41.7 57.9 42.1Beacon Hill 51.7 48.3 53.4 46.6 60.4 39.6 54.2 45.8 52.2 47.8 57.0 43.0 54.7 45.3Gregoire 53.5 46.5 57.6 42.4 57.2 42.8 55.2 44.8 55.0 45.0 55.7 44.3 52.7 42.8Lower Townsite 57.9 42.1 59.1 40.9 53.3 46.7 59.2 40.8 57.9 42.1 58.6 41.4 60.2 39.8Thickwood 51.8 48.2 52.3 47.7 54.7 45.3 55.4 44.6 55.2 44.8 57.5 42.5 56.5 43.5Timberlea 51.8 48.2 52.1 47.9 53.8 46.2 53.9 46.1 53.7 46.3 55.5 44.5 56.4 43.6Waterways 56.7 43.3 59.0 41.0 59.1 40.9 60.9 39.1 60.5 39.5 57.3 42.7 55.4 44.6Campgrounds - - - - - - - - - - - - 67.1 32.9Average 53.6 46.4 54.5 45.5 56.8 43.2 55.8 44.2 55.2 44.8 56.8 43.2 57.1 42.9Note: Age and gender details on project accommodationand hotel/motel population are not included in the abovetable, as only a population count was conducted forproject accommodation and hotel/motel.9
1.8—Table: Comparison <strong>of</strong> Percent Population in the <strong>Regional</strong> <strong>Municipal</strong>ity <strong>of</strong> <strong>Wood</strong> <strong>Buffalo</strong> by Age from 2000to <strong>2010</strong> 1Age 2000 2002 2004 2005 2006 2008 <strong>2010</strong>0-4 7.3 7.1 7.4 7.1 6.8 6.5 6.95-9 8.8 7.8 7.5 7.3 6.8 6.1 5.610-14 9.3 8.6 8.6 7.2 7.0 6.2 5.515-19 9.2 8.3 8.2 7.6 7.4 6.7 5.620-24 7.3 8.5 7.9 8.3 9.0 9.5 9.125-29 7.8 8.7 8.3 9.0 9.5 10.9 12.330-34 8.4 8.8 8.3 9.1 9.1 9.6 10.935-39 9.8 9.0 8.9 8.6 9.0 8.8 9.640-44 10.4 10.2 10.1 9.6 9.3 9.2 9.045-49 8.6 9.1 9.5 9.9 9.8 9.4 8.750-54 6.6 6.9 7.5 8.0 8.0 8.7 8.355-59 3.3 3.8 4.3 4.7 4.6 4.6 4.960-64 1.5 1.6 1.7 1.9 2.0 2.2 2.365-69 0.8 0.8 0.8 0.9 0.9 0.8 0.870-74 0.5 0.4 0.5 0.4 0.5 0.5 0.475+ 0.1 0.2 0.1 0.1 0.1 0.3 0.3Note: Age and gender details on project accommodationand hotel/motel population are not included in the abovetable, as only a population count was conducted forproject accommodation and hotel/motel.1In some years the total does not equal 100%. This isdue to the difference in the exact mathematical value<strong>of</strong> the numbers and its approximation (due to rounding)used in the above table.10
HOUSINGSummaryThe housing market in the municipality has a high number<strong>of</strong> people per dwelling unit. For example, the averagehousehold size for a single detached dwelling in themunicipality is 3.57 persons, compared to 2.98 in Calgary 8and 2.94 in St. Albert 9 . The average number <strong>of</strong> people perhousehold over time (2000-<strong>2010</strong>) reveals that the number<strong>of</strong> people living in the same unit has, overall, not changednoticeably. This suggests that people have not disbursedinto new units, even though there were approximately13,440 housing starts since 2000. More likely, the newunits are occupied by citizens moving to the municipality 10 .Given the relatively low proportion <strong>of</strong> the population belowthe age <strong>of</strong> 15, this situation can likely be explained by theshortage and high cost <strong>of</strong> housing in the municipality.In <strong>2010</strong>, the rate <strong>of</strong> homeownership in the <strong>Municipal</strong>ityis 66.7%. While this is lower than some years, it is stillrelatively high given the high cost <strong>of</strong> housing. Possibleexplanations could be that many homeowners rent part <strong>of</strong>the home 11 , as some need the additional income to affordthe high cost <strong>of</strong> housing. This would also help explain thehigher than average household size mentioned above.8<strong>2010</strong> Calgary Civic <strong>Census</strong>.9<strong>2010</strong> St. Albert <strong>Municipal</strong> <strong>Census</strong>.10Further research is required to confirm thesesstatements.11During enumeration, if both owner and renters live ina unit, the unit was recorded as owned. This is an issuethat requires further research, which the <strong>Municipal</strong>ity iscurrently addressing.1.9 —Table: Average Number <strong>of</strong> People per Dwelling Type in the <strong>Regional</strong> <strong>Municipal</strong>ity <strong>of</strong> <strong>Wood</strong> <strong>Buffalo</strong>AreaSingleDetachedTownhomeApartment/CondoManufacturedHomeSemi-detachedFort McMurray 3.57 3.20 2.32 2.97 3.34Anzac 3.68 - 1.25 3.17 -Conklin 3.81 - - 3.22 -Draper 4.12 - - 3.43 -Fort Chipewyan 3.15 2.81 1.36 2.98 3.82Fort McKay 2.82 - - 3.33 -Gregoire Lake Estates 3.15 - - 3.00 -Janvier 3.43 - - 2.83 -Saprae Creek 3.81 - - 2.55 -Average 3.57 3.20 2.33 2.98 3.35Note: In the above table, the averages were calculatedin the statistical s<strong>of</strong>tware SPSS using un-weightedcensus data. Since the numbers <strong>of</strong> dwelling unitsused in the calculations may vary substantiallybetween neighbourhoods, it is not recommended theneighbourhood averages be added up.11
1.10 —Table: Table: Average Number <strong>of</strong> People per Household by Dwelling Type in the <strong>Regional</strong> <strong>Municipal</strong>ity <strong>of</strong><strong>Wood</strong> <strong>Buffalo</strong> from 2000 to <strong>2010</strong>Dwelling Type 2000 2002 2004 2005 2006 2008 <strong>2010</strong>Single Detached 3.13 3.30 3.20 3.30 3.30 3.58 3.57Townhome 3.31 3.20 3.40 3.10 1.90 3.10 3.20Apartment/Condo 4.48 2.60 2.50 2.50 2.30 2.27 2.33Manufactured Home 2.70 3.00 3.10 2.90 2.90 3.05 2.98Semi-detached 2.76 3.20 3.10 3.30 2.50 3.28 3.351.11—Table: Average Number <strong>of</strong> People per Dwelling Type in Fort McMurrayAreaSingleDetachedTownhomeApartment/CondoManufacturedSemidetachedAbasand Heights 3.57 3.01 2.81 3.00 3.26 -Beacon Hill 3.52 3.57 - 2.98 4.13 -Gregoire 3.33 2.43 2.08 3.11 2.67 -Lower Townsite 3.42 3.60 2.37 2.33 3.61 -Thickwood Heights 3.50 3.09 2.66 2.60 3.33 -Timberlea 3.67 3.31 2.12 2.91 3.23 -Waterways 3.19 1.50 1.00 2.27 1.50 -Campgrounds - - - - - 1.63Average 3.57 3.20 2.32 2.97 3.34 1.63RVNote: In the above Table, the averages were calculatedin the statistical s<strong>of</strong>tware SPSS using un-weightedcensus data. Since the numbers <strong>of</strong> dwelling unitsused in the calculations may vary substantiallybetween neighbourhoods, it is not recommended theneighbourhood averages be added up.12
1.12 —Table: Average Number <strong>of</strong> People per Household by Dwelling Type in Fort McMurray from 2000 to <strong>2010</strong>Dwelling Type 2000 2002 2004 2005 2006 2008 <strong>2010</strong>Single Detached 3.57 3.40 3.50 3.30 3.30 3.58 3.57Townhome 3.25 3.20 3.40 3.10 2.80 3.09 3.20Apartment/Condo 2.76 2.60 2.70 2.50 2.30 2.26 2.33Manufactured Home 2.91 3.00 3.10 3.00 2.90 3.03 2.97Semi-detached 3.19 3.20 3.30 3.40 2.70 3.29 3.341.13—Table: Percent Tenancy Distribution in the <strong>Regional</strong> <strong>Municipal</strong>ity <strong>of</strong> <strong>Wood</strong> <strong>Buffalo</strong>Area Own Rent/LeaseFort McMurray 66.2 33.8Anzac 81.5 18.5Conklin 80.8 19.2Draper 92.3 7.7Fort Chipewyan 48.0 52.0Fort MacKay 64.3 35.7Gregoire Lake Estates 92.5 7.5Janvier 72.0 28.0Saprae Creek 97.9 2.1Average 66.7 33.3Note: The percent distribution illustrated in the abovetable is based on the response <strong>of</strong> people whetherthey own or rent the unit they occupy; thus the aboveinformation does not reflect type <strong>of</strong> housing.13
1.14—Table: Percent Tenancy Distribution in Fort McMurrayArea Own Rent/LeaseAbasand Heights 70.7 29.3Beacon Hill 77.5 22.5Gregoire 81.3 18.7Lower Townsite 32.8 67.2Thickwood Heights 72.2 27.8Timberlea 70.7 29.3Waterways 78.4 21.6Average 66.2 33.8Note: The percent distribution illustrated in the abovetable is based on the response <strong>of</strong> people whetherthey own or rent the unit they occupy; thus the aboveinformation does not reflect type <strong>of</strong> housing.14